| Param | Original file | Final file |
|---|---|---|
| Filename | modeM0/AS1T02_020T01_9000001990_13519cztM0_level2.evt | modeM0/AS1T02_020T01_9000001990_13519cztM0_level2_quad_clean.evt |
| Size (bytes) | 513,345,600 | 79,649,280 |
| Size | 489.6 MB | 76.0 MB |
| Events in quadrant A | 3,527,742 | 495,060 |
| Events in quadrant B | 3,816,802 | 527,023 |
| Events in quadrant C | 3,808,479 | 478,311 |
| Events in quadrant D | 3,946,207 | 451,443 |
| Mode M0 | |||
|---|---|---|---|
| Quadrant | BADHDUFLAG | Total packets | Discarded packets |
| A | 0 | 14444 | 3 |
| B | 0 | 15347 | 2 |
| C | 0 | 15410 | 2 |
| D | 0 | 15767 | 2 |
| Mode M9 | |||
|---|---|---|---|
| Quadrant | BADHDUFLAG | Total packets | Discarded packets |
| A | 0 | 17 | 0 |
| B | 0 | 17 | 0 |
| C | 0 | 17 | 0 |
| D | 0 | 18 | 0 |
| Mode SS | |||
|---|---|---|---|
| Quadrant | BADHDUFLAG | Total packets | Discarded packets |
| A | 0 | 134 | 0 |
| B | 0 | 134 | 0 |
| C | 0 | 134 | 0 |
| D | 0 | 134 | 0 |
| Quadrant | Total seconds | Saturated seconds | Saturation percentage |
|---|---|---|---|
| A | 6597 | 141 | 2.137335% |
| B | 6597 | 169 | 2.561771% |
| C | 6597 | 95 | 1.440049% |
| D | 6597 | 126 | 1.909959% |
Noise dominated data is calculated using 1-second bins in cleaned event files. If a bin has >2000 counts, and if more than 50% of those come from <1% of pixels, then it is considered to be noise-dominated and hence unusable.
| Quadrant | # 1 sec bins | Bins with >0 counts | Bins with >2000 counts | High rate bins dominated by noise | Noise dominated (total time) | Noise dominated (detector-on time) | Marked lightcurve |
|---|---|---|---|---|---|---|---|
| A | 7848 | 6598 | 4 | 4 | 0.05% | 0.06% | 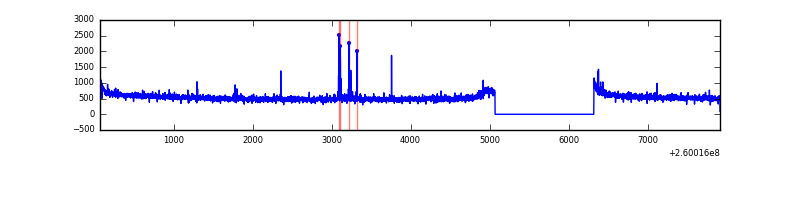 |
| B | 7848 | 6598 | 27 | 27 | 0.34% | 0.41% | 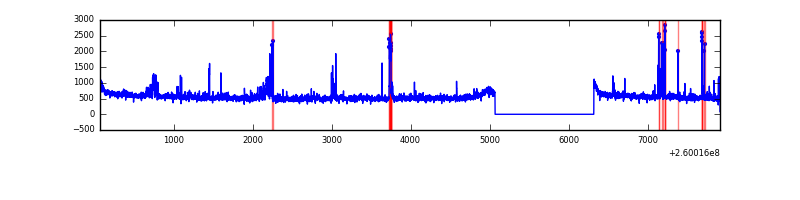 |
| C | 7848 | 6598 | 0 | 0 | 0.00% | 0.00% | 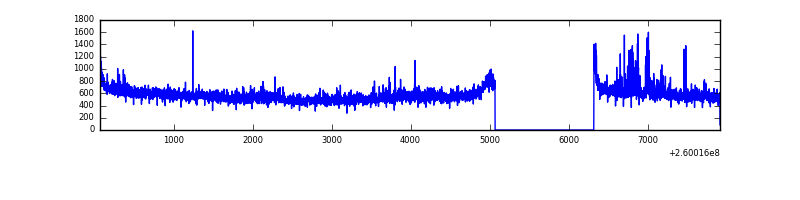 |
| D | 7848 | 6598 | 13 | 13 | 0.17% | 0.20% |  |
Top three noisy pixels from each quadrant. If the there are fewer than three noisy pixels in the level2.evt file, extra rows are filled as -1
| Pixel properties | Quadrant properties | ||||||
|---|---|---|---|---|---|---|---|
| Quadrant | DetID | PixID | Counts | Sigma | Mean | Median | Sigma |
| A | 1 | 162 | 34757 | 188.07 | 897 | 881 | 180.1 |
| A | 15 | 69 | 16001 | 83.94 | 897 | 881 | 180.1 |
| A | 1 | 178 | 11640 | 59.73 | 897 | 881 | 180.1 |
| B | 3 | 64 | 184867 | 1106.21 | 896 | 879 | 166.3 |
| B | 0 | 189 | 44061 | 259.63 | 896 | 879 | 166.3 |
| B | 3 | 209 | 32714 | 191.4 | 896 | 879 | 166.3 |
| C | 3 | 233 | 469617 | 2412.57 | 855 | 860 | 194.3 |
| C | 13 | 61 | 6202 | 27.49 | 855 | 860 | 194.3 |
| C | 0 | 207 | 4648 | 19.5 | 855 | 860 | 194.3 |
| D | 12 | 110 | 390810 | 1920.28 | 859 | 837 | 203.1 |
| D | 8 | 195 | 178611 | 875.38 | 859 | 837 | 203.1 |
| D | 13 | 104 | 103108 | 503.6 | 859 | 837 | 203.1 |
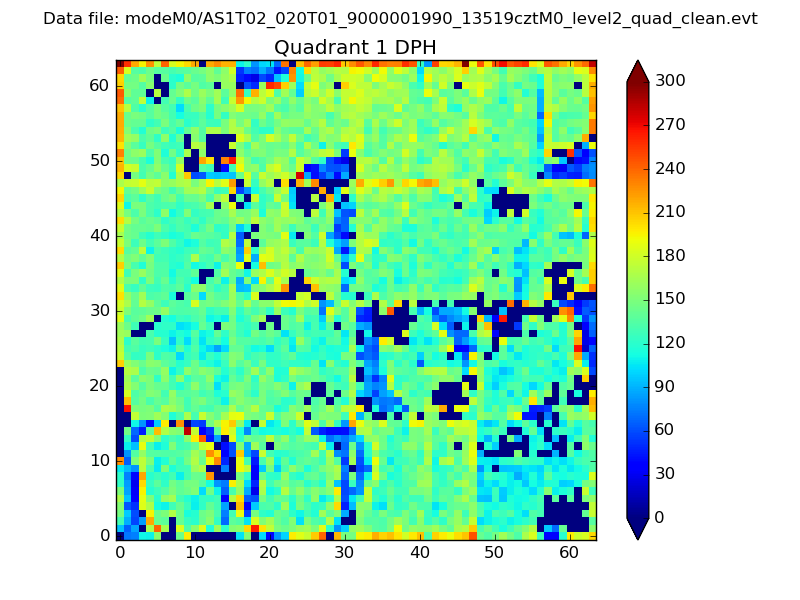
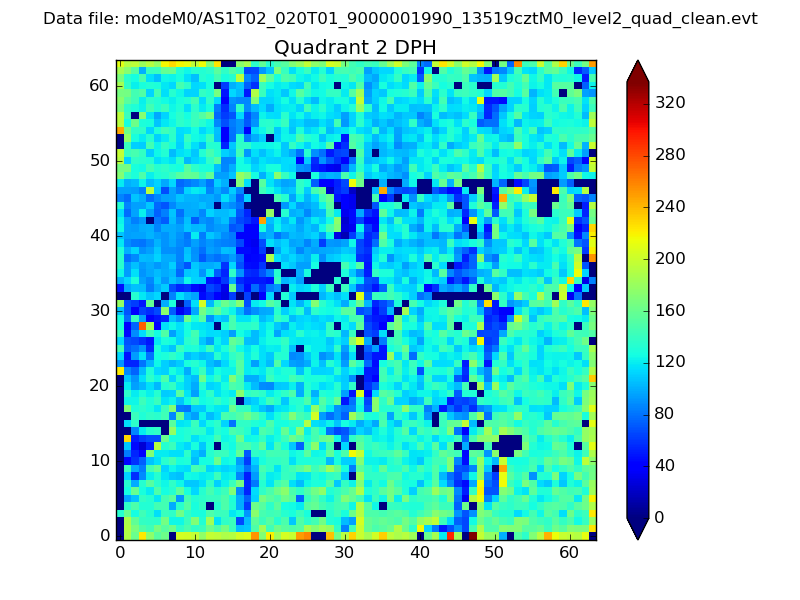
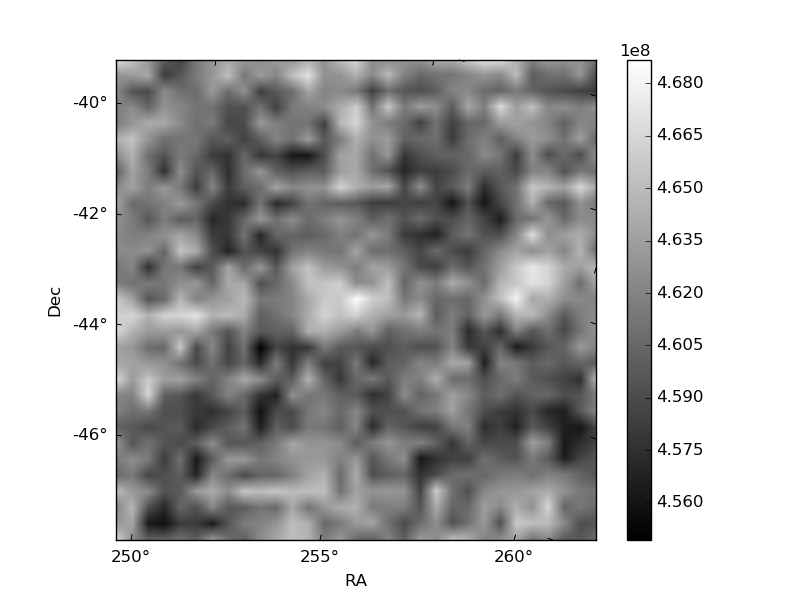
Histogram calculated using DETX and DETY for each event in the final _common_clean file
| Quadrant A | 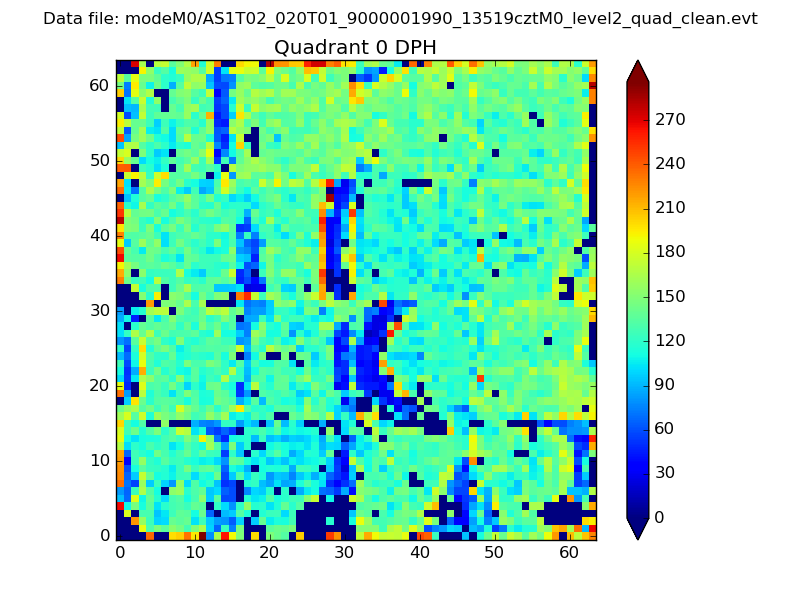 |
 |
Quadrant B |
|---|---|---|---|
| Quadrant D | 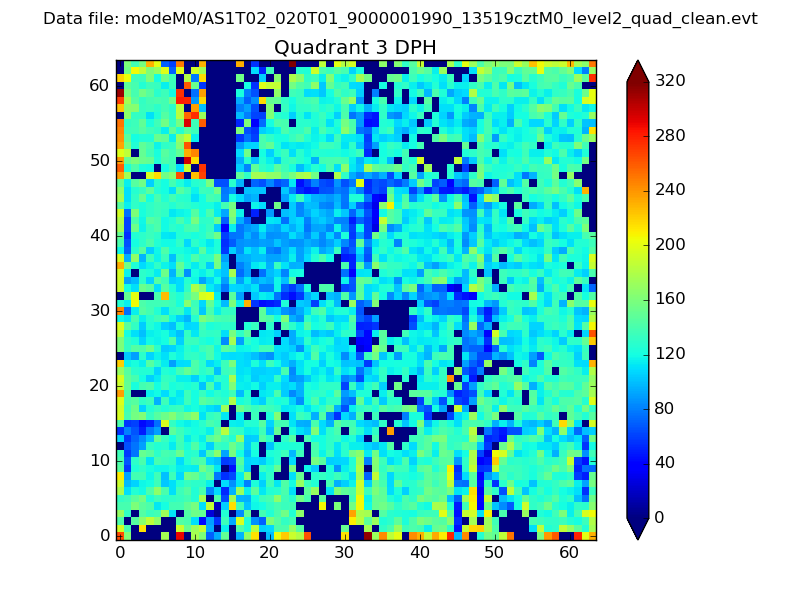 |
 |
Quadrant C |
| Plot type | Count rate plots | Images |
|---|---|---|
| Comparison with Poisson distribution Blue bars denote a histogram of data divided into 1 sec bins. Red curve is a Poisson curve with rate = median count rate of data. |
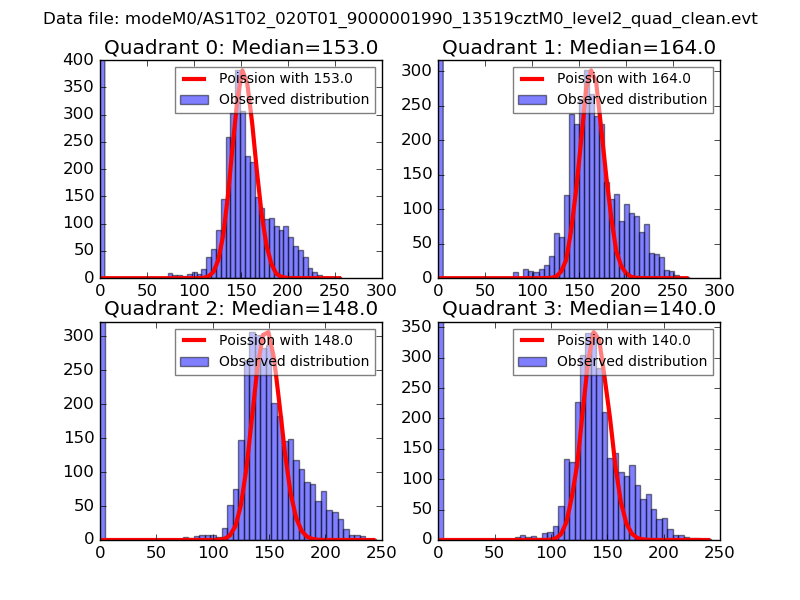 |
 |
| Quadrant-wise count rates Data is divided into 100 sec bins |
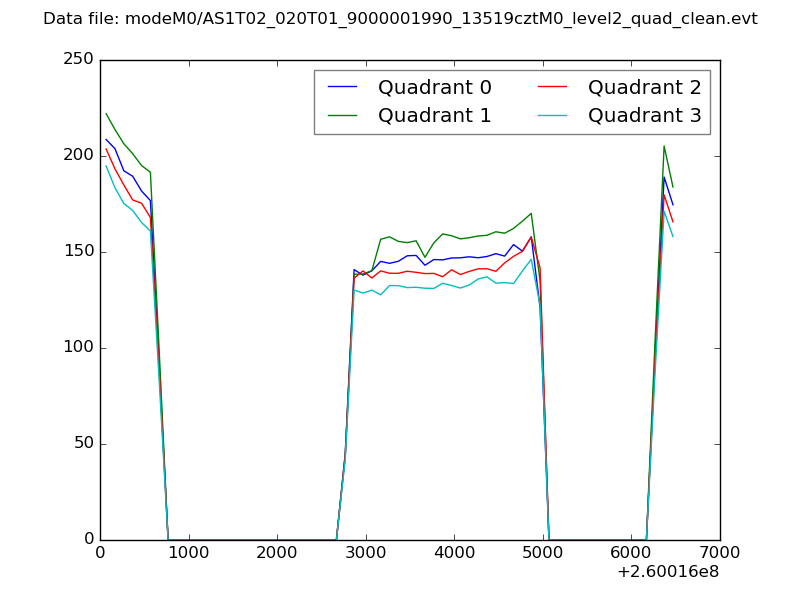 |
|
| Module-wise count rates for Quadrant A Data is divided into 100 sec bins |
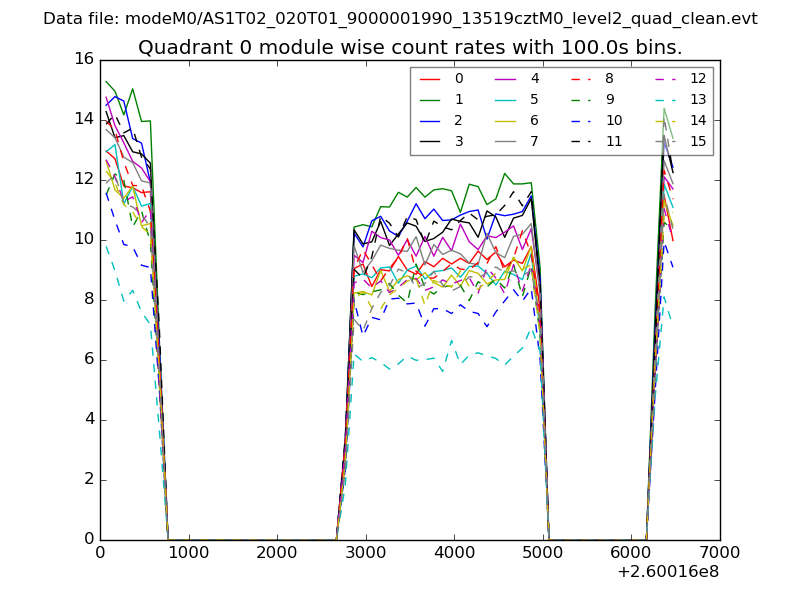 |
 |
| Module-wise count rates for Quadrant B Data is divided into 100 sec bins |
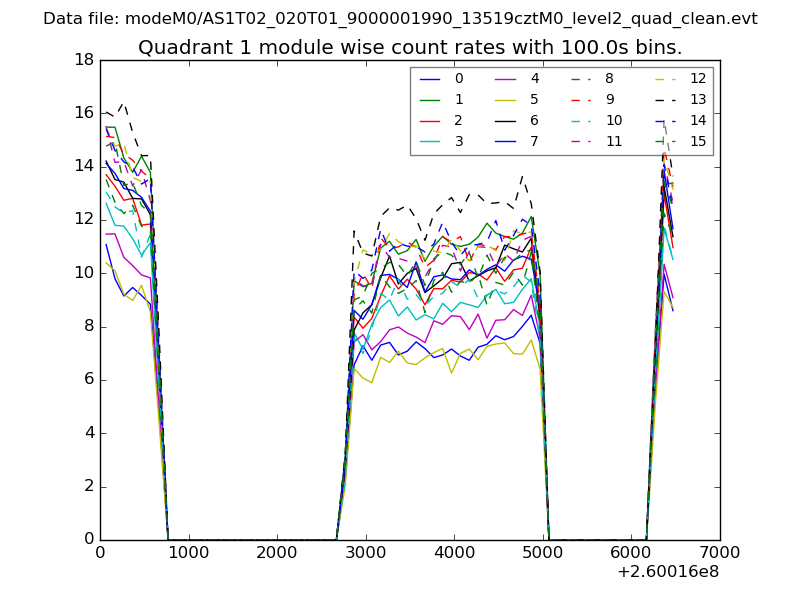 |
 |
| Module-wise count rates for Quadrant C Data is divided into 100 sec bins |
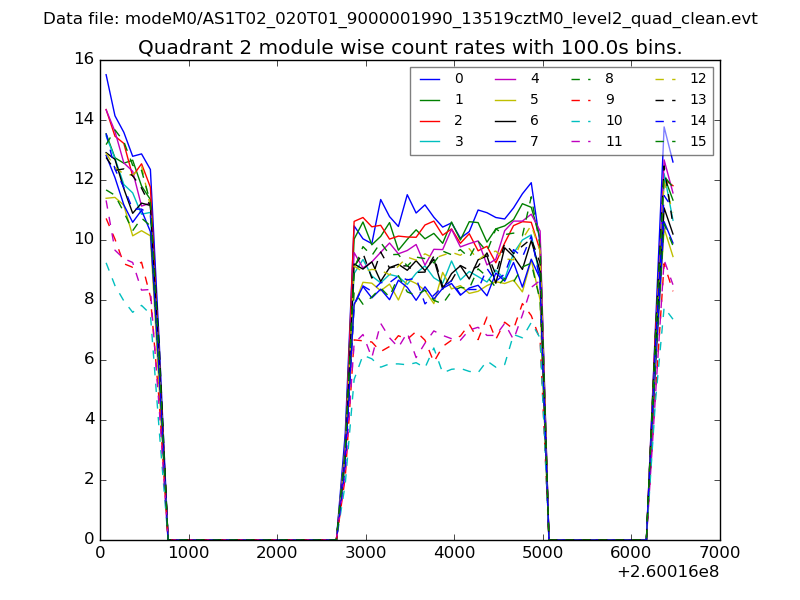 |
 |
| Module-wise count rates for Quadrant D Data is divided into 100 sec bins |
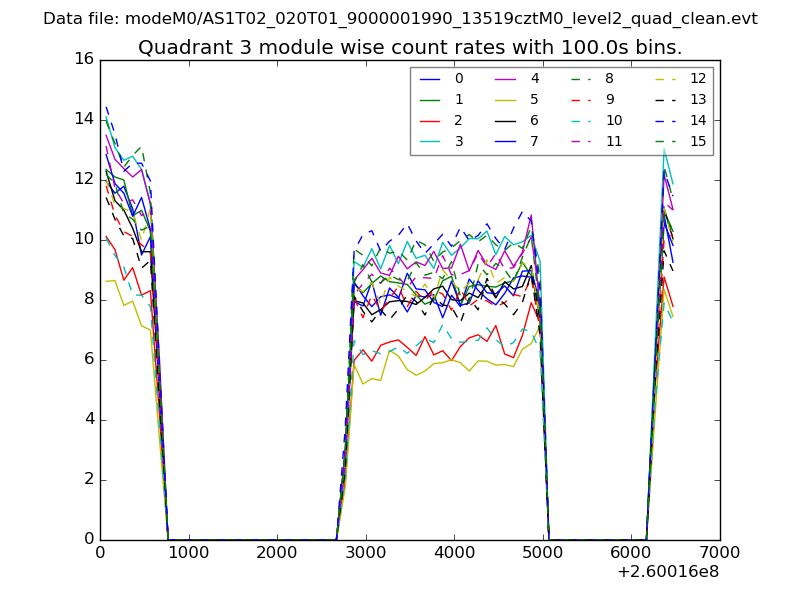 |
 |
| Parameter | Plot |
|---|---|
| CZT HV Monitor | 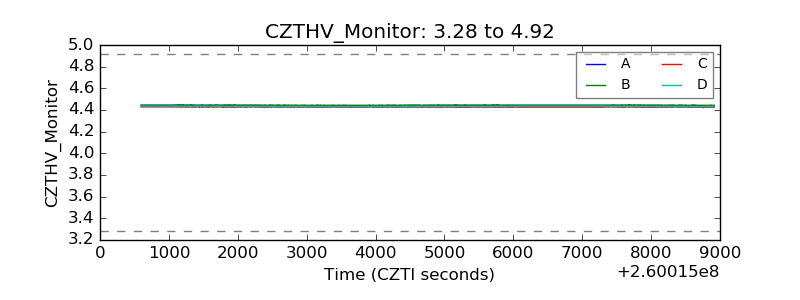 |
| D_VDD |  |
| Temperature 1 | 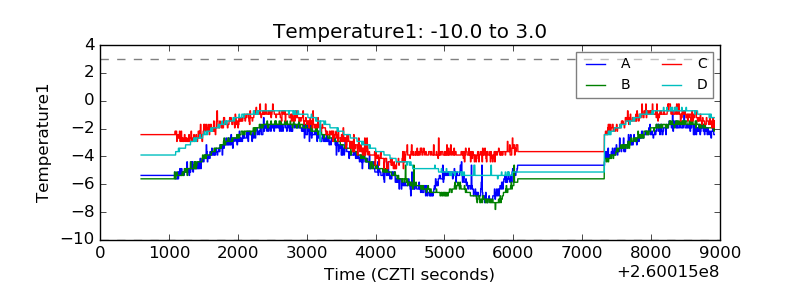 |
| Veto HV Monitor | 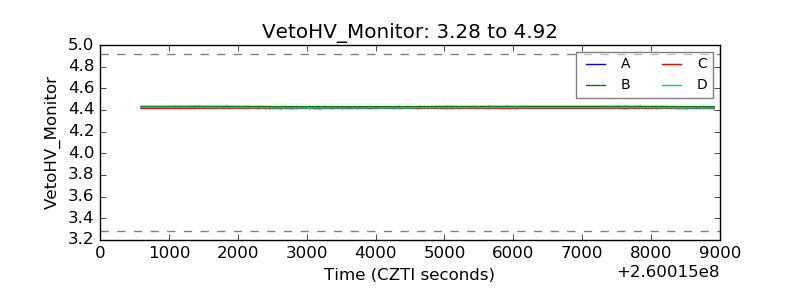 |
| Veto LLD | 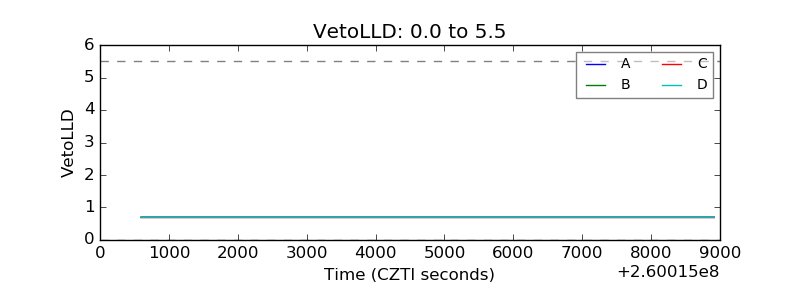 |
| Alpha Counter | 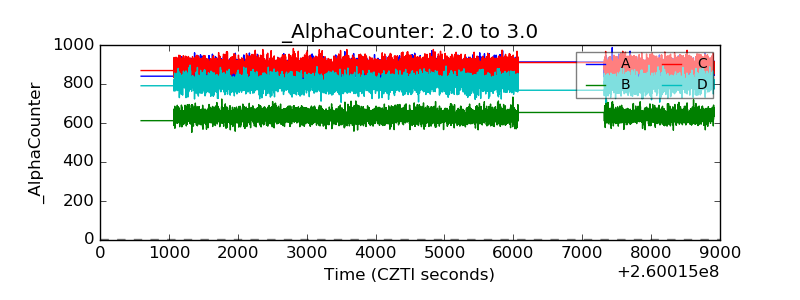 |
| _CPM_Rate | 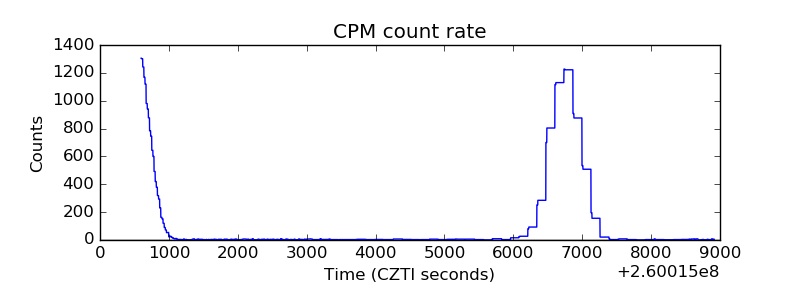 |
| CZT Counter | 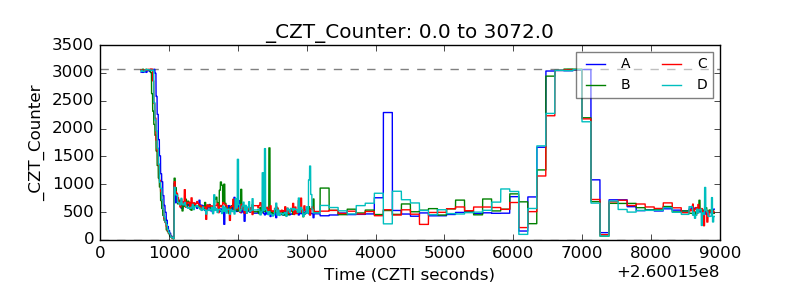 |
| +2.5 Volts monitor |  |
| +5 Volts monitor | 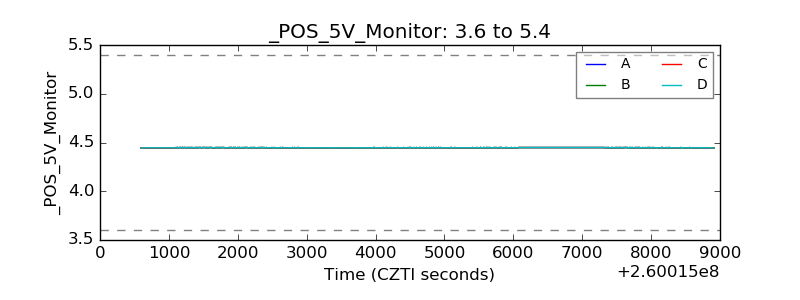 |
| _ROLL_ROT | 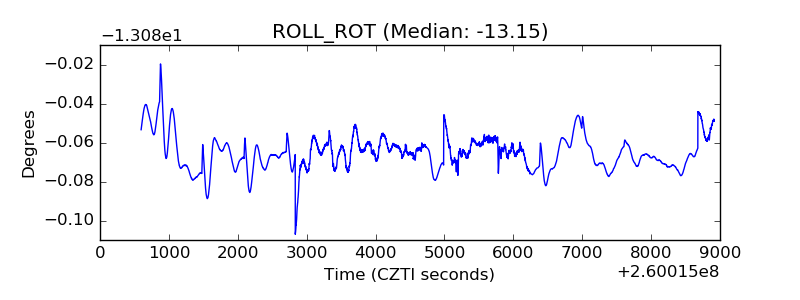 |
| _Roll_DEC | 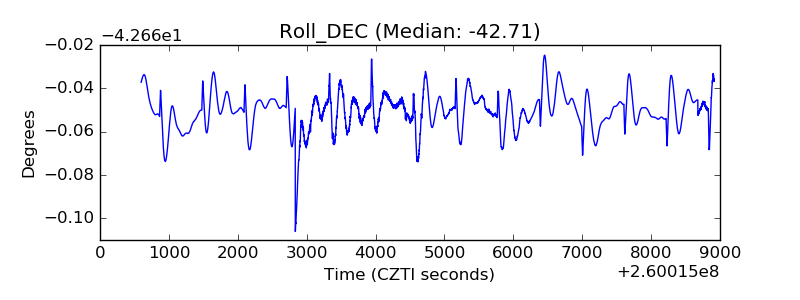 |
| _Roll_RA | 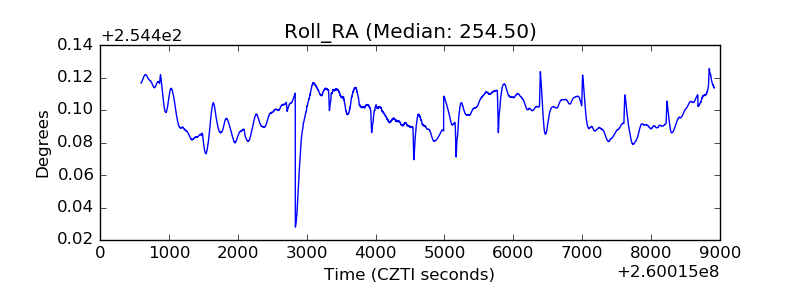 |
| Veto Counter | 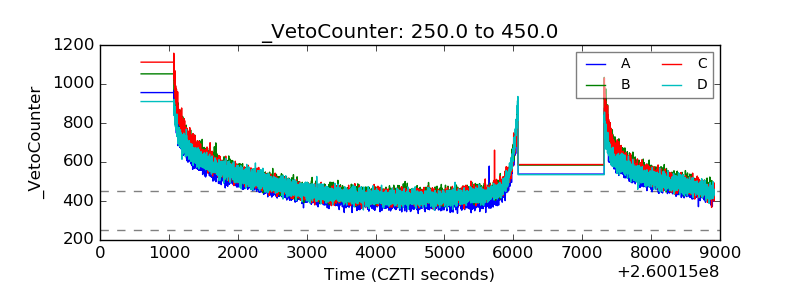 |