| Param | Original file | Final file |
|---|---|---|
| Filename | modeM0/AS1T02_020T01_9000001990_13520cztM0_level2.evt | modeM0/AS1T02_020T01_9000001990_13520cztM0_level2_quad_clean.evt |
| Size (bytes) | 488,373,120 | 66,830,400 |
| Size | 465.7 MB | 63.7 MB |
| Events in quadrant A | 3,275,902 | 402,313 |
| Events in quadrant B | 3,995,425 | 415,335 |
| Events in quadrant C | 3,730,428 | 386,848 |
| Events in quadrant D | 3,353,469 | 371,482 |
| Mode M0 | |||
|---|---|---|---|
| Quadrant | BADHDUFLAG | Total packets | Discarded packets |
| A | 0 | 13544 | 2 |
| B | 0 | 15768 | 1 |
| C | 0 | 15004 | 1 |
| D | 0 | 13990 | 1 |
| Mode M9 | |||
|---|---|---|---|
| Quadrant | BADHDUFLAG | Total packets | Discarded packets |
| A | 0 | 12 | 0 |
| B | 0 | 12 | 0 |
| C | 0 | 12 | 0 |
| D | 0 | 12 | 0 |
| Mode SS | |||
|---|---|---|---|
| Quadrant | BADHDUFLAG | Total packets | Discarded packets |
| A | 0 | 130 | 0 |
| B | 0 | 130 | 0 |
| C | 0 | 130 | 0 |
| D | 0 | 130 | 0 |
| Quadrant | Total seconds | Saturated seconds | Saturation percentage |
|---|---|---|---|
| A | 6412 | 106 | 1.653150% |
| B | 6412 | 276 | 4.304429% |
| C | 6412 | 86 | 1.341235% |
| D | 6412 | 81 | 1.263256% |
Noise dominated data is calculated using 1-second bins in cleaned event files. If a bin has >2000 counts, and if more than 50% of those come from <1% of pixels, then it is considered to be noise-dominated and hence unusable.
| Quadrant | # 1 sec bins | Bins with >0 counts | Bins with >2000 counts | High rate bins dominated by noise | Noise dominated (total time) | Noise dominated (detector-on time) | Marked lightcurve |
|---|---|---|---|---|---|---|---|
| A | 7584 | 6413 | 0 | 0 | 0.00% | 0.00% | 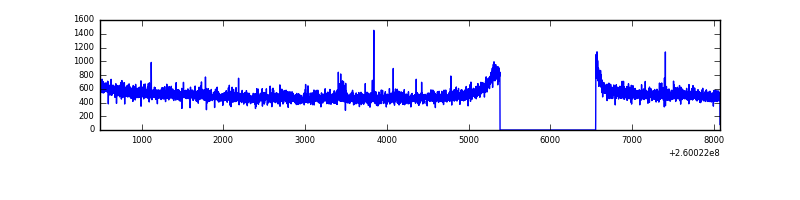 |
| B | 7584 | 6413 | 136 | 136 | 1.79% | 2.12% | 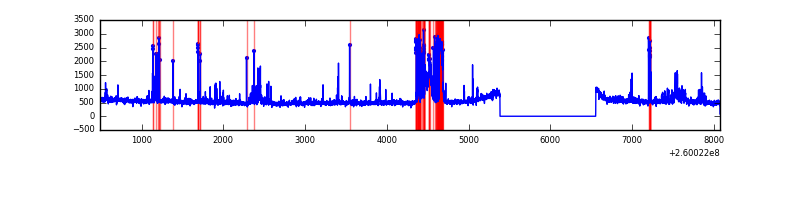 |
| C | 7584 | 6413 | 2 | 2 | 0.03% | 0.03% | 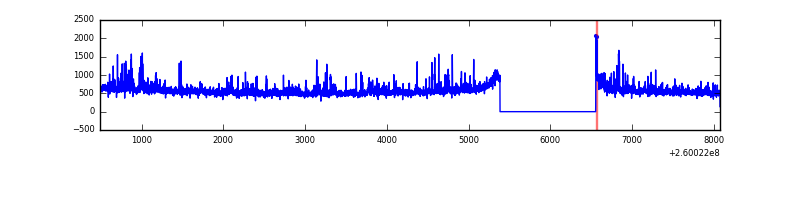 |
| D | 7584 | 6413 | 5 | 5 | 0.07% | 0.08% | 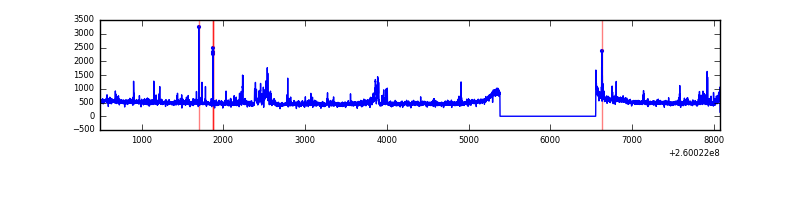 |
Top three noisy pixels from each quadrant. If the there are fewer than three noisy pixels in the level2.evt file, extra rows are filled as -1
| Pixel properties | Quadrant properties | ||||||
|---|---|---|---|---|---|---|---|
| Quadrant | DetID | PixID | Counts | Sigma | Mean | Median | Sigma |
| A | 1 | 162 | 24799 | 141.37 | 839 | 822 | 169.6 |
| A | 1 | 178 | 8407 | 44.72 | 839 | 822 | 169.6 |
| A | 1 | 161 | 7502 | 39.39 | 839 | 822 | 169.6 |
| B | 3 | 64 | 550830 | 3520.06 | 832 | 815 | 156.3 |
| B | 0 | 189 | 73291 | 463.84 | 832 | 815 | 156.3 |
| B | 4 | 142 | 39422 | 247.08 | 832 | 815 | 156.3 |
| C | 3 | 233 | 605233 | 3307.41 | 800 | 805 | 182.7 |
| C | 13 | 61 | 5847 | 27.59 | 800 | 805 | 182.7 |
| C | 0 | 207 | 3446 | 14.45 | 800 | 805 | 182.7 |
| D | 8 | 195 | 223956 | 1165.2 | 804 | 781 | 191.5 |
| D | 13 | 104 | 68780 | 355.02 | 804 | 781 | 191.5 |
| D | 2 | 234 | 23681 | 119.56 | 804 | 781 | 191.5 |
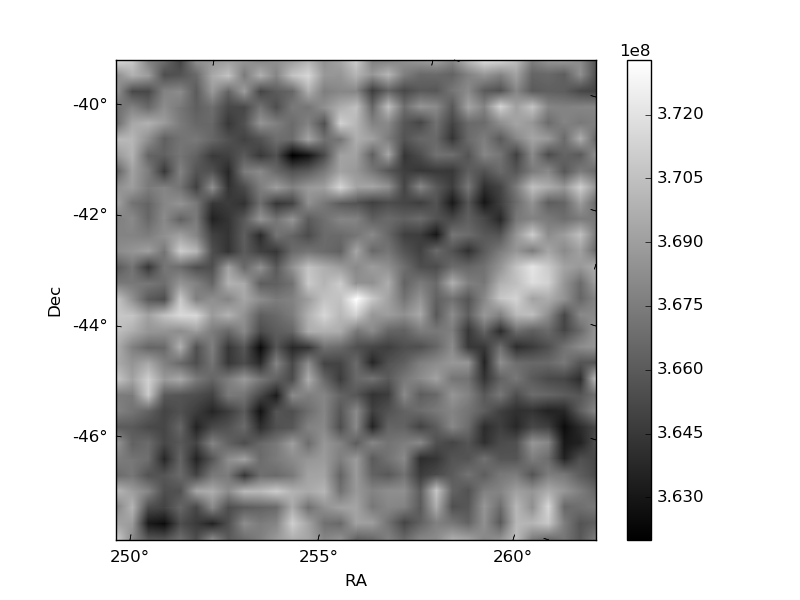
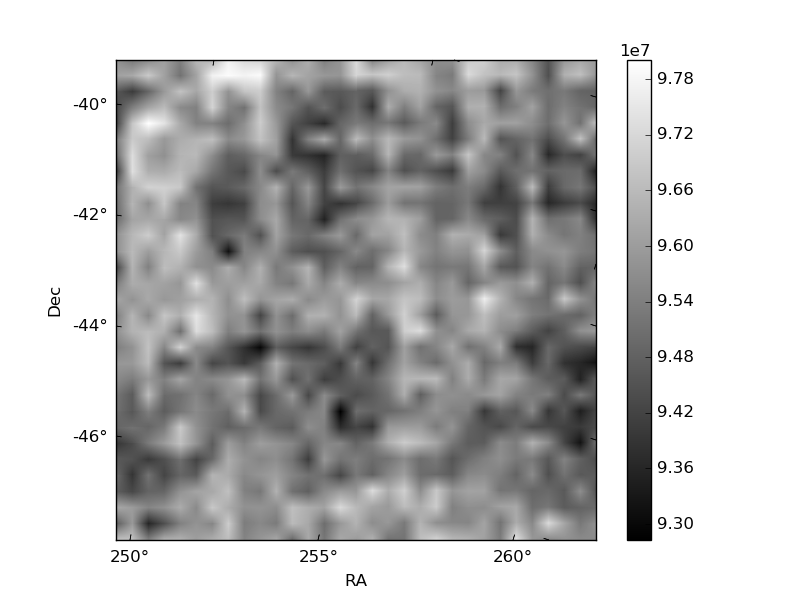
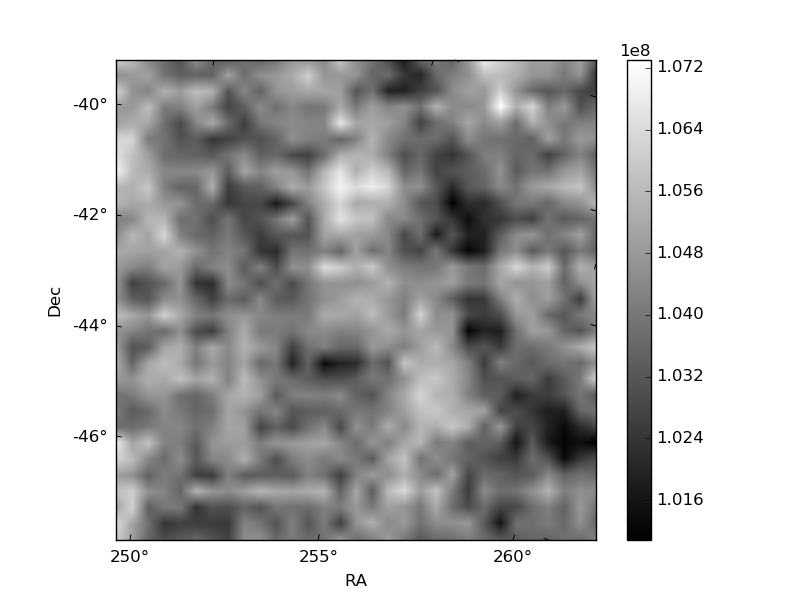
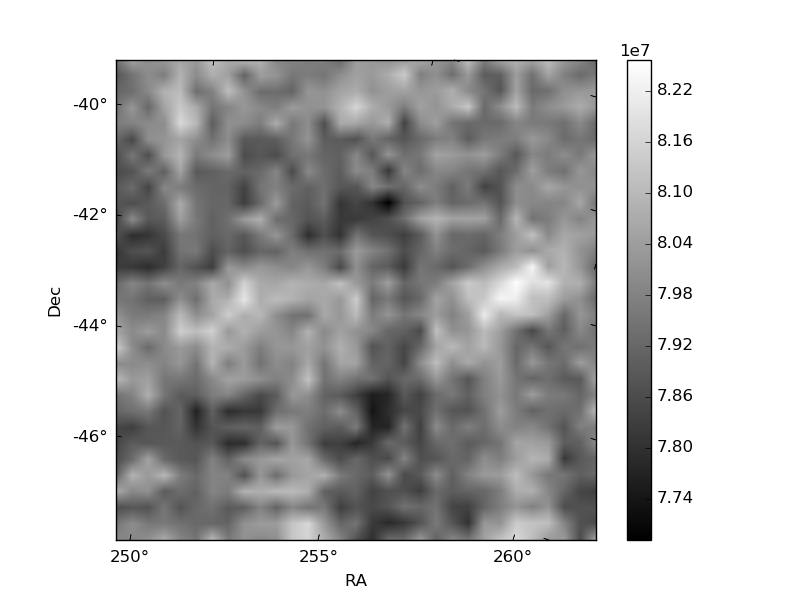
Histogram calculated using DETX and DETY for each event in the final _common_clean file
| Quadrant A | 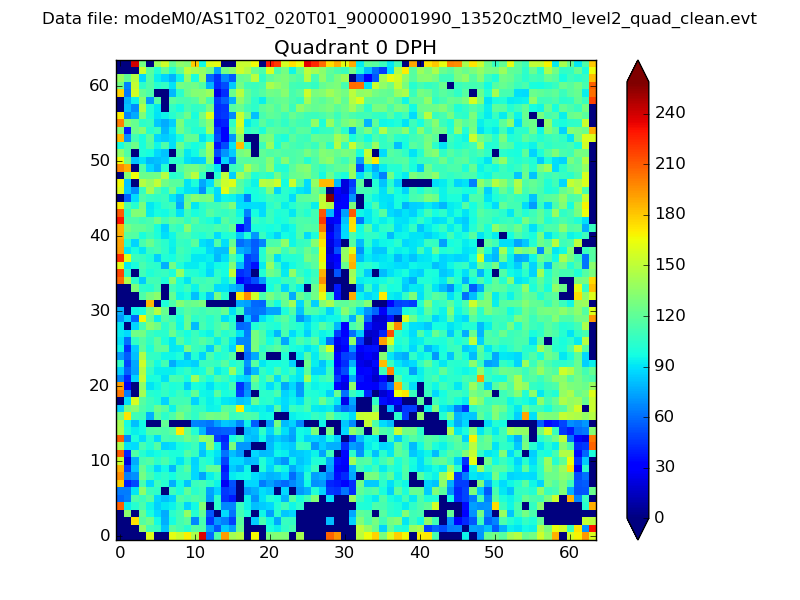 |
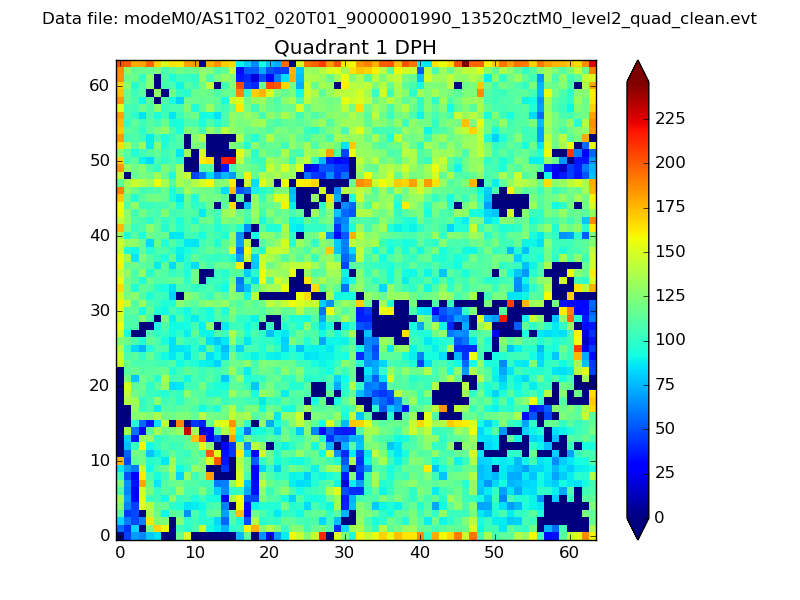 |
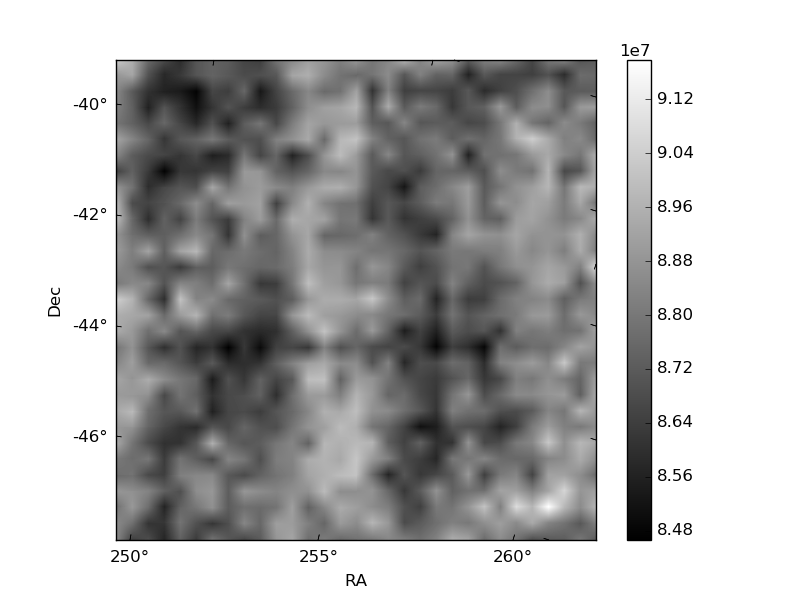
Quadrant B |
|---|---|---|---|
| Quadrant D | 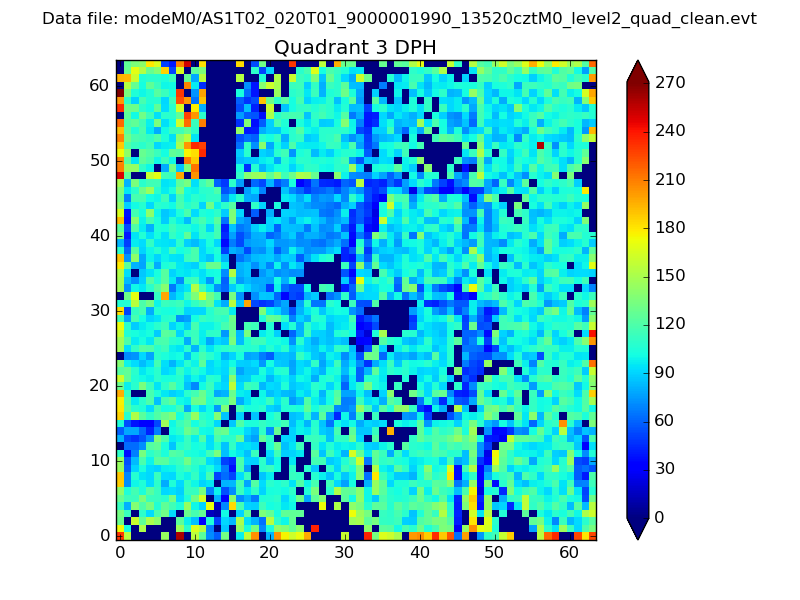 |
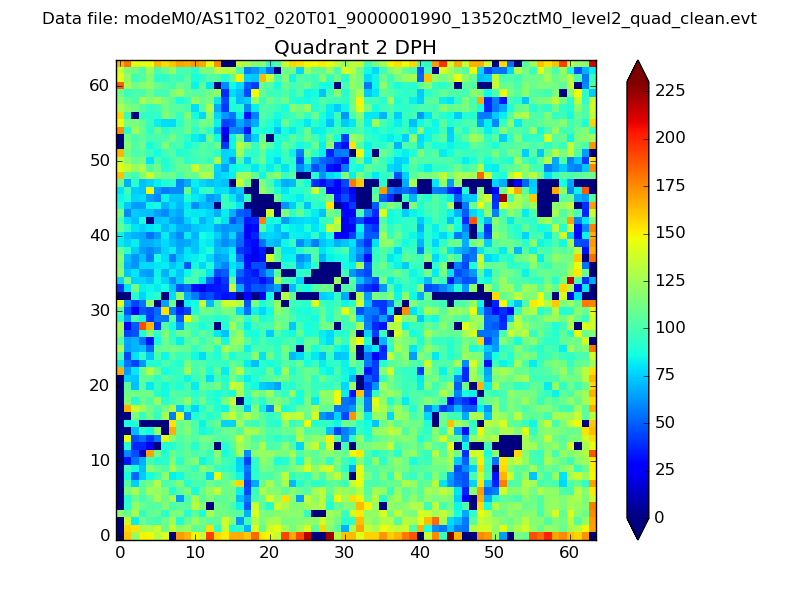 |
Quadrant C |
| Plot type | Count rate plots | Images |
|---|---|---|
| Comparison with Poisson distribution Blue bars denote a histogram of data divided into 1 sec bins. Red curve is a Poisson curve with rate = median count rate of data. |
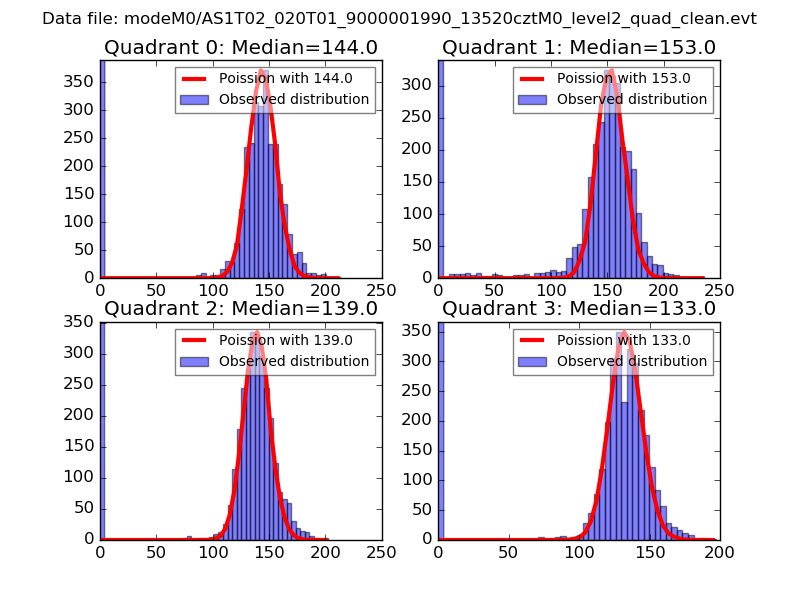 |
 |
| Quadrant-wise count rates Data is divided into 100 sec bins |
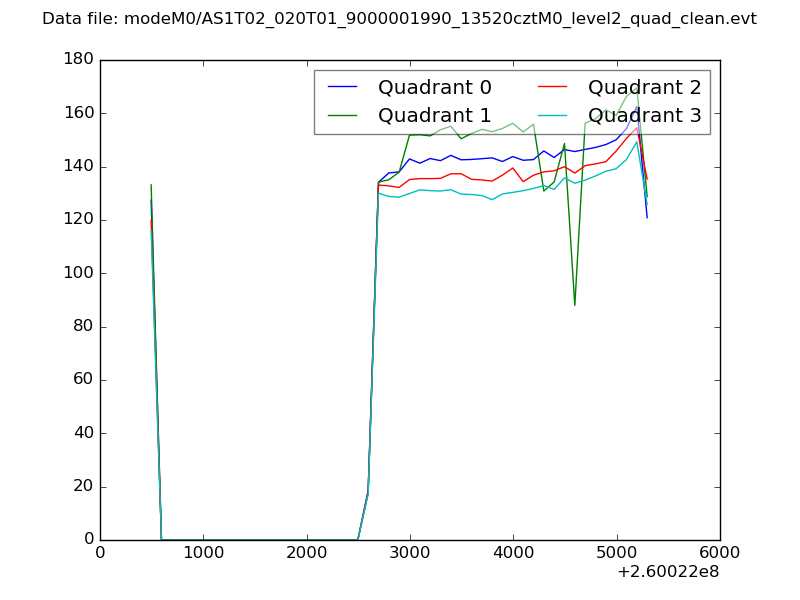 |
|
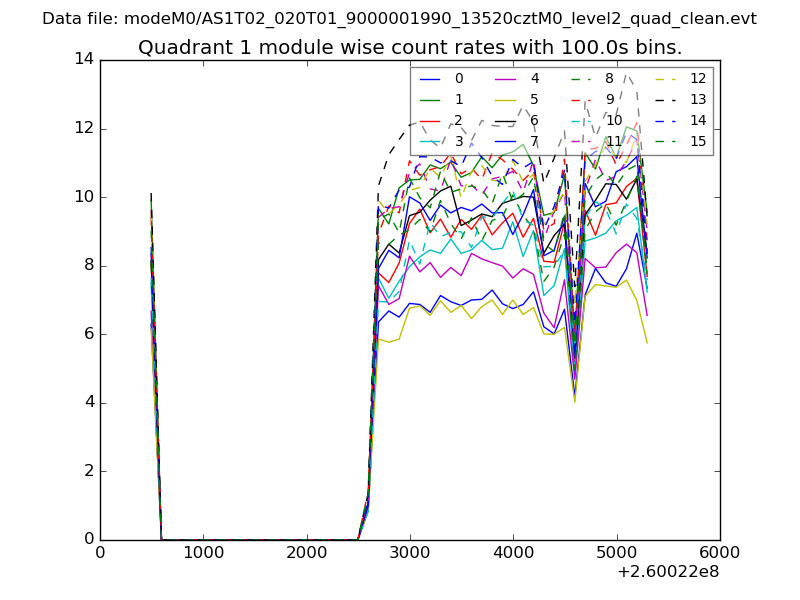
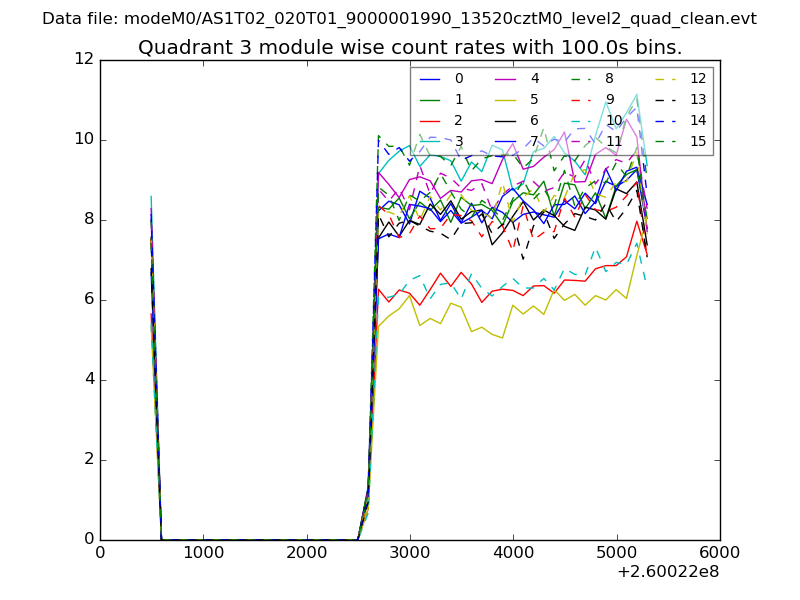
| Module-wise count rates for Quadrant A Data is divided into 100 sec bins |
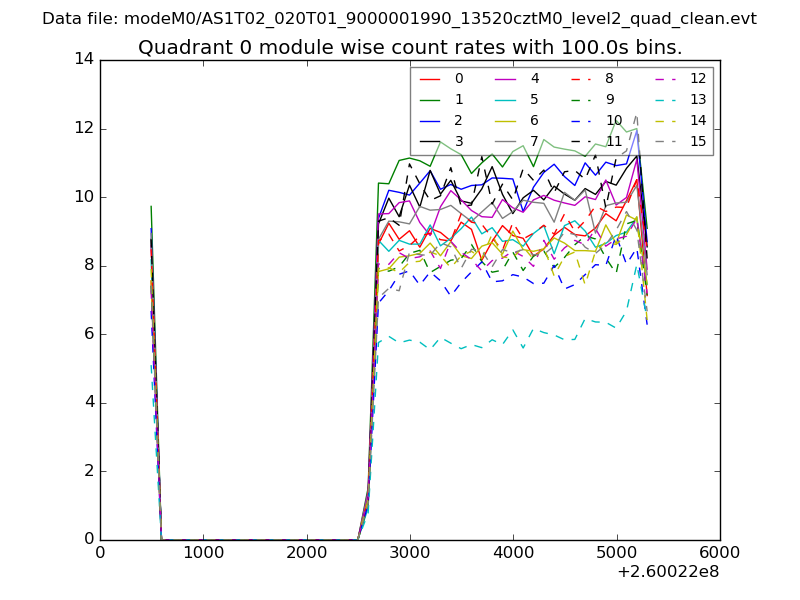 |
 |
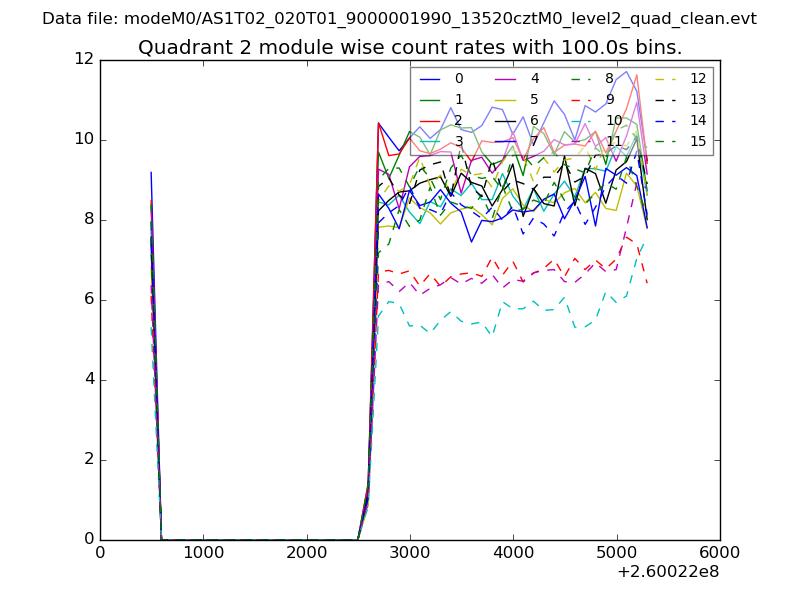
| Module-wise count rates for Quadrant B Data is divided into 100 sec bins |
 |
 |
| Module-wise count rates for Quadrant C Data is divided into 100 sec bins |
 |
 |
| Module-wise count rates for Quadrant D Data is divided into 100 sec bins |
 |
 |
| Parameter | Plot |
|---|---|
| CZT HV Monitor | 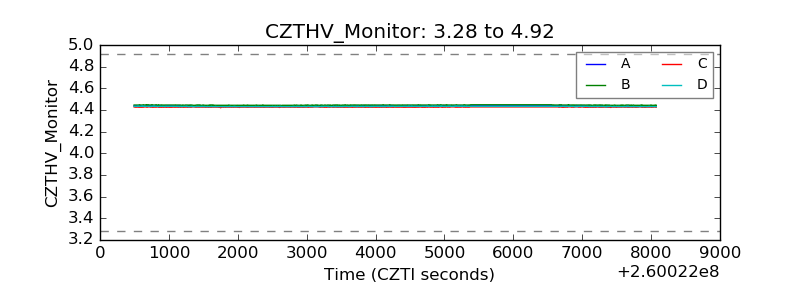 |
| D_VDD | 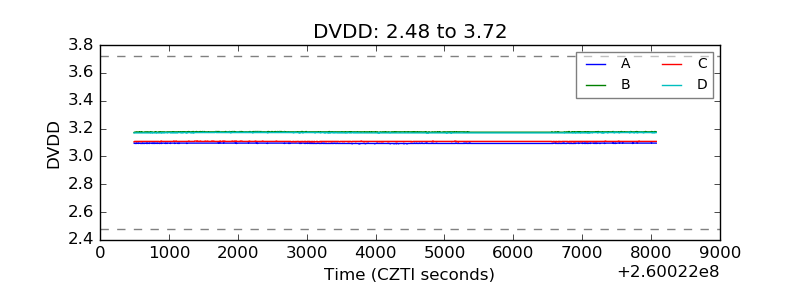 |
| Temperature 1 | 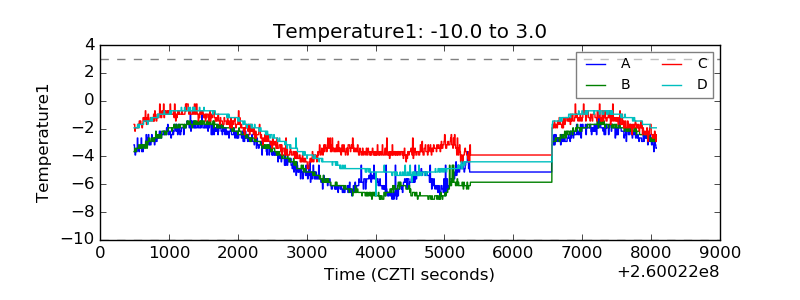 |
| Veto HV Monitor | 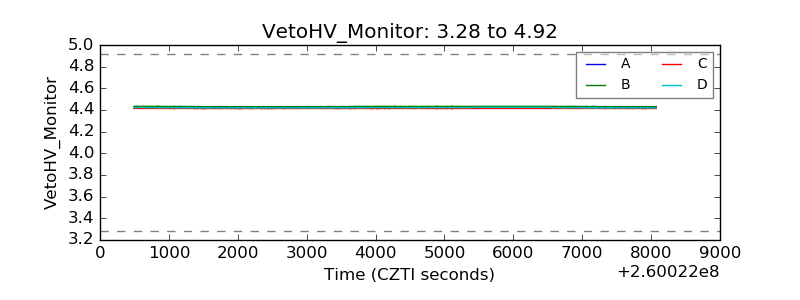 |
| Veto LLD | 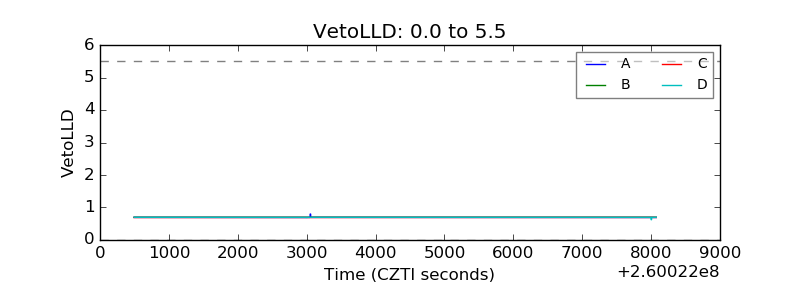 |
| Alpha Counter | 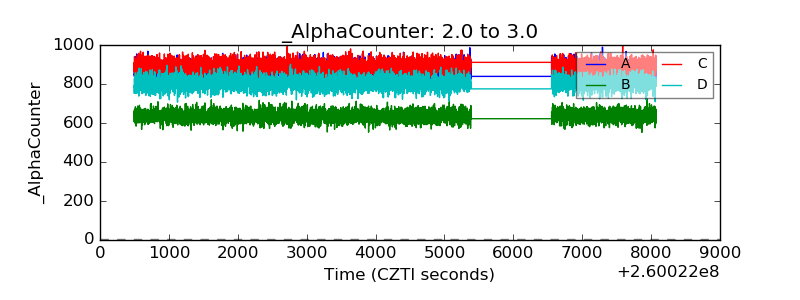 |
| _CPM_Rate | 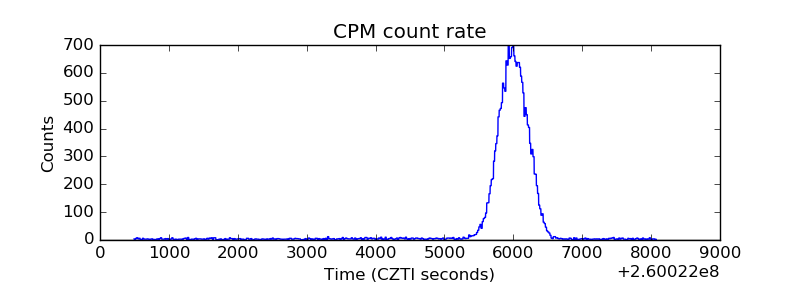 |
| CZT Counter | 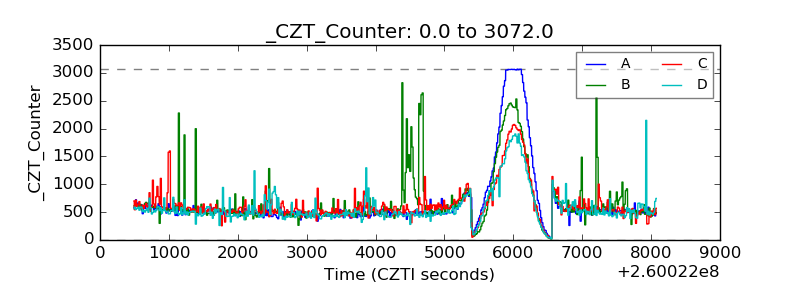 |
| +2.5 Volts monitor | 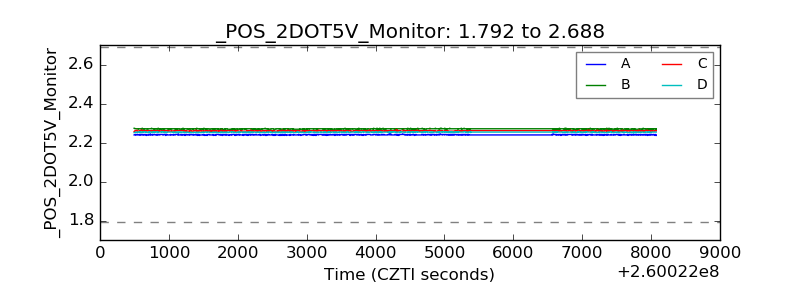 |
| +5 Volts monitor |  |
| _ROLL_ROT | 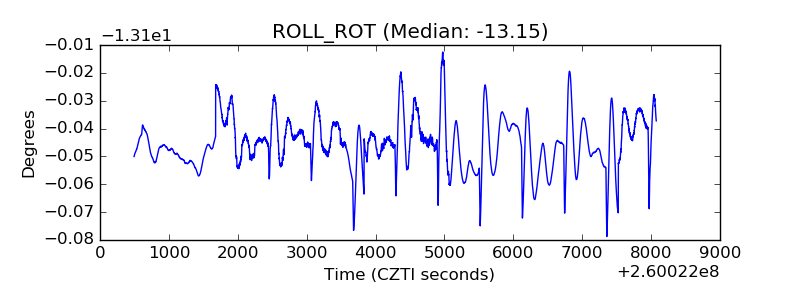 |
| _Roll_DEC | 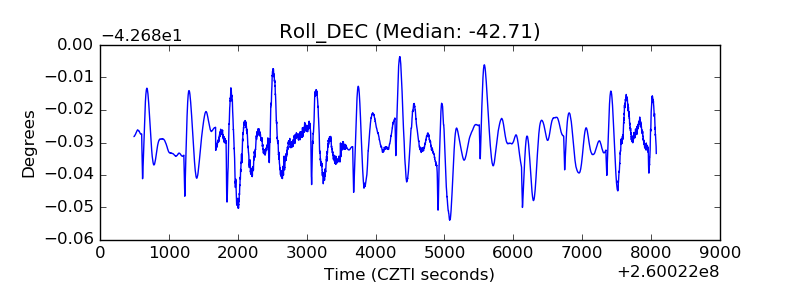 |
| _Roll_RA | 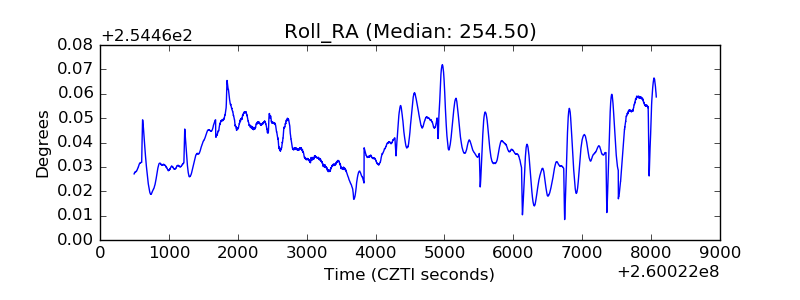 |
| Veto Counter | 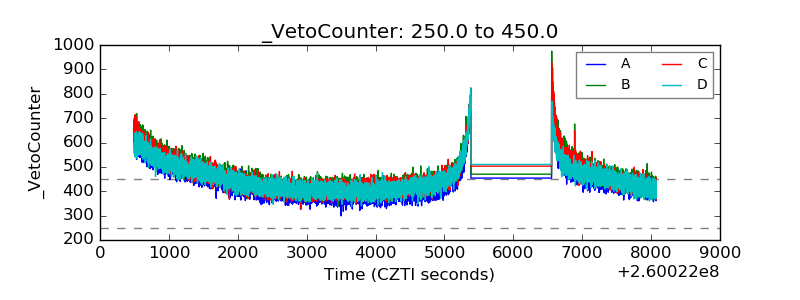 |