| Param | Original file | Final file |
|---|---|---|
| Filename | modeM0/AS1T02_020T01_9000001990_13521cztM0_level2.evt | modeM0/AS1T02_020T01_9000001990_13521cztM0_level2_quad_clean.evt |
| Size (bytes) | 508,728,960 | 76,224,960 |
| Size | 485.2 MB | 72.7 MB |
| Events in quadrant A | 3,345,015 | 466,737 |
| Events in quadrant B | 3,776,831 | 499,140 |
| Events in quadrant C | 3,614,238 | 451,456 |
| Events in quadrant D | 4,211,275 | 418,770 |
| Mode M0 | |||
|---|---|---|---|
| Quadrant | BADHDUFLAG | Total packets | Discarded packets |
| A | 0 | 14168 | 3 |
| B | 0 | 15415 | 2 |
| C | 0 | 14807 | 2 |
| D | 0 | 16942 | 2 |
| Mode M9 | |||
|---|---|---|---|
| Quadrant | BADHDUFLAG | Total packets | Discarded packets |
| A | 0 | 10 | 0 |
| B | 0 | 10 | 0 |
| C | 0 | 10 | 0 |
| D | 0 | 10 | 0 |
| Mode SS | |||
|---|---|---|---|
| Quadrant | BADHDUFLAG | Total packets | Discarded packets |
| A | 0 | 136 | 0 |
| B | 0 | 136 | 0 |
| C | 0 | 136 | 0 |
| D | 0 | 136 | 0 |
| Quadrant | Total seconds | Saturated seconds | Saturation percentage |
|---|---|---|---|
| A | 6775 | 109 | 1.608856% |
| B | 6775 | 173 | 2.553506% |
| C | 6775 | 80 | 1.180812% |
| D | 6776 | 243 | 3.586187% |
Noise dominated data is calculated using 1-second bins in cleaned event files. If a bin has >2000 counts, and if more than 50% of those come from <1% of pixels, then it is considered to be noise-dominated and hence unusable.
| Quadrant | # 1 sec bins | Bins with >0 counts | Bins with >2000 counts | High rate bins dominated by noise | Noise dominated (total time) | Noise dominated (detector-on time) | Marked lightcurve |
|---|---|---|---|---|---|---|---|
| A | 7716 | 6776 | 0 | 0 | 0.00% | 0.00% | 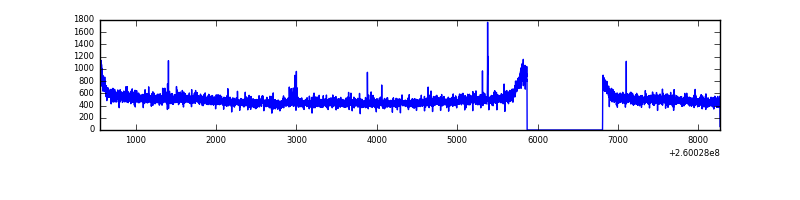 |
| B | 7716 | 6776 | 35 | 35 | 0.45% | 0.52% | 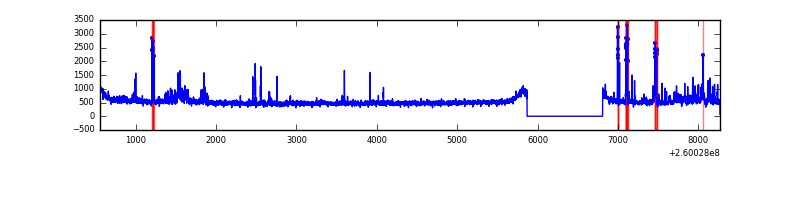 |
| C | 7716 | 6776 | 8 | 8 | 0.10% | 0.12% | 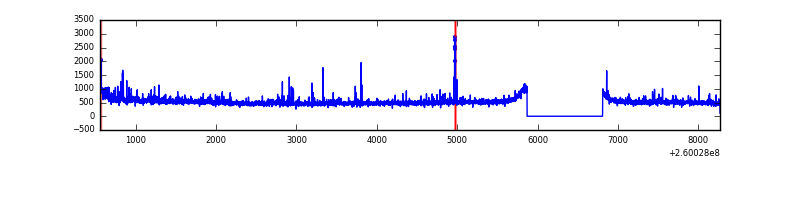 |
| D | 7717 | 6777 | 187 | 187 | 2.42% | 2.76% | 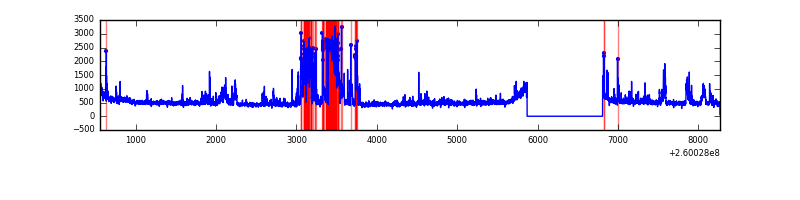 |
Top three noisy pixels from each quadrant. If the there are fewer than three noisy pixels in the level2.evt file, extra rows are filled as -1
| Pixel properties | Quadrant properties | ||||||
|---|---|---|---|---|---|---|---|
| Quadrant | DetID | PixID | Counts | Sigma | Mean | Median | Sigma |
| A | 1 | 162 | 22013 | 120.71 | 859 | 840 | 175.4 |
| A | 0 | 226 | 7742 | 39.35 | 859 | 840 | 175.4 |
| A | 1 | 178 | 7645 | 38.8 | 859 | 840 | 175.4 |
| B | 3 | 64 | 246900 | 1494.96 | 859 | 839 | 164.6 |
| B | 0 | 189 | 76942 | 462.37 | 859 | 839 | 164.6 |
| B | 4 | 142 | 66287 | 397.63 | 859 | 839 | 164.6 |
| C | 3 | 233 | 397047 | 2082.8 | 825 | 828 | 190.2 |
| C | 13 | 61 | 5871 | 26.51 | 825 | 828 | 190.2 |
| C | 0 | 207 | 2523 | 8.91 | 825 | 828 | 190.2 |
| D | 13 | 104 | 796474 | 4093.27 | 816 | 793 | 194.4 |
| D | 8 | 195 | 230069 | 1179.48 | 816 | 793 | 194.4 |
| D | 12 | 110 | 60954 | 309.49 | 816 | 793 | 194.4 |
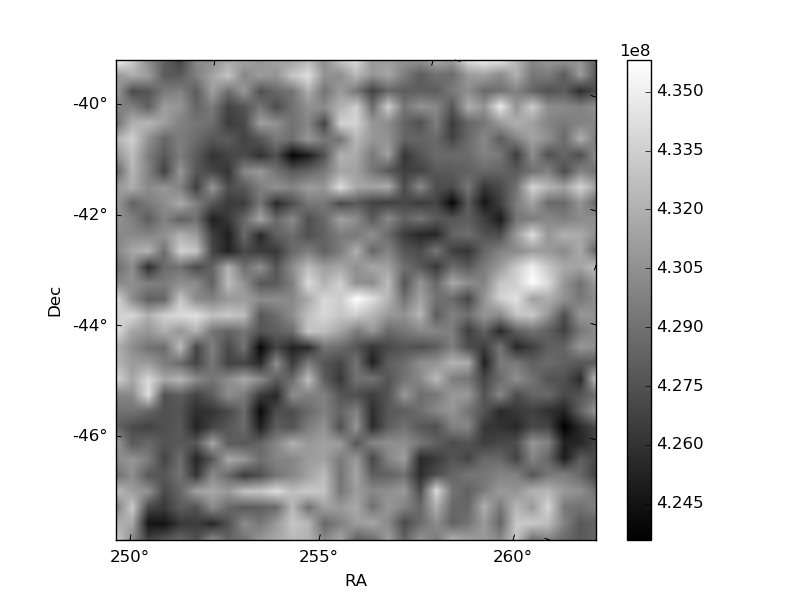
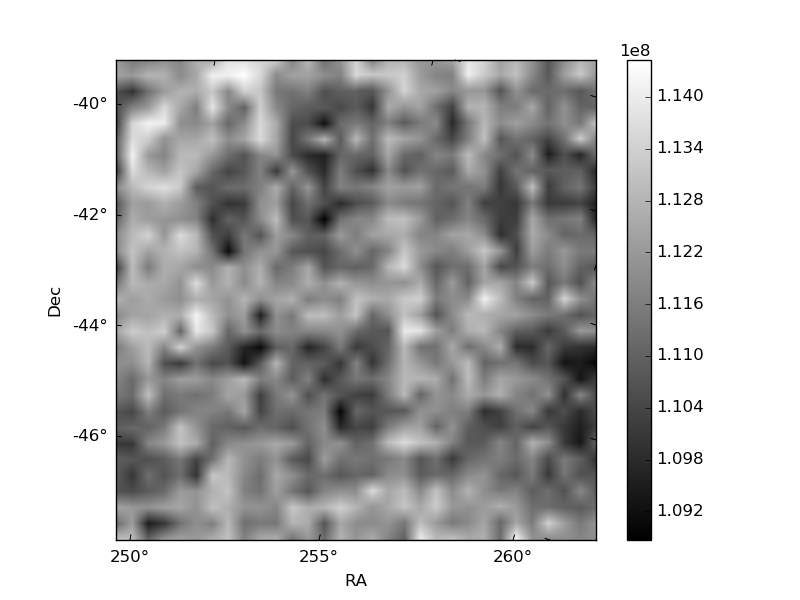
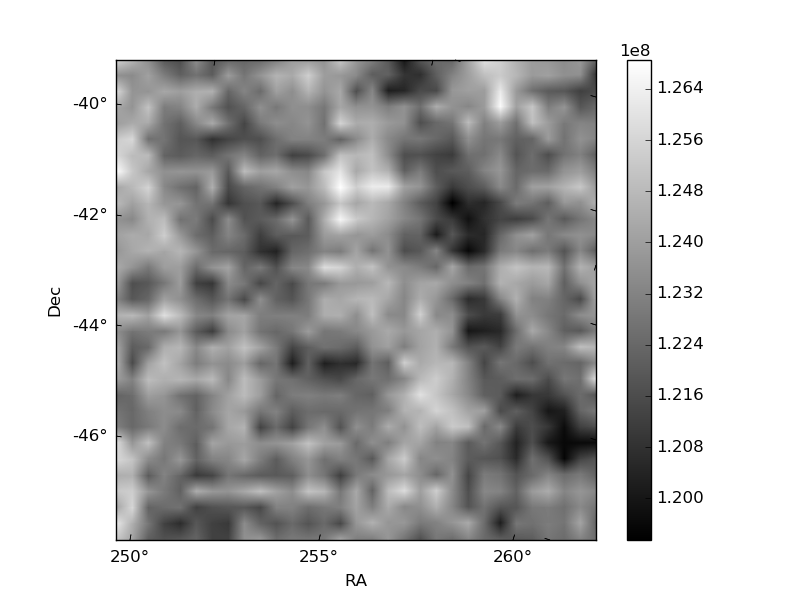
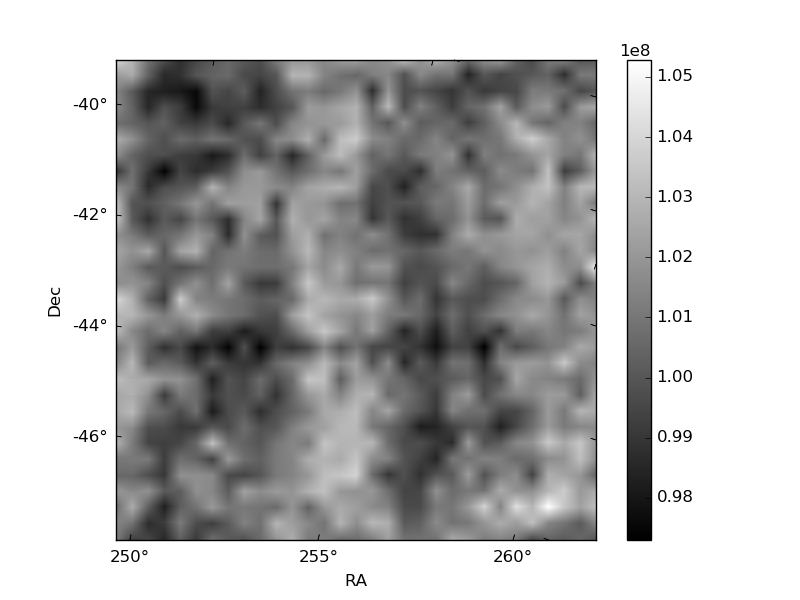
Histogram calculated using DETX and DETY for each event in the final _common_clean file
| Quadrant A | 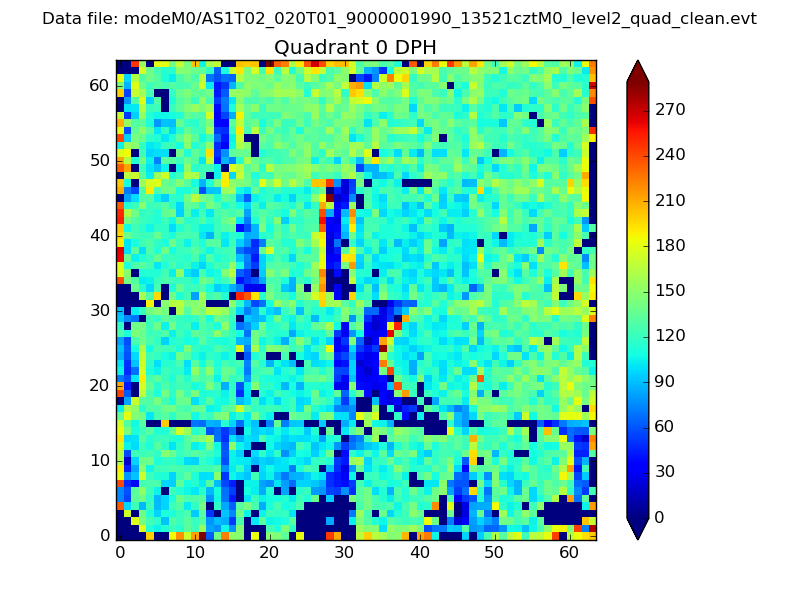 |
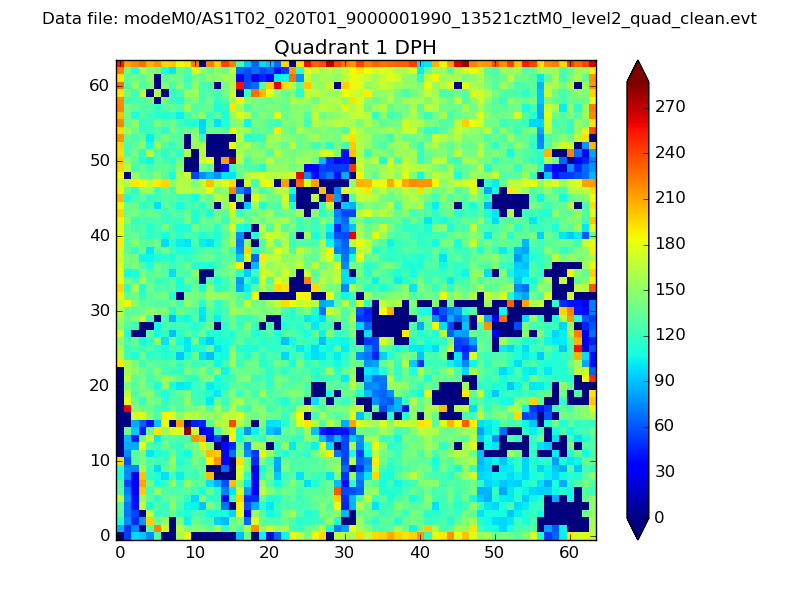 |
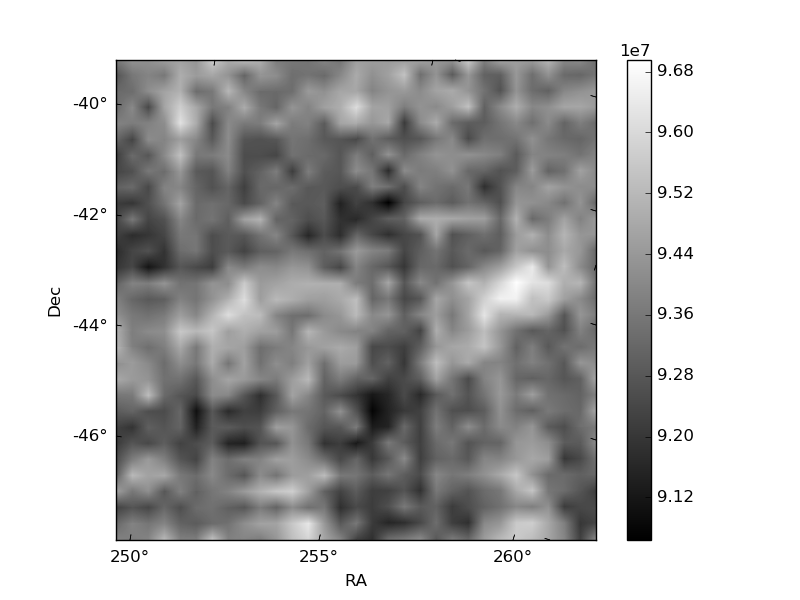
Quadrant B |
|---|---|---|---|
| Quadrant D | 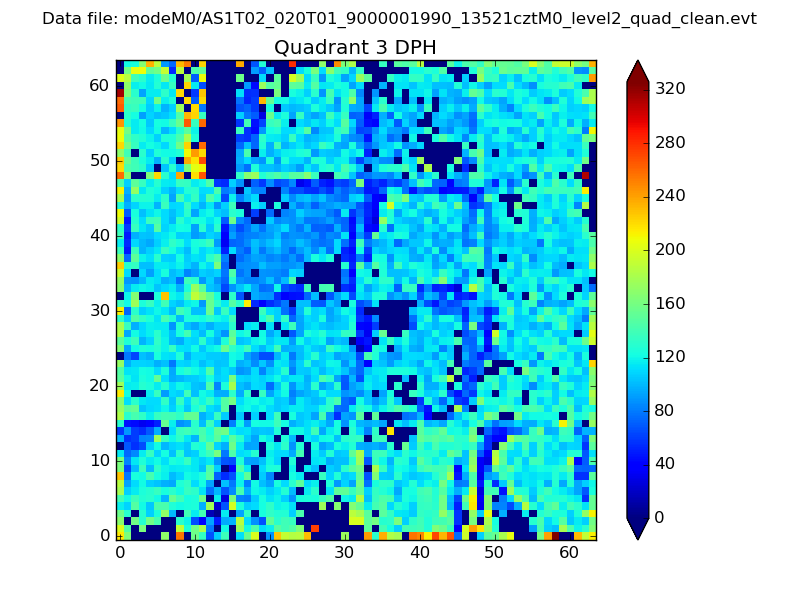 |
 |
Quadrant C |
| Plot type | Count rate plots | Images |
|---|---|---|
| Comparison with Poisson distribution Blue bars denote a histogram of data divided into 1 sec bins. Red curve is a Poisson curve with rate = median count rate of data. |
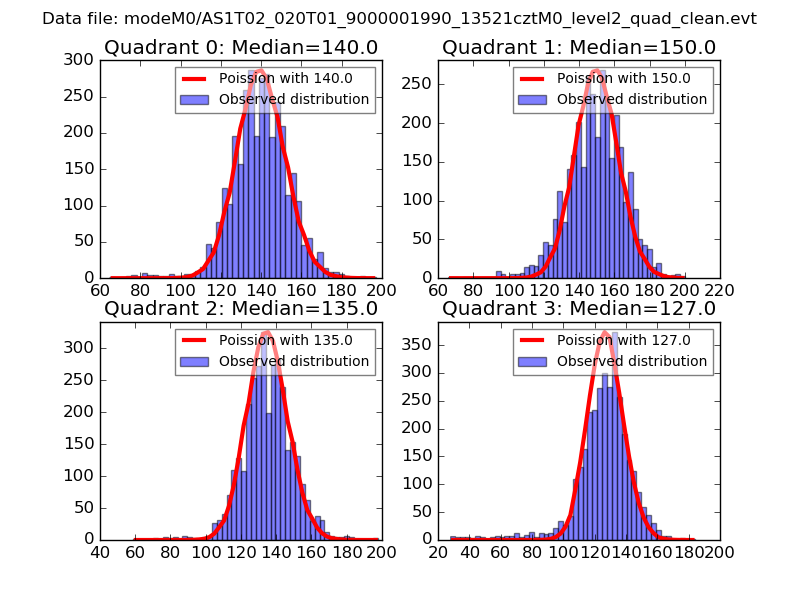 |
 |
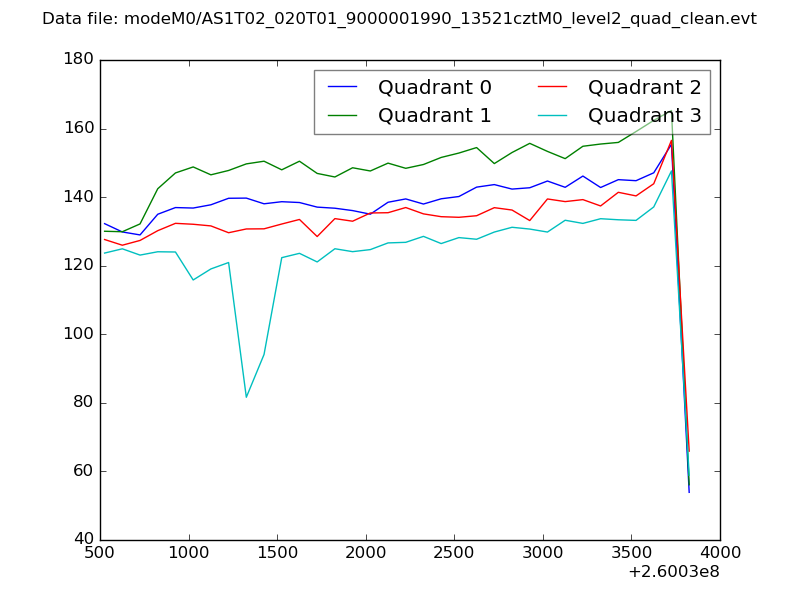
| Quadrant-wise count rates Data is divided into 100 sec bins |
 |
|
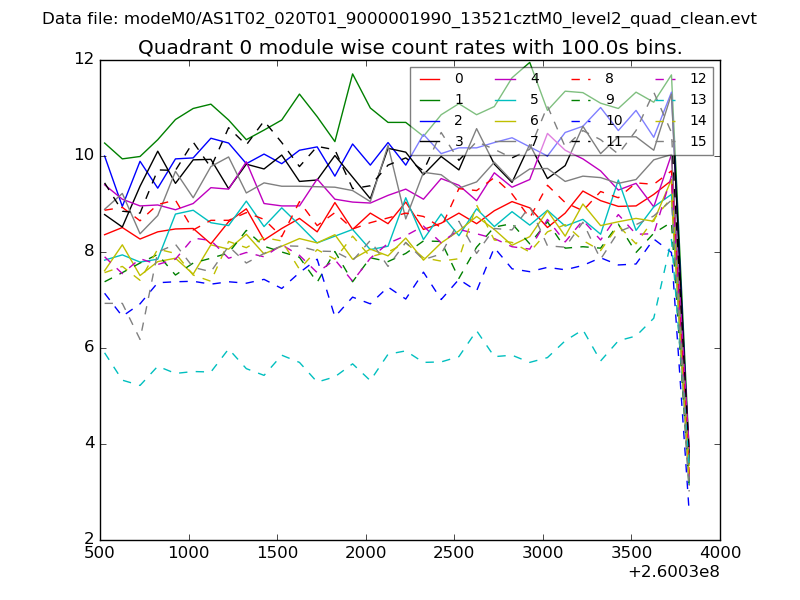
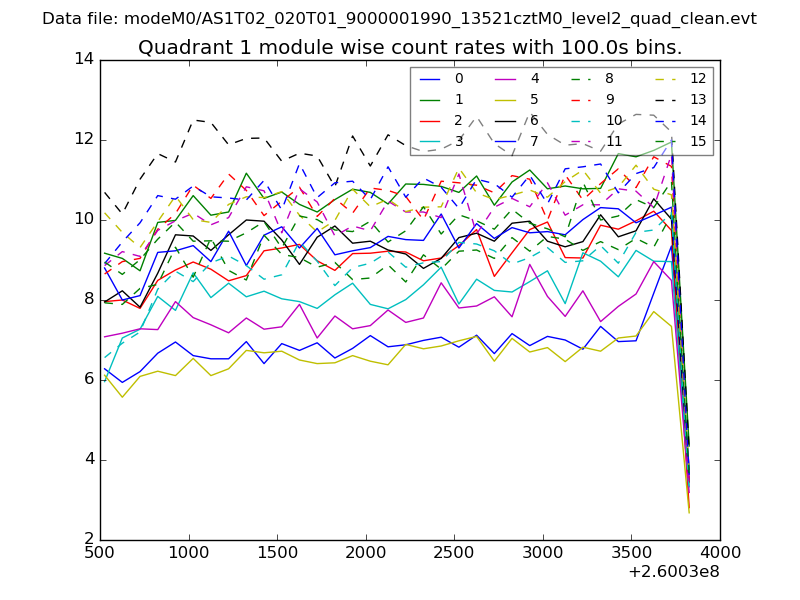
| Module-wise count rates for Quadrant A Data is divided into 100 sec bins |
 |
 |
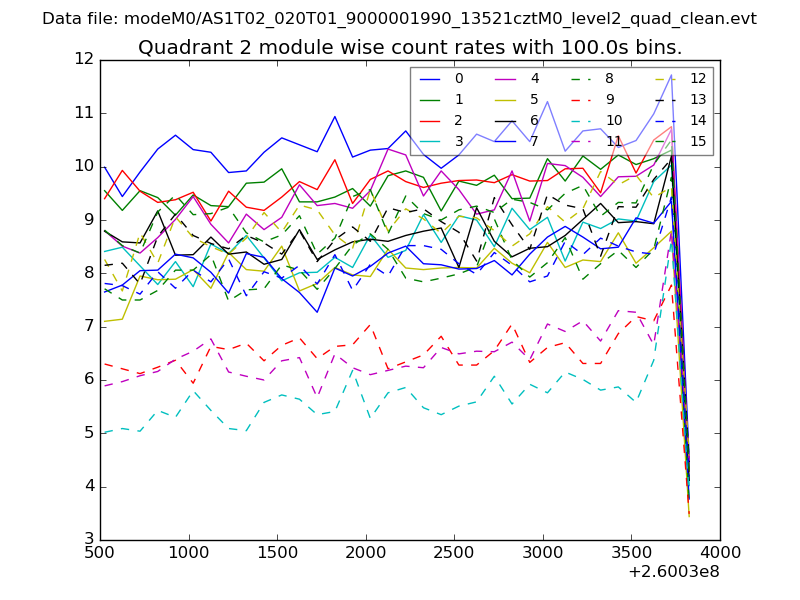
| Module-wise count rates for Quadrant B Data is divided into 100 sec bins |
 |
 |
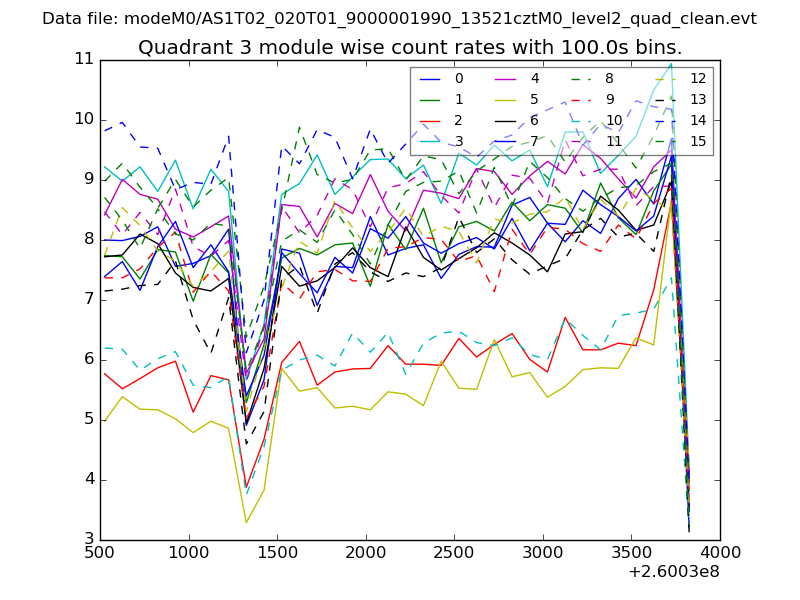
| Module-wise count rates for Quadrant C Data is divided into 100 sec bins |
 |
 |
| Module-wise count rates for Quadrant D Data is divided into 100 sec bins |
 |
 |
| Parameter | Plot |
|---|---|
| CZT HV Monitor | 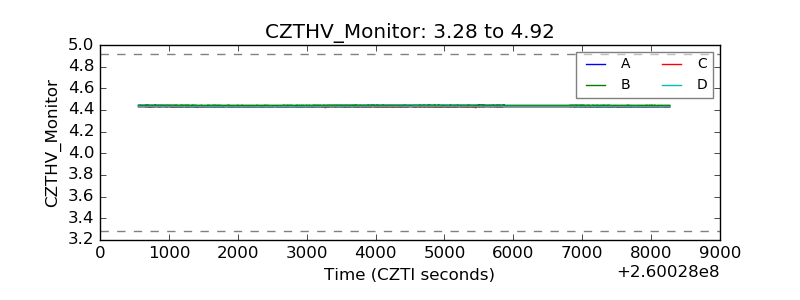 |
| D_VDD | 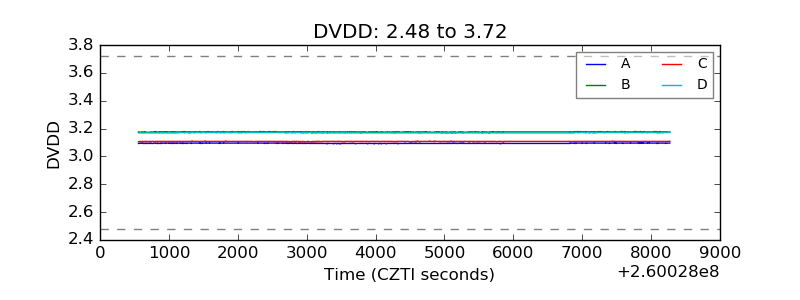 |
| Temperature 1 | 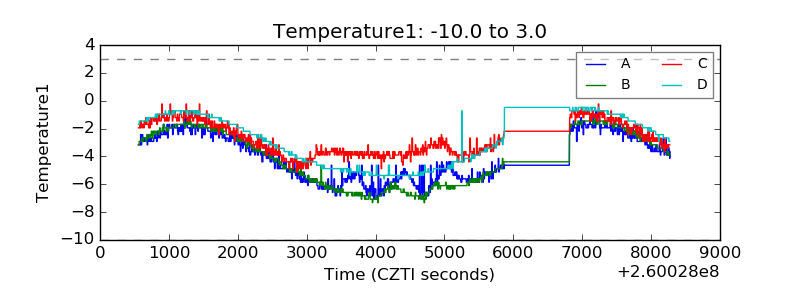 |
| Veto HV Monitor | 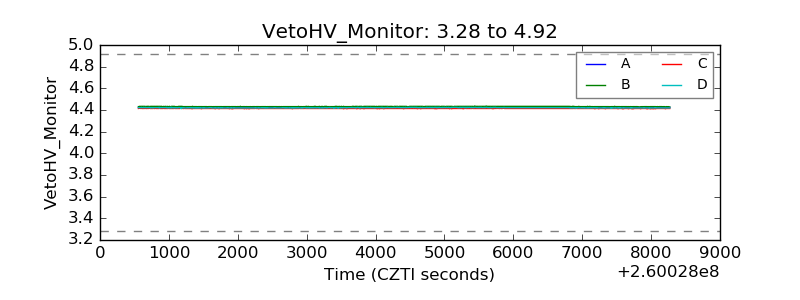 |
| Veto LLD | 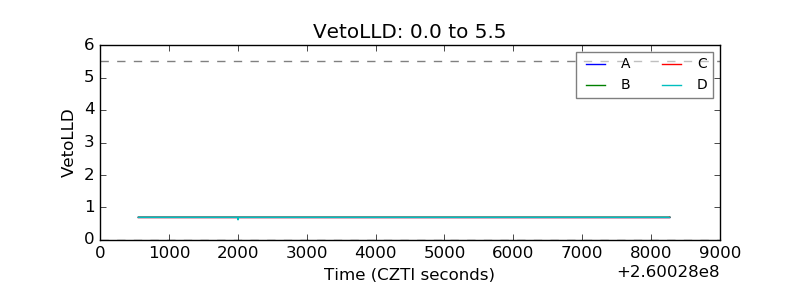 |
| Alpha Counter | 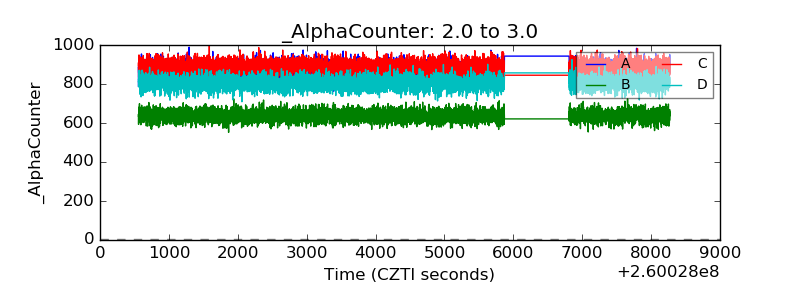 |
| _CPM_Rate | 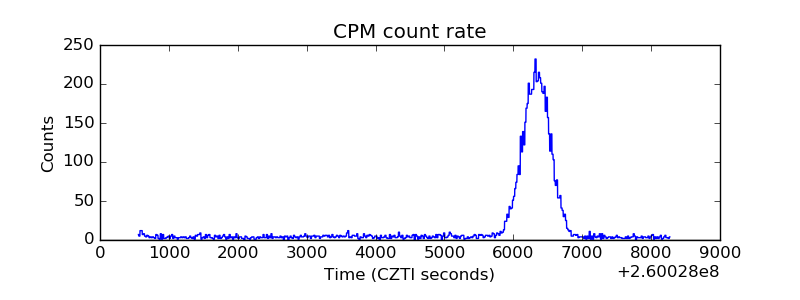 |
| CZT Counter |  |
| +2.5 Volts monitor |  |
| +5 Volts monitor |  |
| _ROLL_ROT | 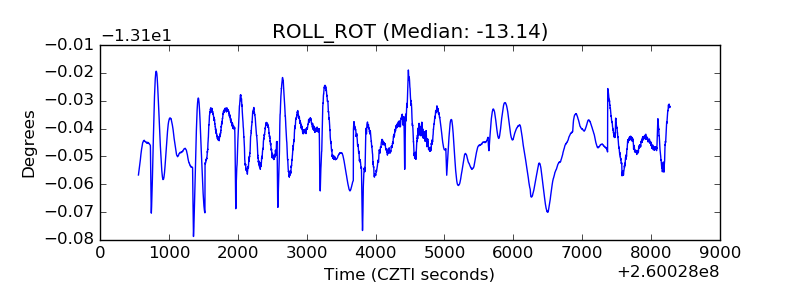 |
| _Roll_DEC | 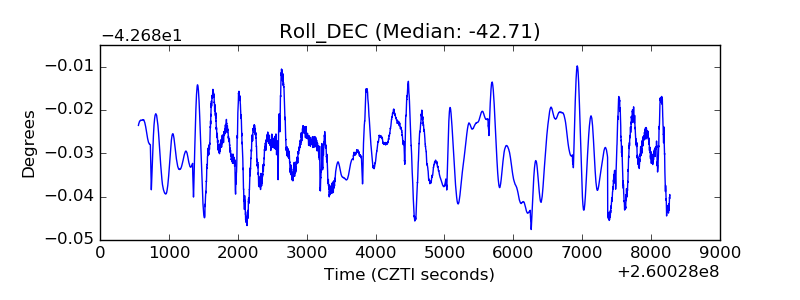 |
| _Roll_RA |  |
| Veto Counter | 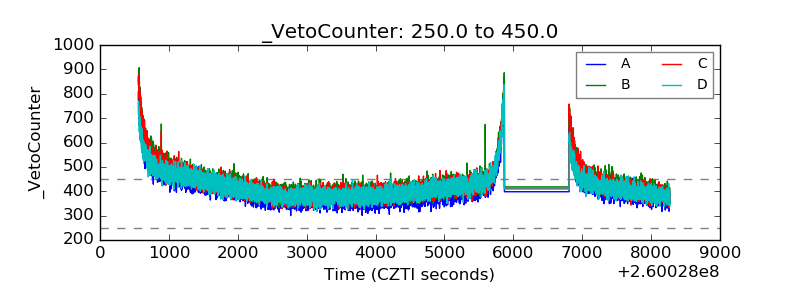 |