| Param | Original file | Final file |
|---|---|---|
| Filename | modeM0/AS1T02_020T01_9000001990_13522cztM0_level2.evt | modeM0/AS1T02_020T01_9000001990_13522cztM0_level2_quad_clean.evt |
| Size (bytes) | 277,113,600 | 54,599,040 |
| Size | 264.3 MB | 52.1 MB |
| Events in quadrant A | 1,868,350 | 343,896 |
| Events in quadrant B | 2,236,891 | 368,756 |
| Events in quadrant C | 2,024,249 | 332,123 |
| Events in quadrant D | 1,980,410 | 316,906 |
| Mode M0 | |||
|---|---|---|---|
| Quadrant | BADHDUFLAG | Total packets | Discarded packets |
| A | 0 | 8365 | 1 |
| B | 0 | 9301 | 1 |
| C | 0 | 8566 | 1 |
| D | 0 | 8838 | 1 |
| Mode SS | |||
|---|---|---|---|
| Quadrant | BADHDUFLAG | Total packets | Discarded packets |
| A | 0 | 82 | 0 |
| B | 0 | 82 | 0 |
| C | 0 | 82 | 0 |
| D | 0 | 82 | 0 |
| Quadrant | Total seconds | Saturated seconds | Saturation percentage |
|---|---|---|---|
| A | 4136 | 7 | 0.169246% |
| B | 4136 | 59 | 1.426499% |
| C | 4136 | 6 | 0.145068% |
| D | 4136 | 8 | 0.193424% |
Noise dominated data is calculated using 1-second bins in cleaned event files. If a bin has >2000 counts, and if more than 50% of those come from <1% of pixels, then it is considered to be noise-dominated and hence unusable.
| Quadrant | # 1 sec bins | Bins with >0 counts | Bins with >2000 counts | High rate bins dominated by noise | Noise dominated (total time) | Noise dominated (detector-on time) | Marked lightcurve |
|---|---|---|---|---|---|---|---|
| A | 4137 | 4137 | 0 | 0 | 0.00% | 0.00% | 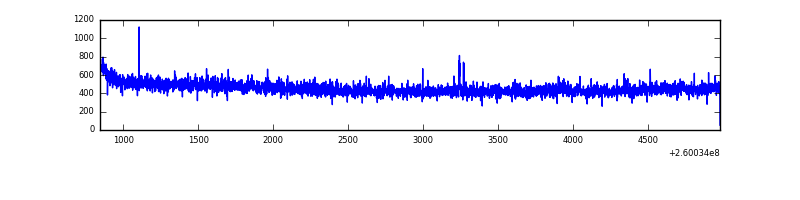 |
| B | 4137 | 4137 | 32 | 32 | 0.77% | 0.77% | 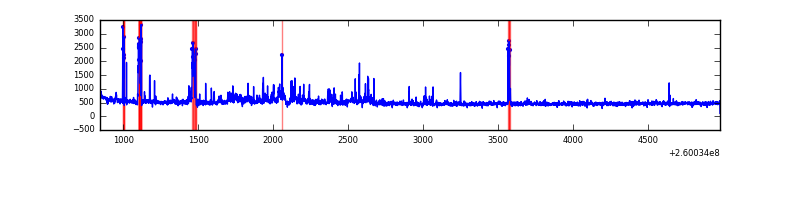 |
| C | 4137 | 4137 | 2 | 2 | 0.05% | 0.05% | 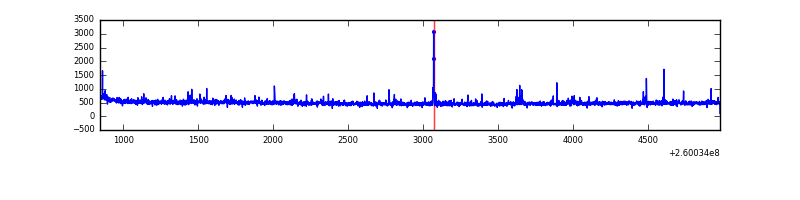 |
| D | 4137 | 4137 | 1 | 1 | 0.02% | 0.02% | 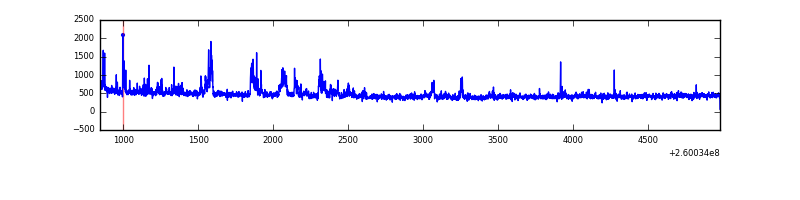 |
Top three noisy pixels from each quadrant. If the there are fewer than three noisy pixels in the level2.evt file, extra rows are filled as -1
| Pixel properties | Quadrant properties | ||||||
|---|---|---|---|---|---|---|---|
| Quadrant | DetID | PixID | Counts | Sigma | Mean | Median | Sigma |
| A | 1 | 162 | 8666 | 81.91 | 482 | 472 | 100.0 |
| A | 0 | 226 | 4221 | 37.48 | 482 | 472 | 100.0 |
| A | 12 | 194 | 3721 | 32.48 | 482 | 472 | 100.0 |
| B | 3 | 64 | 233787 | 2497.1 | 488 | 476 | 93.4 |
| B | 4 | 142 | 43852 | 464.25 | 488 | 476 | 93.4 |
| B | 0 | 189 | 17895 | 186.43 | 488 | 476 | 93.4 |
| C | 3 | 233 | 201142 | 1855.21 | 466 | 470 | 108.2 |
| C | 0 | 207 | 4663 | 38.76 | 466 | 470 | 108.2 |
| C | 13 | 61 | 3378 | 26.88 | 466 | 470 | 108.2 |
| D | 8 | 195 | 164838 | 1463.11 | 461 | 446 | 112.4 |
| D | 13 | 104 | 50102 | 441.94 | 461 | 446 | 112.4 |
| D | 2 | 234 | 15797 | 136.63 | 461 | 446 | 112.4 |
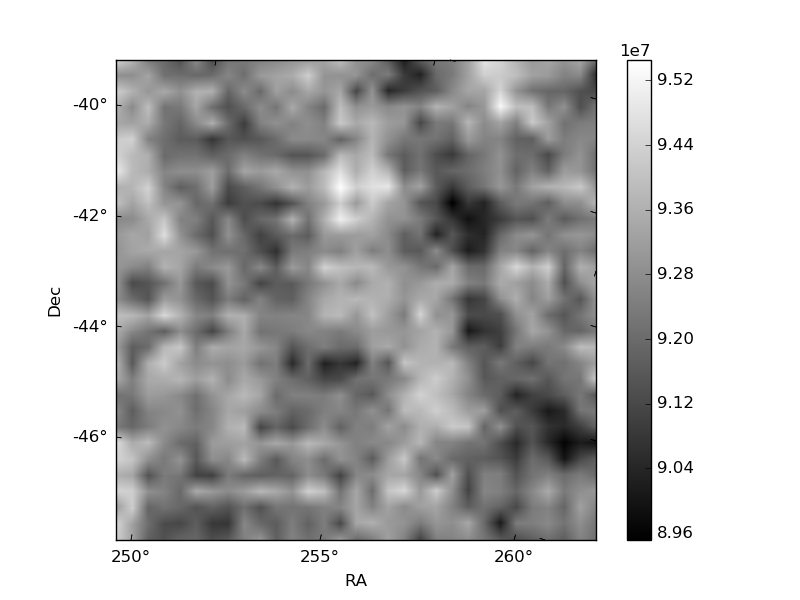
Histogram calculated using DETX and DETY for each event in the final _common_clean file
| Quadrant A | 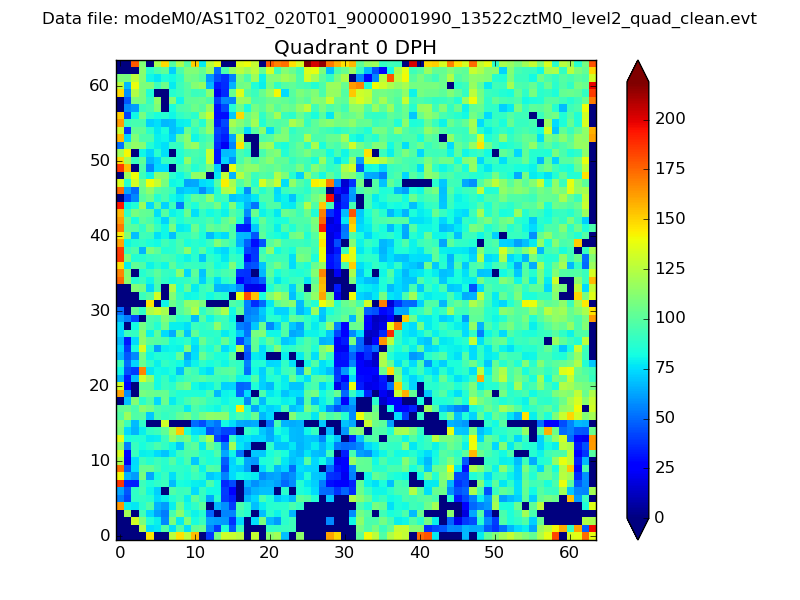 |
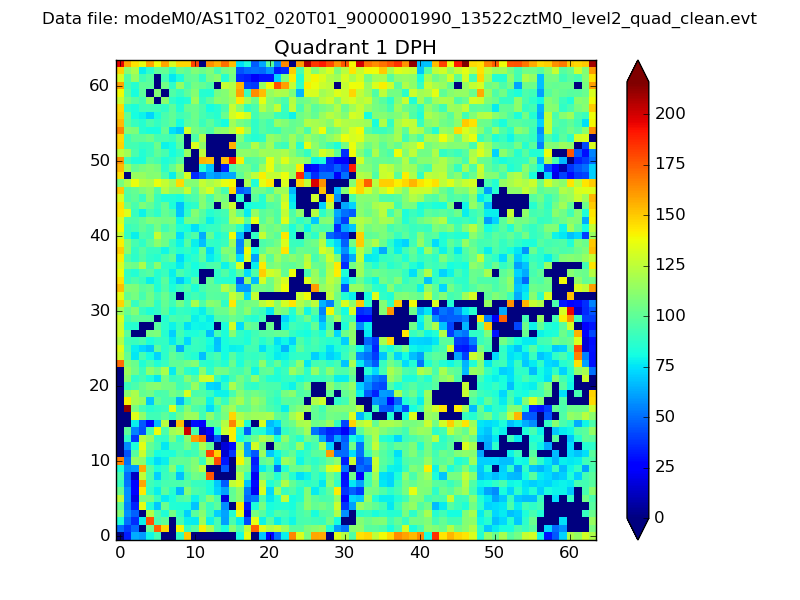 |
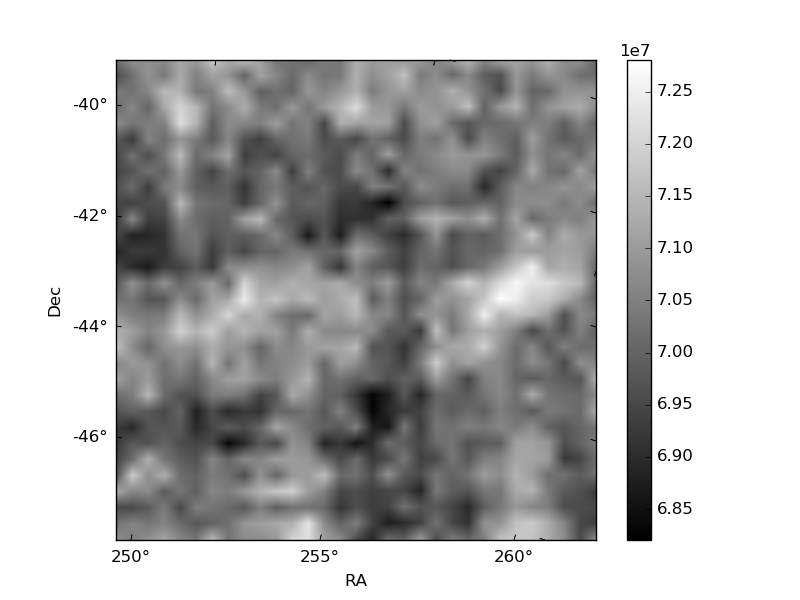
Quadrant B |
|---|---|---|---|
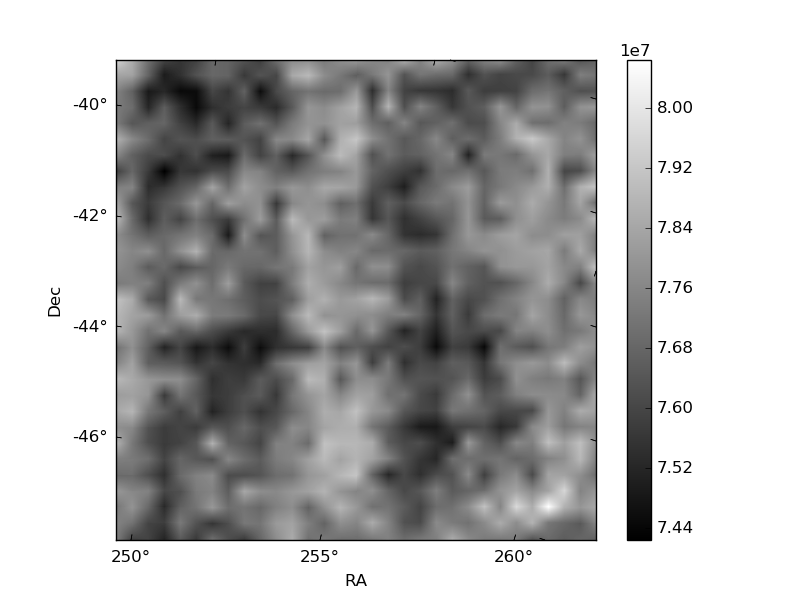
| Quadrant D | 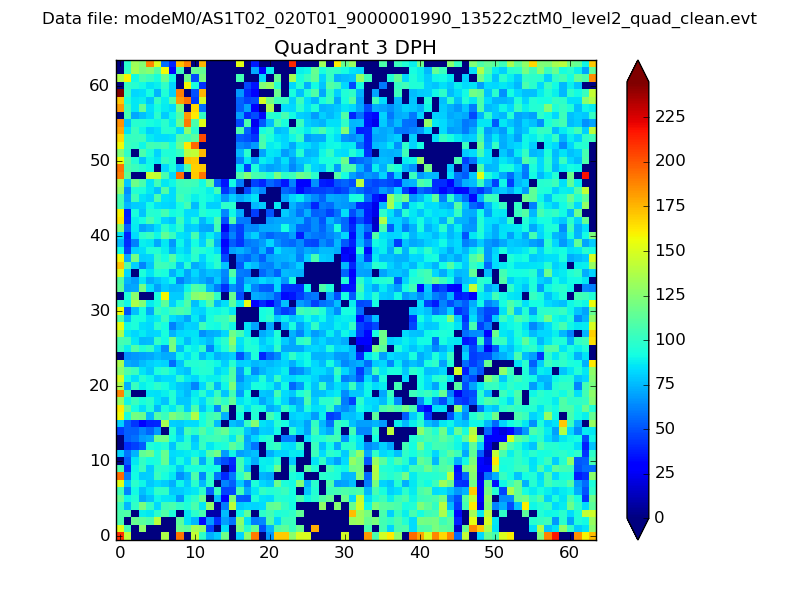 |
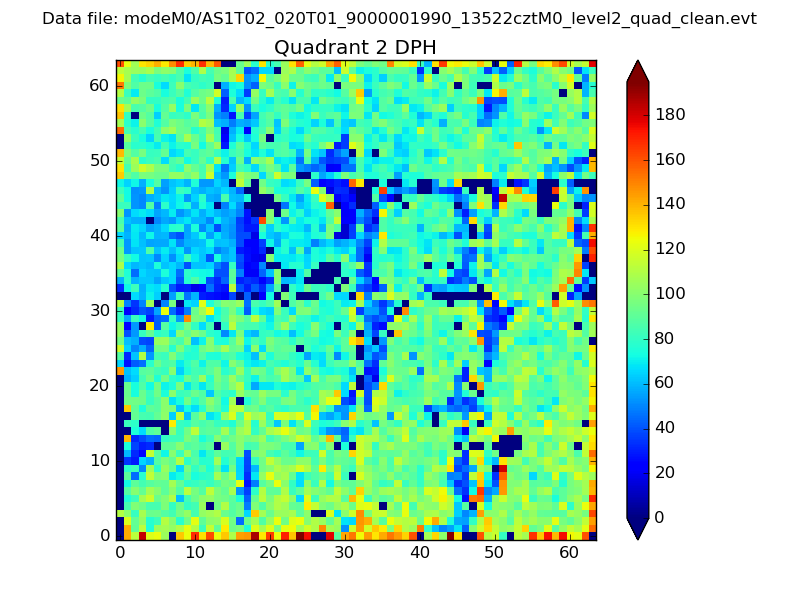 |
Quadrant C |
| Plot type | Count rate plots | Images |
|---|---|---|
| Comparison with Poisson distribution Blue bars denote a histogram of data divided into 1 sec bins. Red curve is a Poisson curve with rate = median count rate of data. |
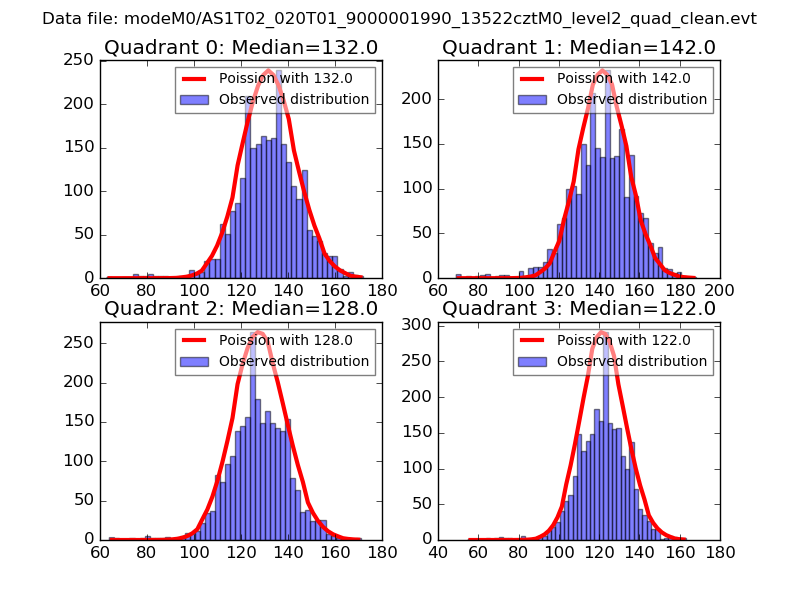 |
 |
| Quadrant-wise count rates Data is divided into 100 sec bins |
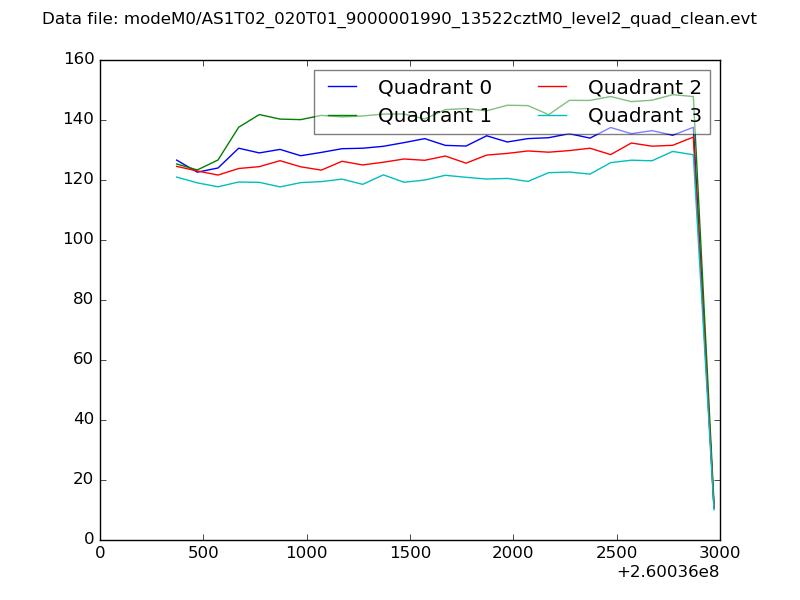 |
|
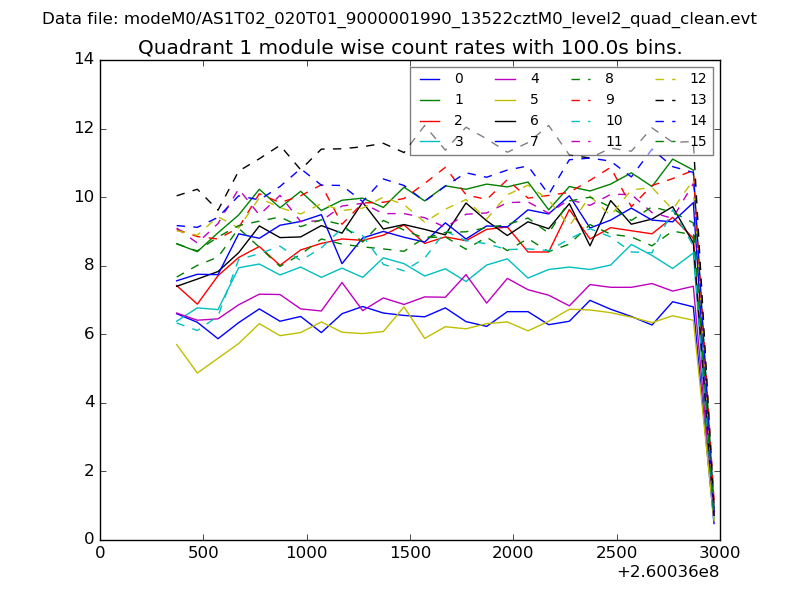
| Module-wise count rates for Quadrant A Data is divided into 100 sec bins |
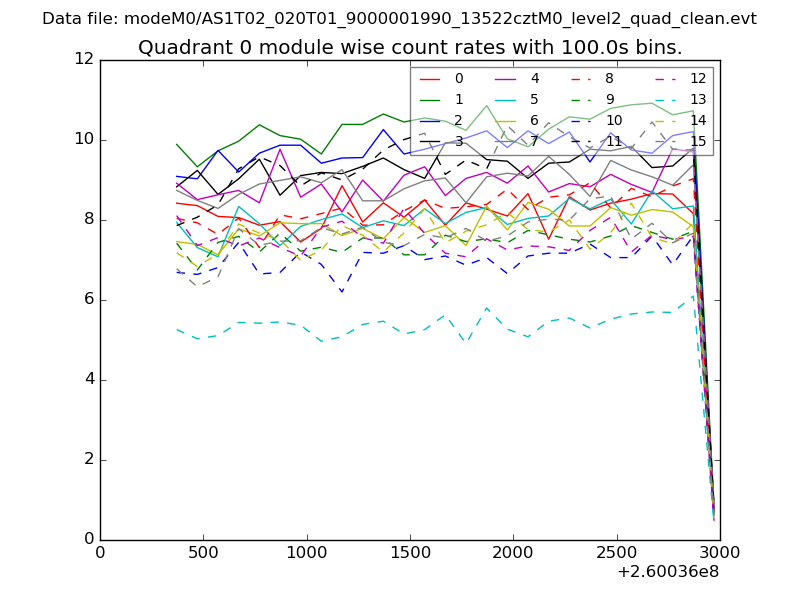 |
 |
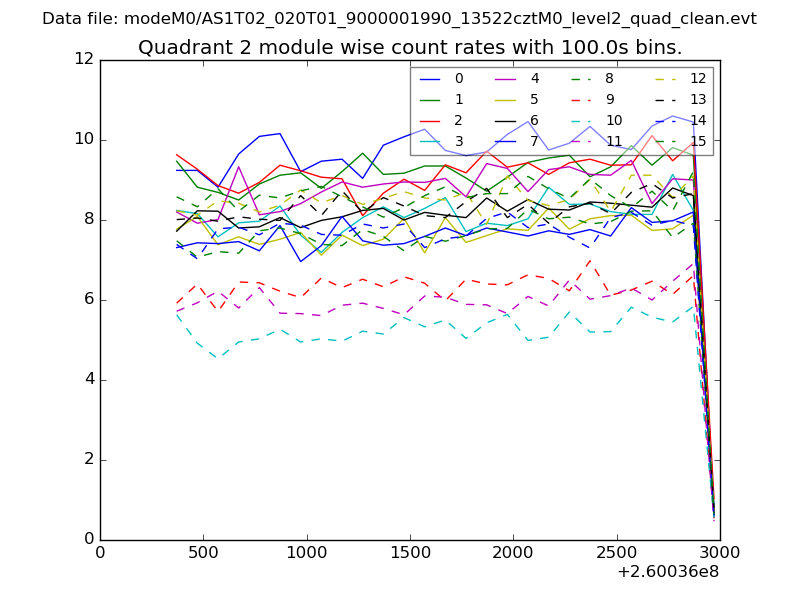
| Module-wise count rates for Quadrant B Data is divided into 100 sec bins |
 |
 |
| Module-wise count rates for Quadrant C Data is divided into 100 sec bins |
 |
 |
| Module-wise count rates for Quadrant D Data is divided into 100 sec bins |
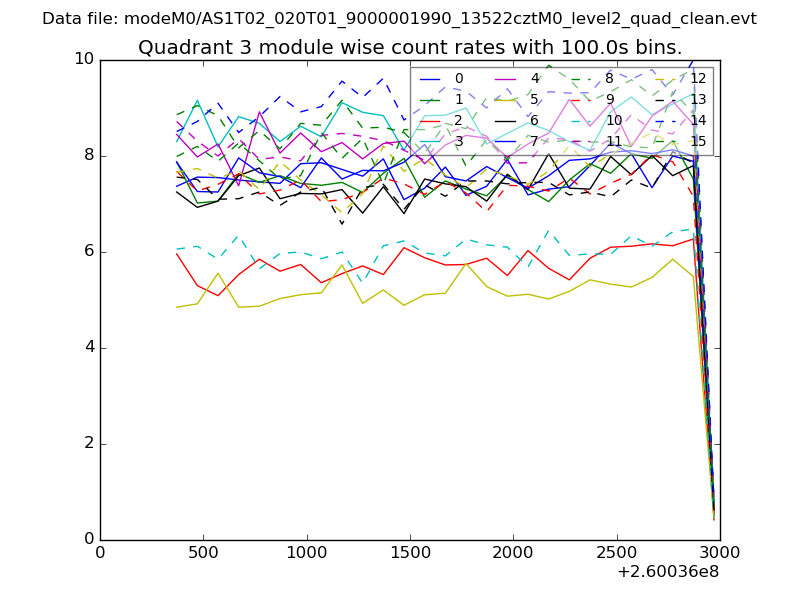 |
 |
| Parameter | Plot |
|---|---|
| CZT HV Monitor | 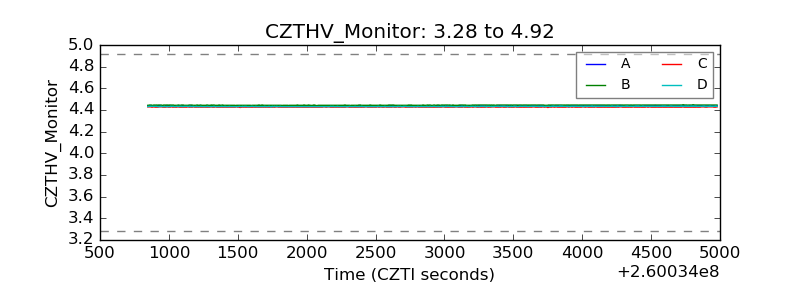 |
| D_VDD | 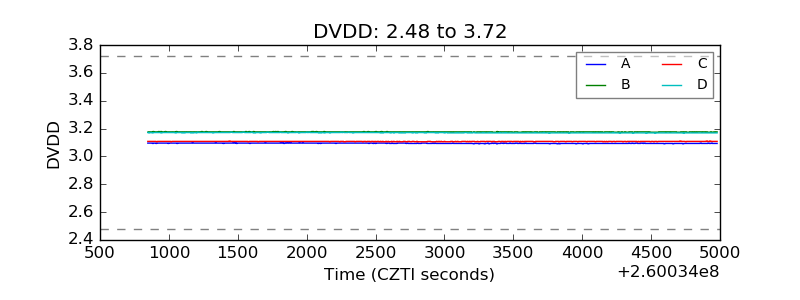 |
| Temperature 1 | 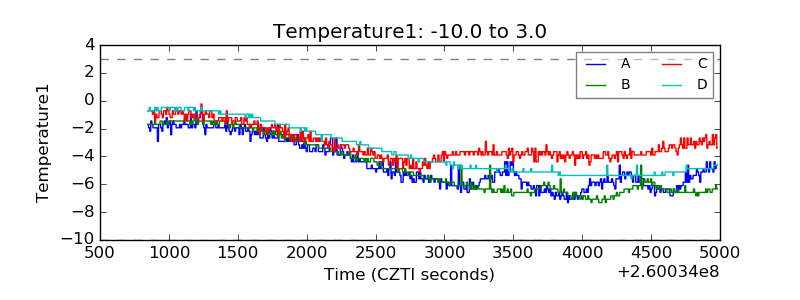 |
| Veto HV Monitor | 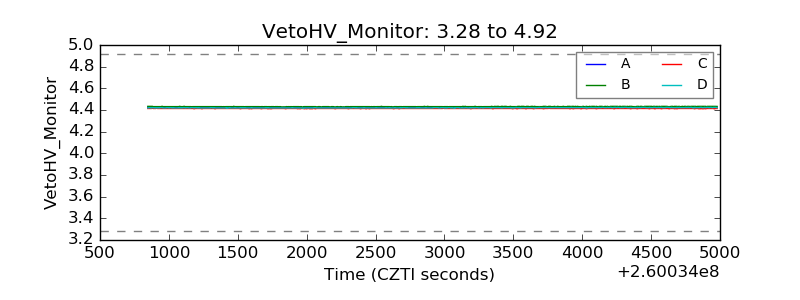 |
| Veto LLD | 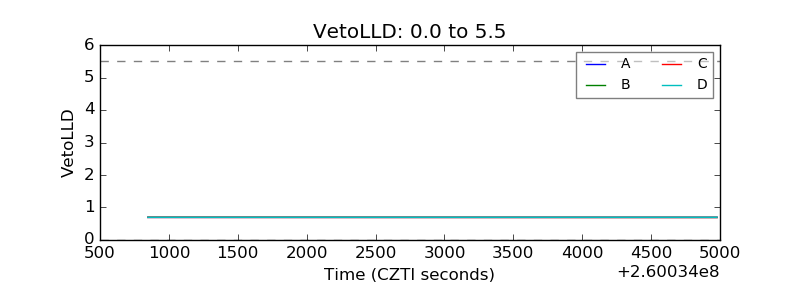 |
| Alpha Counter | 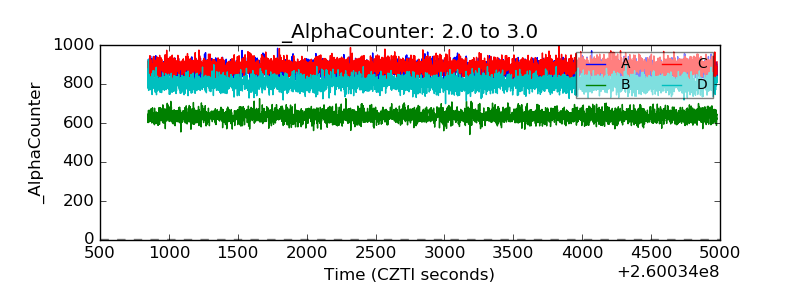 |
| _CPM_Rate | 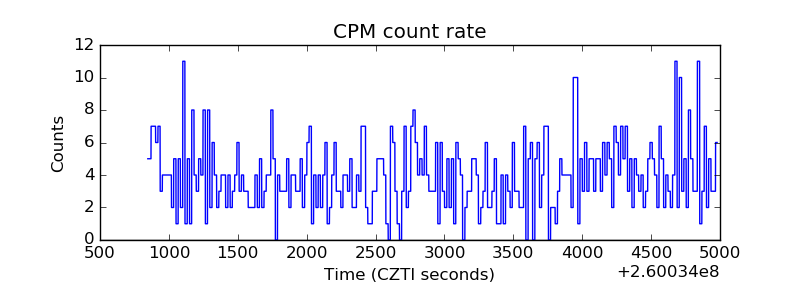 |
| CZT Counter | 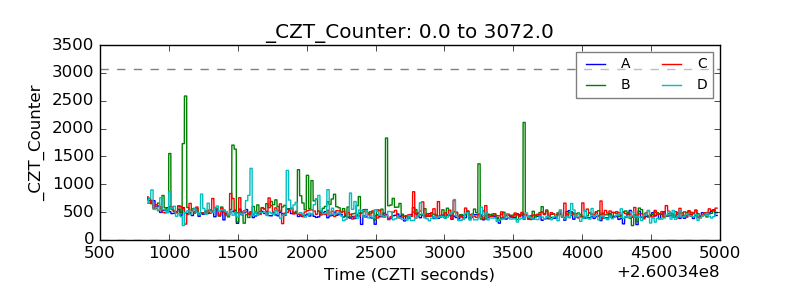 |
| +2.5 Volts monitor |  |
| +5 Volts monitor |  |
| _ROLL_ROT | 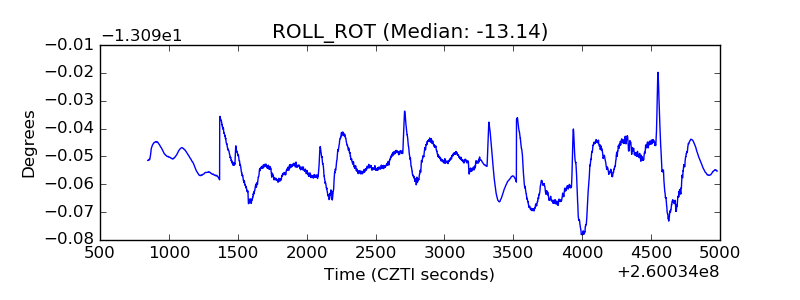 |
| _Roll_DEC | 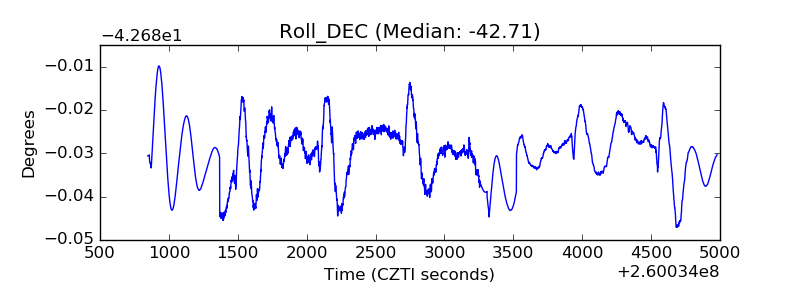 |
| _Roll_RA |  |
| Veto Counter | 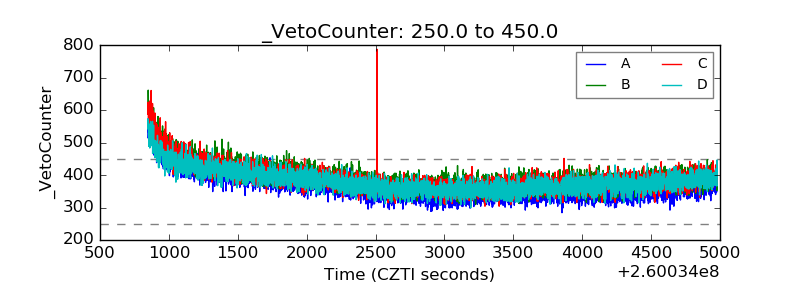 |