| Param | Original file | Final file |
|---|---|---|
| Filename | modeM0/AS1A04_048T01_9000001992_13522cztM0_level2.evt | modeM0/AS1A04_048T01_9000001992_13522cztM0_level2_quad_clean.evt |
| Size (bytes) | 196,637,760 | 27,947,520 |
| Size | 187.5 MB | 26.7 MB |
| Events in quadrant A | 1,291,100 | 166,049 |
| Events in quadrant B | 1,353,273 | 168,600 |
| Events in quadrant C | 1,598,527 | 165,879 |
| Events in quadrant D | 1,534,708 | 159,958 |
| Mode M0 | |||
|---|---|---|---|
| Quadrant | BADHDUFLAG | Total packets | Discarded packets |
| A | 0 | 5472 | 2 |
| B | 0 | 5620 | 1 |
| C | 0 | 6375 | 1 |
| D | 0 | 6256 | 1 |
| Mode M9 | |||
|---|---|---|---|
| Quadrant | BADHDUFLAG | Total packets | Discarded packets |
| A | 0 | 6 | 0 |
| B | 0 | 6 | 0 |
| C | 0 | 6 | 0 |
| D | 0 | 6 | 0 |
| Mode SS | |||
|---|---|---|---|
| Quadrant | BADHDUFLAG | Total packets | Discarded packets |
| A | 0 | 54 | 0 |
| B | 0 | 54 | 0 |
| C | 0 | 54 | 0 |
| D | 0 | 54 | 0 |
| Quadrant | Total seconds | Saturated seconds | Saturation percentage |
|---|---|---|---|
| A | 2583 | 33 | 1.277584% |
| B | 2583 | 56 | 2.168022% |
| C | 2583 | 48 | 1.858304% |
| D | 2583 | 46 | 1.780875% |
Noise dominated data is calculated using 1-second bins in cleaned event files. If a bin has >2000 counts, and if more than 50% of those come from <1% of pixels, then it is considered to be noise-dominated and hence unusable.
| Quadrant | # 1 sec bins | Bins with >0 counts | Bins with >2000 counts | High rate bins dominated by noise | Noise dominated (total time) | Noise dominated (detector-on time) | Marked lightcurve |
|---|---|---|---|---|---|---|---|
| A | 3154 | 2585 | 0 | 0 | 0.00% | 0.00% | 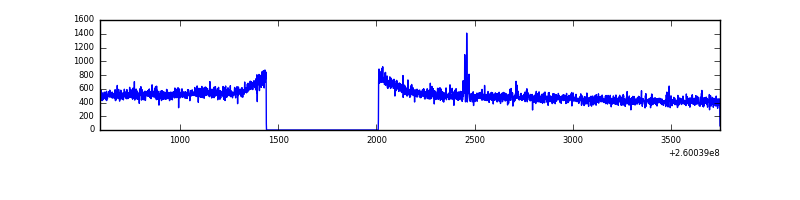 |
| B | 3154 | 2585 | 3 | 3 | 0.10% | 0.12% | 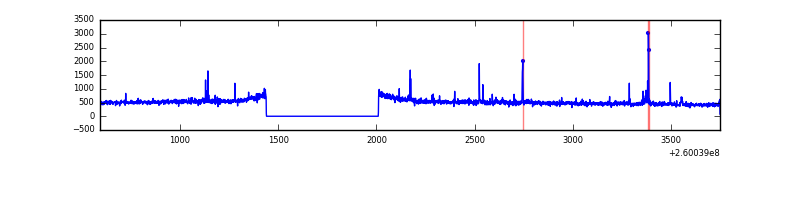 |
| C | 3154 | 2585 | 17 | 17 | 0.54% | 0.66% | 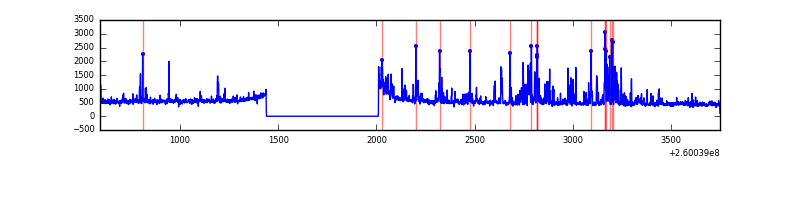 |
| D | 3154 | 2585 | 29 | 29 | 0.92% | 1.12% | 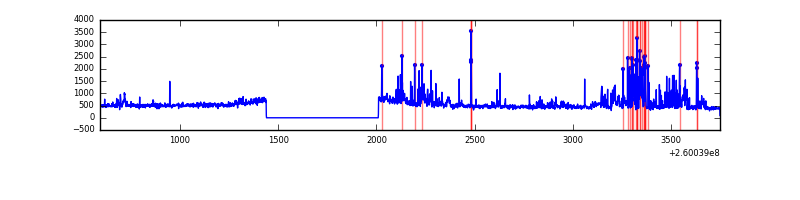 |
Top three noisy pixels from each quadrant. If the there are fewer than three noisy pixels in the level2.evt file, extra rows are filled as -1
| Pixel properties | Quadrant properties | ||||||
|---|---|---|---|---|---|---|---|
| Quadrant | DetID | PixID | Counts | Sigma | Mean | Median | Sigma |
| A | 1 | 162 | 9323 | 130.95 | 331 | 324 | 68.7 |
| A | 1 | 178 | 3370 | 44.32 | 331 | 324 | 68.7 |
| A | 1 | 161 | 3114 | 40.6 | 331 | 324 | 68.7 |
| B | 4 | 142 | 21047 | 319.55 | 330 | 324 | 64.9 |
| B | 0 | 189 | 17871 | 270.57 | 330 | 324 | 64.9 |
| B | 4 | 173 | 11963 | 179.47 | 330 | 324 | 64.9 |
| C | 3 | 233 | 356641 | 4781.71 | 317 | 317 | 74.5 |
| C | 0 | 207 | 3605 | 44.12 | 317 | 317 | 74.5 |
| C | 13 | 61 | 2348 | 27.26 | 317 | 317 | 74.5 |
| D | 13 | 104 | 195522 | 2523.94 | 316 | 305 | 77.3 |
| D | 13 | 122 | 51756 | 665.2 | 316 | 305 | 77.3 |
| D | 13 | 172 | 49494 | 635.96 | 316 | 305 | 77.3 |
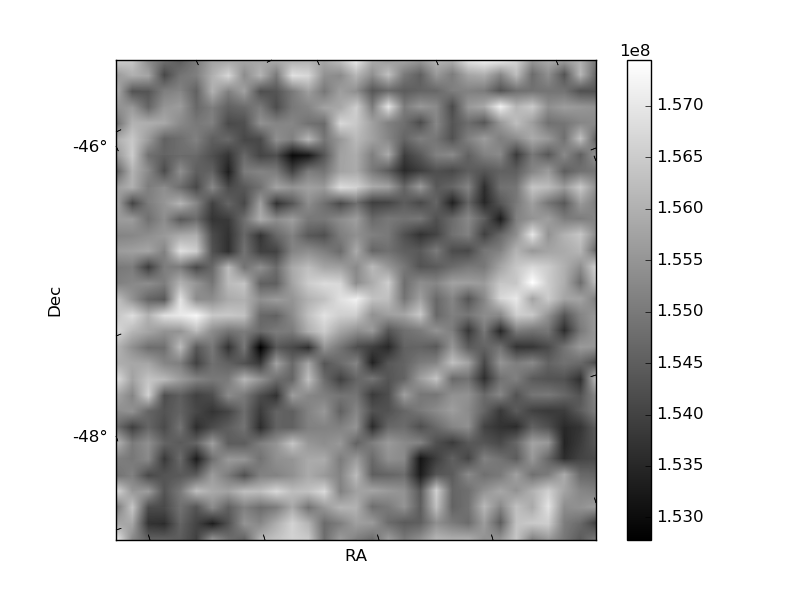
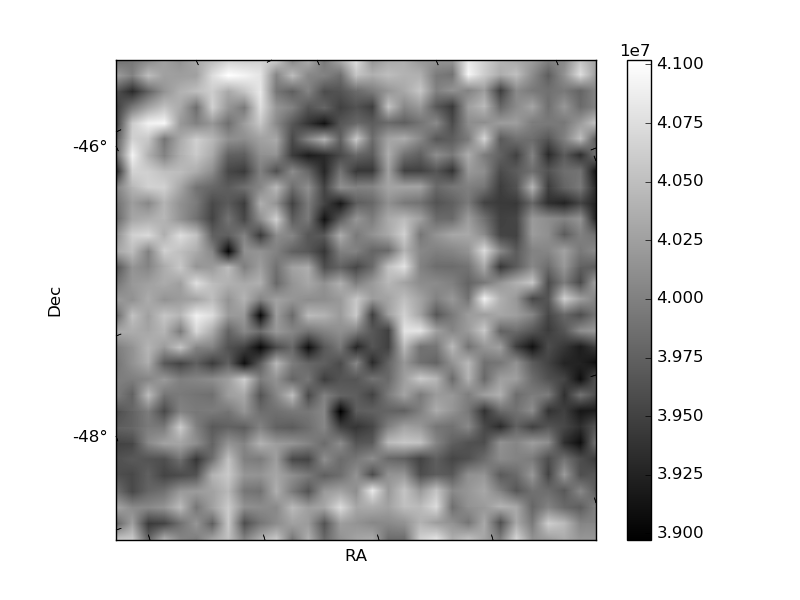
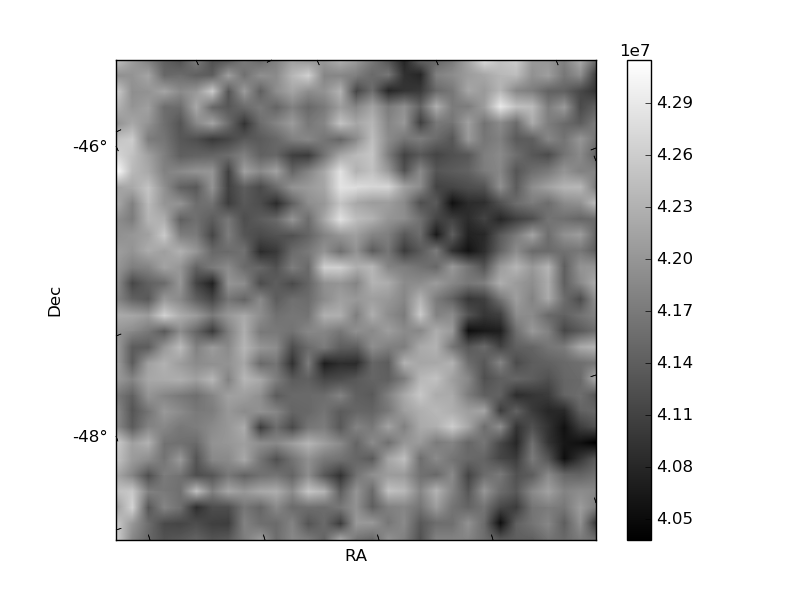
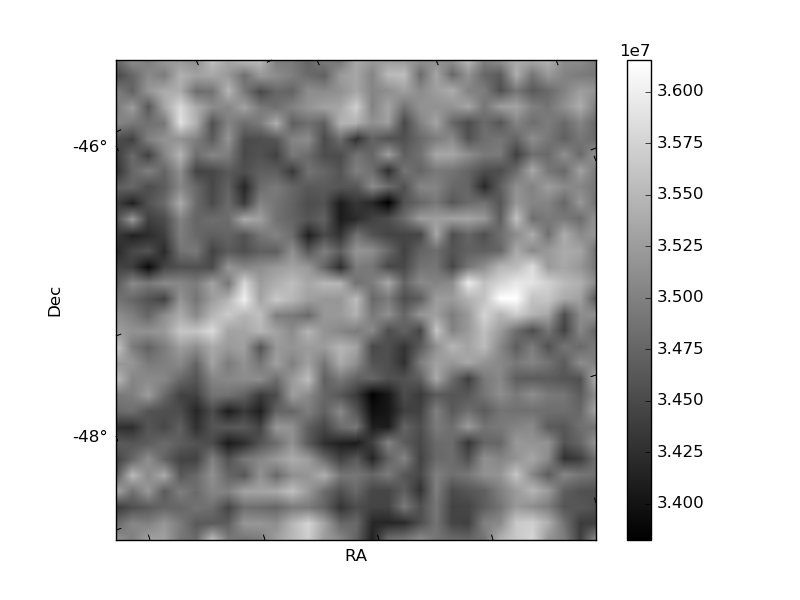
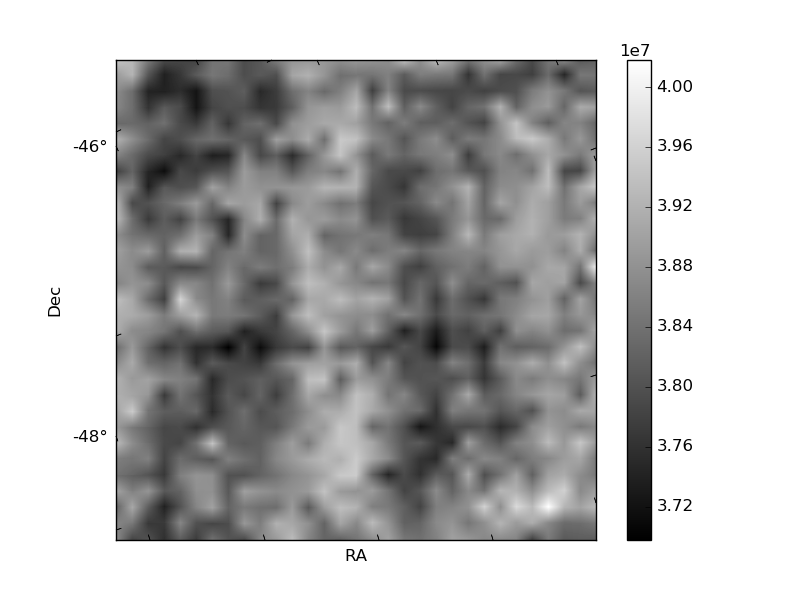
Histogram calculated using DETX and DETY for each event in the final _common_clean file
| Quadrant A | 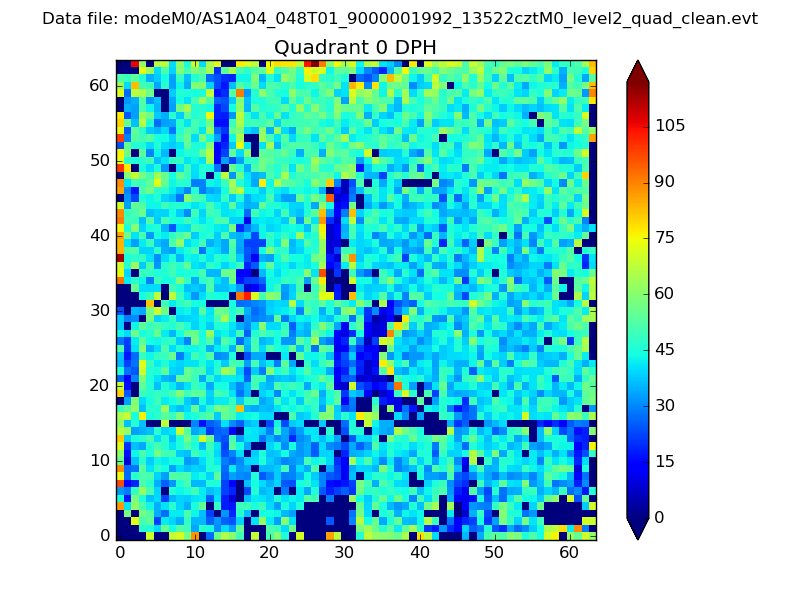 |
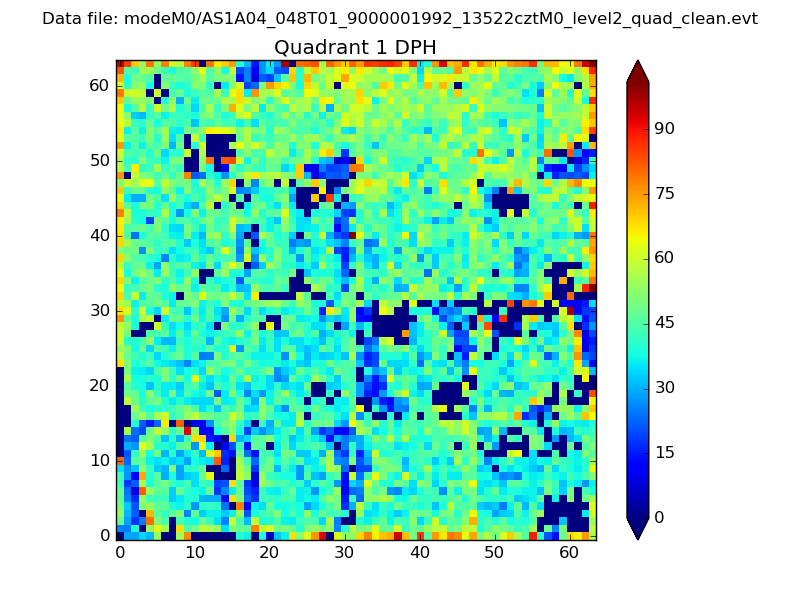 |
Quadrant B |
|---|---|---|---|
| Quadrant D | 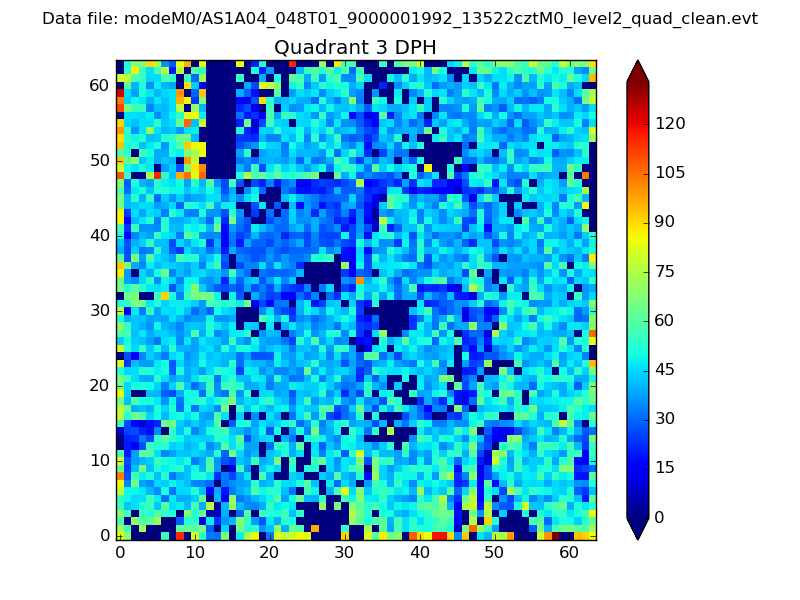 |
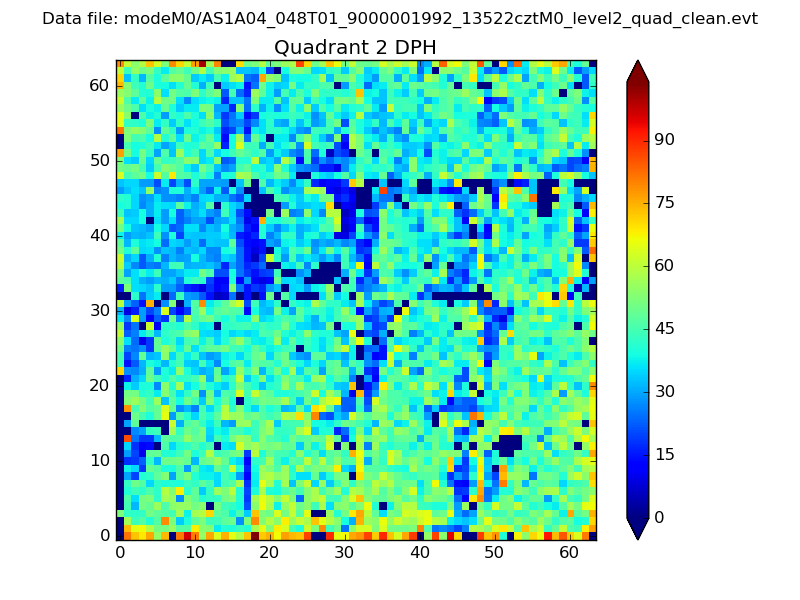 |
Quadrant C |
| Plot type | Count rate plots | Images |
|---|---|---|
| Comparison with Poisson distribution Blue bars denote a histogram of data divided into 1 sec bins. Red curve is a Poisson curve with rate = median count rate of data. |
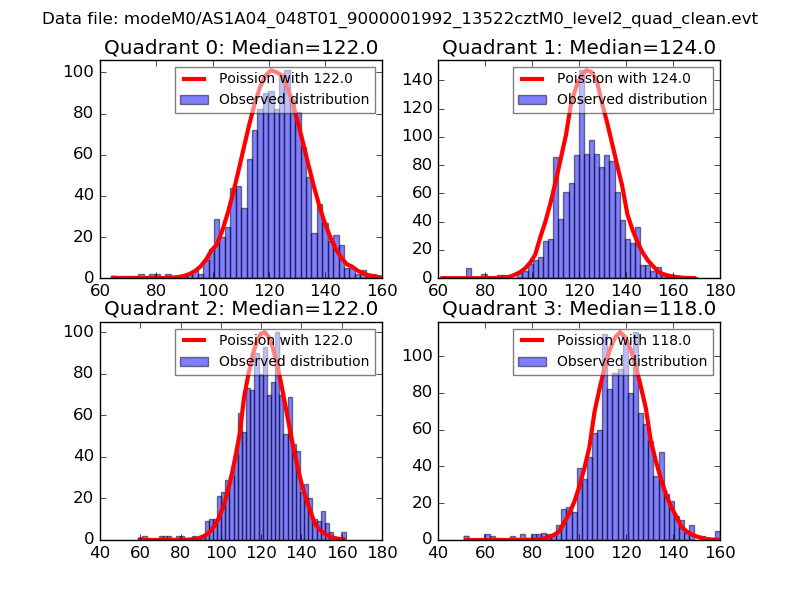 |
 |
| Quadrant-wise count rates Data is divided into 100 sec bins |
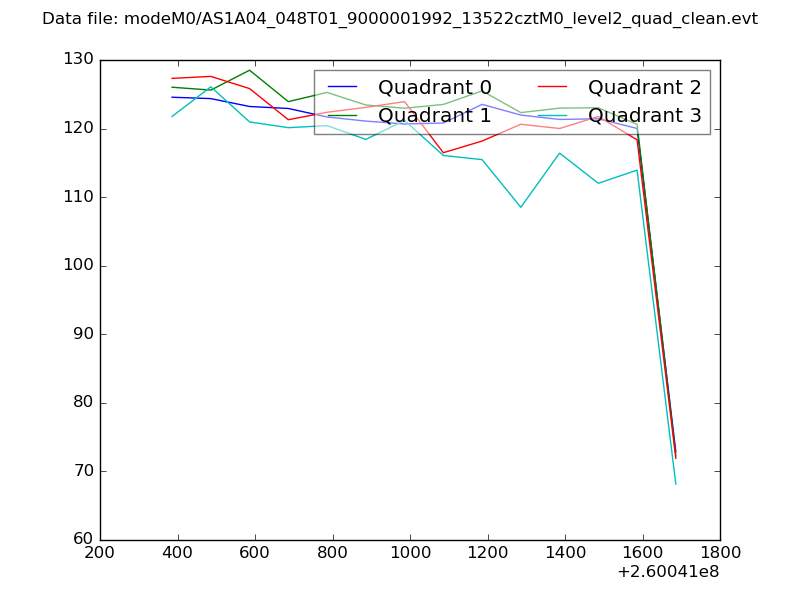 |
|
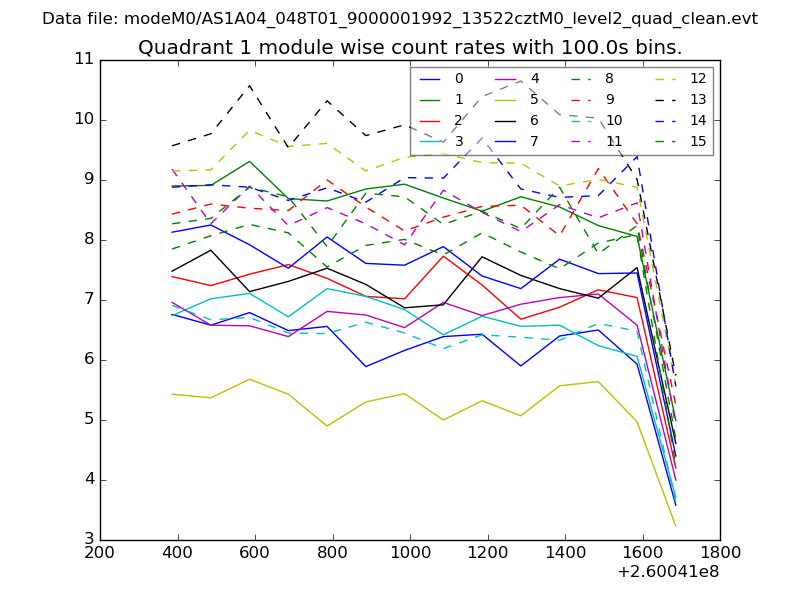
| Module-wise count rates for Quadrant A Data is divided into 100 sec bins |
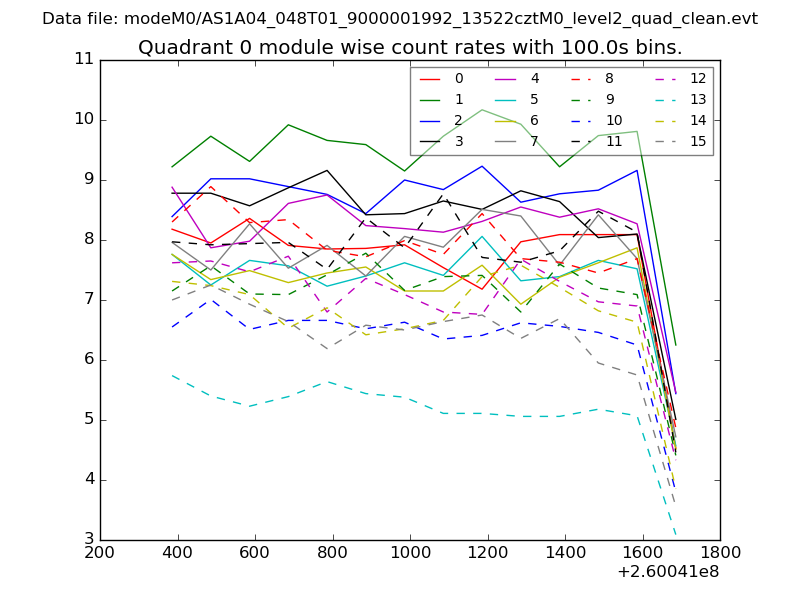 |
 |
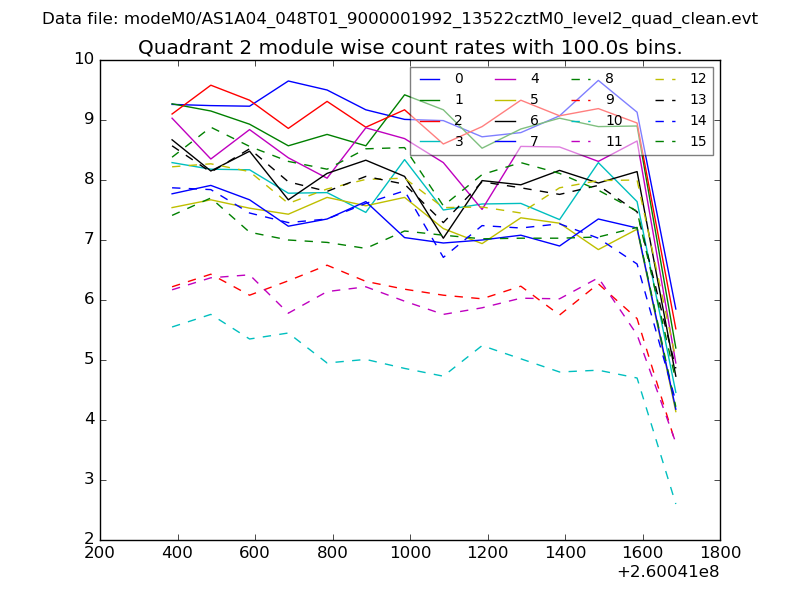
| Module-wise count rates for Quadrant B Data is divided into 100 sec bins |
 |
 |
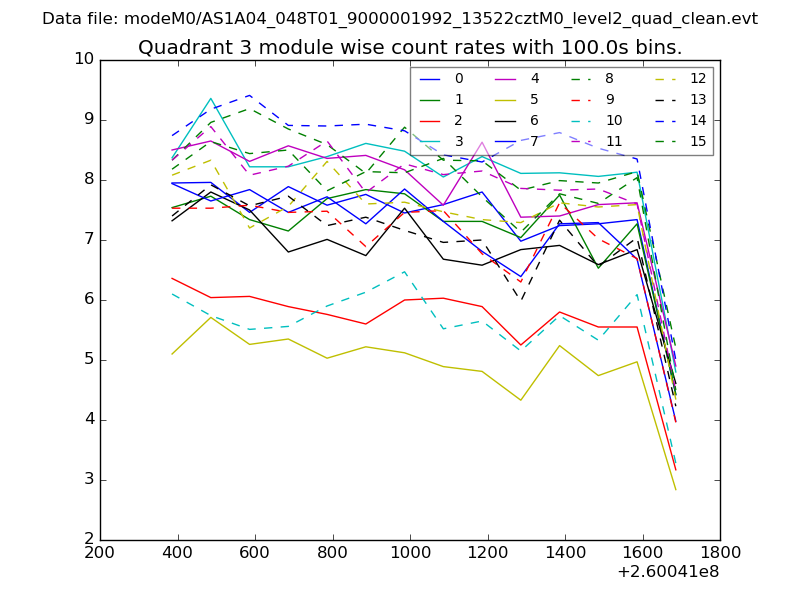
| Module-wise count rates for Quadrant C Data is divided into 100 sec bins |
 |
 |
| Module-wise count rates for Quadrant D Data is divided into 100 sec bins |
 |
 |
| Parameter | Plot |
|---|---|
| CZT HV Monitor | 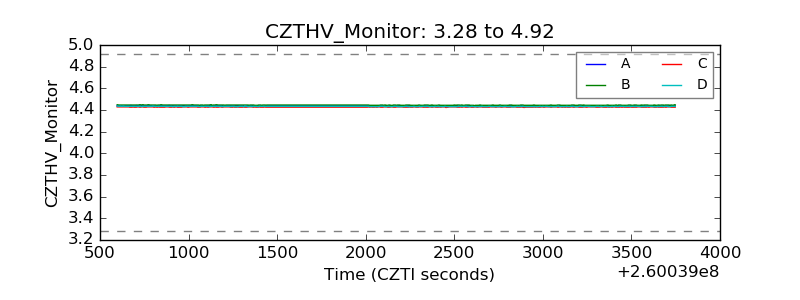 |
| D_VDD | 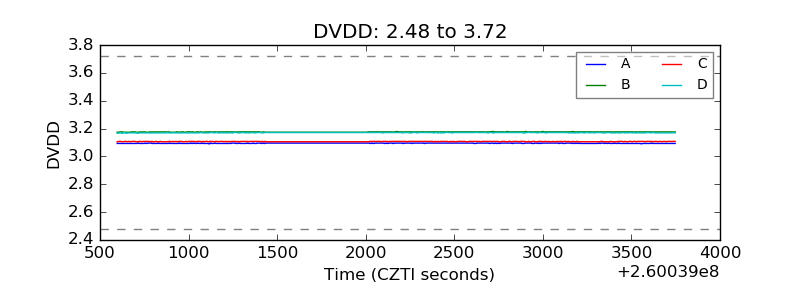 |
| Temperature 1 | 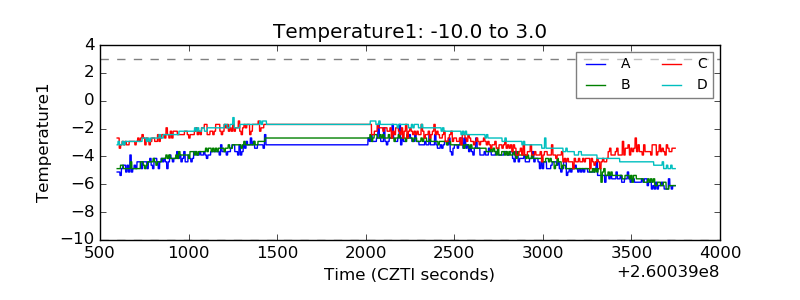 |
| Veto HV Monitor | 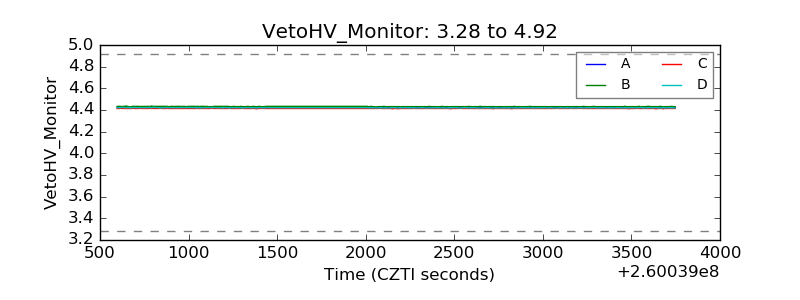 |
| Veto LLD | 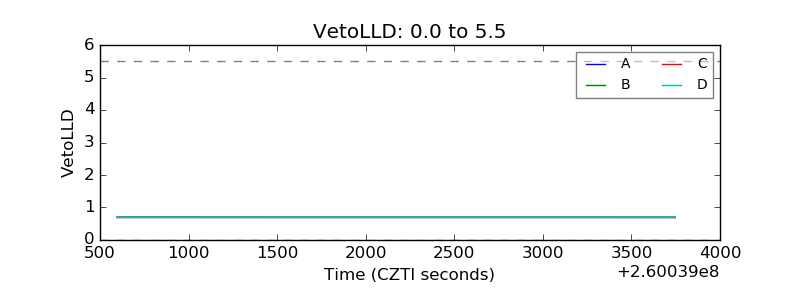 |
| Alpha Counter | 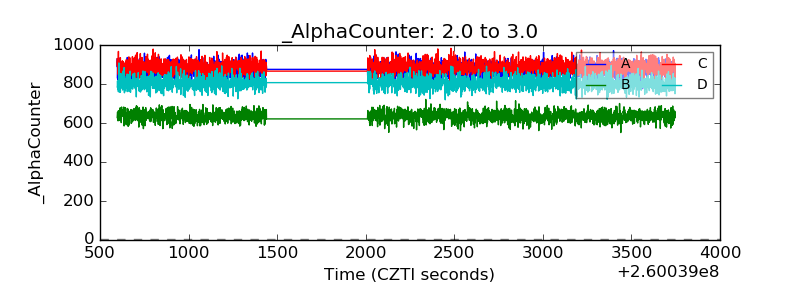 |
| _CPM_Rate | 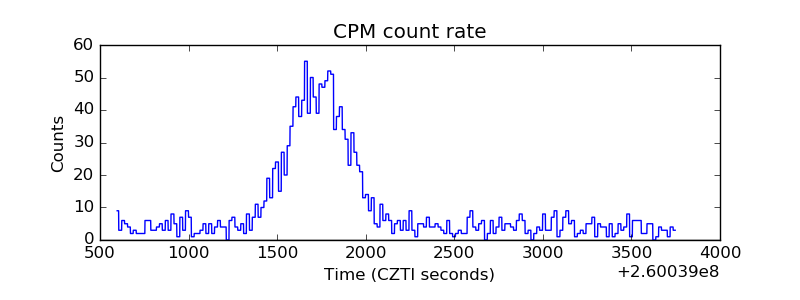 |
| CZT Counter | 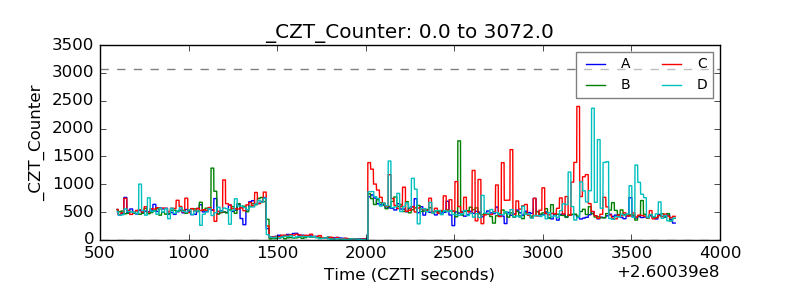 |
| +2.5 Volts monitor |  |
| +5 Volts monitor |  |
| _ROLL_ROT | 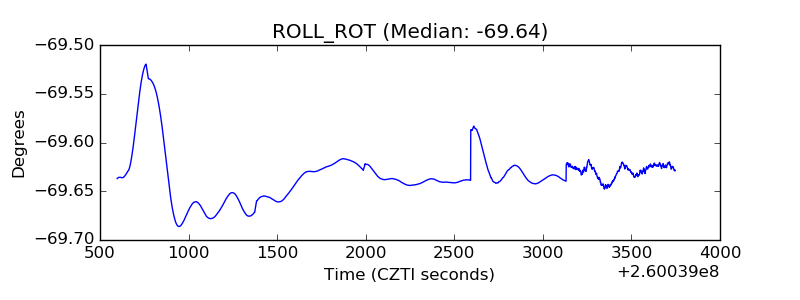 |
| _Roll_DEC | 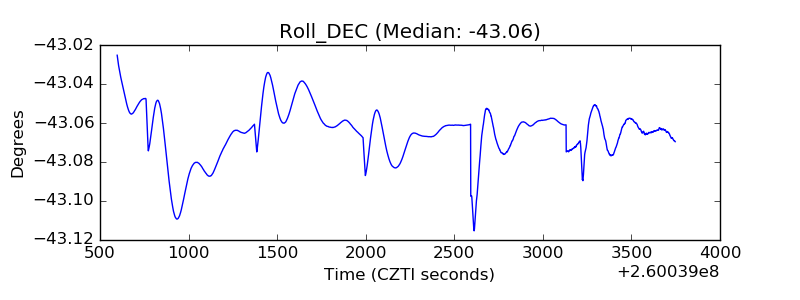 |
| _Roll_RA | 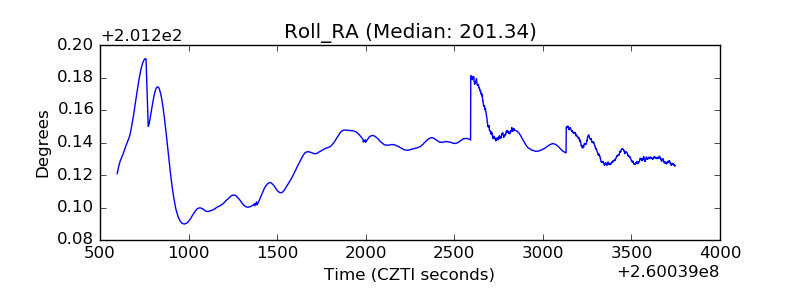 |
| Veto Counter | 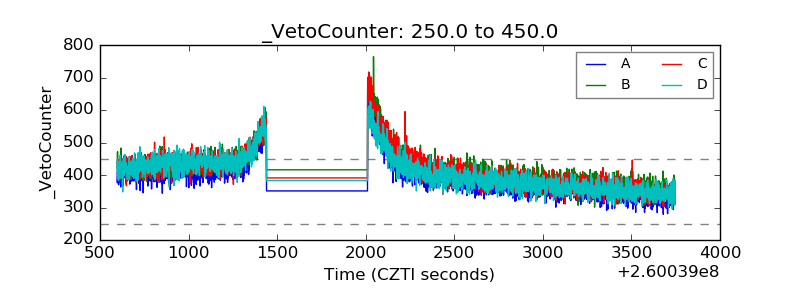 |