| Param | Original file | Final file |
|---|---|---|
| Filename | modeM0/AS1A04_048T01_9000001992_13523cztM0_level2.evt | modeM0/AS1A04_048T01_9000001992_13523cztM0_level2_quad_clean.evt |
| Size (bytes) | 573,779,520 | 108,146,880 |
| Size | 547.2 MB | 103.1 MB |
| Events in quadrant A | 3,937,029 | 682,774 |
| Events in quadrant B | 4,146,719 | 690,359 |
| Events in quadrant C | 4,609,706 | 672,283 |
| Events in quadrant D | 4,113,890 | 646,578 |
| Mode M0 | |||
|---|---|---|---|
| Quadrant | BADHDUFLAG | Total packets | Discarded packets |
| A | 0 | 17425 | 3 |
| B | 0 | 17891 | 2 |
| C | 0 | 19014 | 2 |
| D | 0 | 18276 | 2 |
| Mode M9 | |||
|---|---|---|---|
| Quadrant | BADHDUFLAG | Total packets | Discarded packets |
| A | 0 | 9 | 0 |
| B | 0 | 9 | 0 |
| C | 0 | 9 | 0 |
| D | 0 | 9 | 0 |
| Mode SS | |||
|---|---|---|---|
| Quadrant | BADHDUFLAG | Total packets | Discarded packets |
| A | 0 | 172 | 0 |
| B | 0 | 172 | 0 |
| C | 0 | 172 | 0 |
| D | 0 | 172 | 0 |
| Quadrant | Total seconds | Saturated seconds | Saturation percentage |
|---|---|---|---|
| A | 8396 | 56 | 0.666984% |
| B | 8396 | 107 | 1.274416% |
| C | 8396 | 71 | 0.845641% |
| D | 8396 | 64 | 0.762268% |
Noise dominated data is calculated using 1-second bins in cleaned event files. If a bin has >2000 counts, and if more than 50% of those come from <1% of pixels, then it is considered to be noise-dominated and hence unusable.
| Quadrant | # 1 sec bins | Bins with >0 counts | Bins with >2000 counts | High rate bins dominated by noise | Noise dominated (total time) | Noise dominated (detector-on time) | Marked lightcurve |
|---|---|---|---|---|---|---|---|
| A | 9257 | 8399 | 0 | 0 | 0.00% | 0.00% | 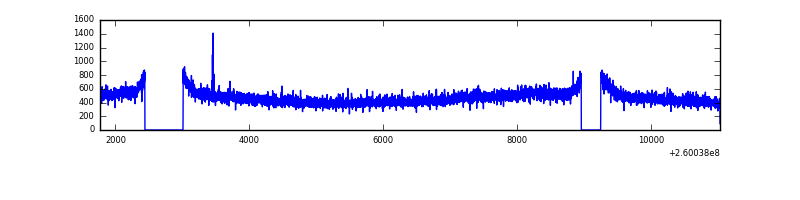 |
| B | 9257 | 8398 | 11 | 11 | 0.12% | 0.13% | 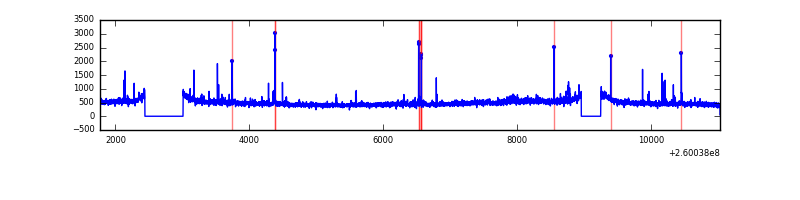 |
| C | 9257 | 8399 | 23 | 23 | 0.25% | 0.27% | 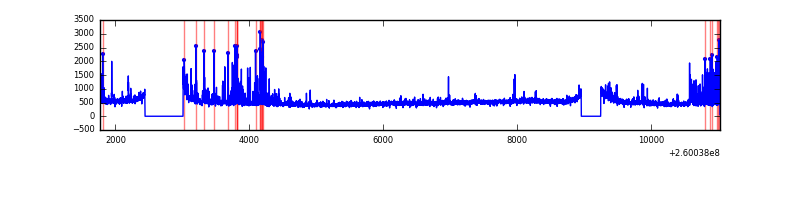 |
| D | 9257 | 8399 | 35 | 35 | 0.38% | 0.42% |  |
Top three noisy pixels from each quadrant. If the there are fewer than three noisy pixels in the level2.evt file, extra rows are filled as -1
| Pixel properties | Quadrant properties | ||||||
|---|---|---|---|---|---|---|---|
| Quadrant | DetID | PixID | Counts | Sigma | Mean | Median | Sigma |
| A | 1 | 162 | 15717 | 71.61 | 1016 | 996 | 205.6 |
| A | 0 | 226 | 9036 | 39.11 | 1016 | 996 | 205.6 |
| A | 12 | 194 | 7846 | 33.32 | 1016 | 996 | 205.6 |
| B | 0 | 189 | 35606 | 178.28 | 1016 | 990 | 194.2 |
| B | 4 | 142 | 35301 | 176.71 | 1016 | 990 | 194.2 |
| B | 4 | 173 | 31069 | 154.91 | 1016 | 990 | 194.2 |
| C | 3 | 233 | 760432 | 3354.37 | 982 | 986 | 226.4 |
| C | 13 | 61 | 6982 | 26.48 | 982 | 986 | 226.4 |
| C | 14 | 234 | 6112 | 22.64 | 982 | 986 | 226.4 |
| D | 13 | 104 | 248049 | 1052.79 | 975 | 945 | 234.7 |
| D | 13 | 172 | 67479 | 283.47 | 975 | 945 | 234.7 |
| D | 13 | 122 | 65374 | 274.5 | 975 | 945 | 234.7 |
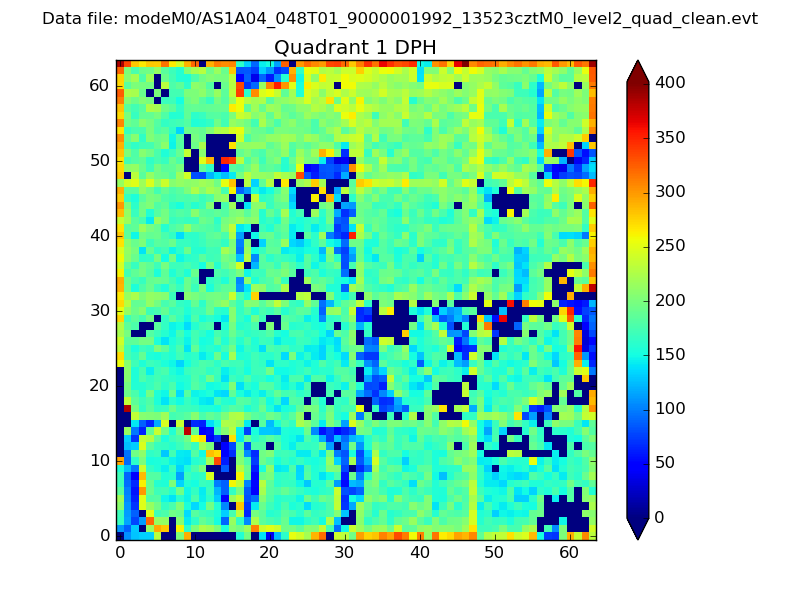
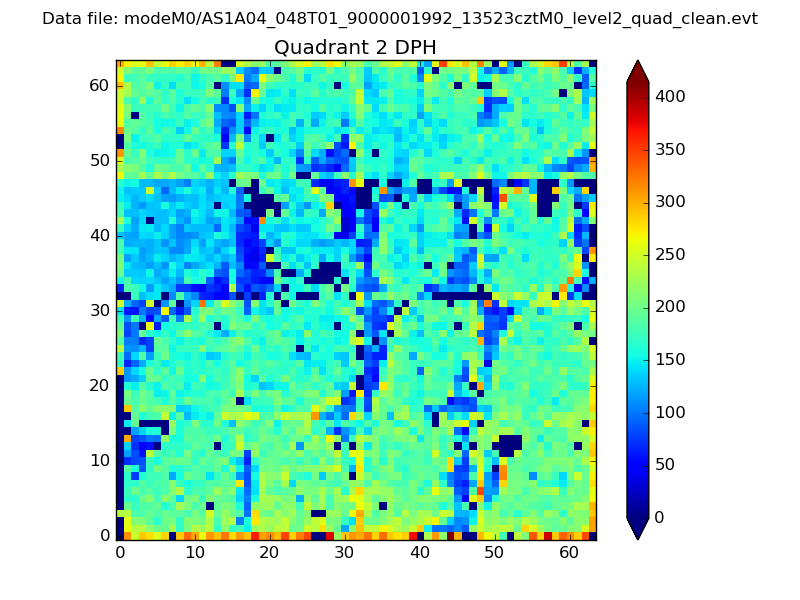
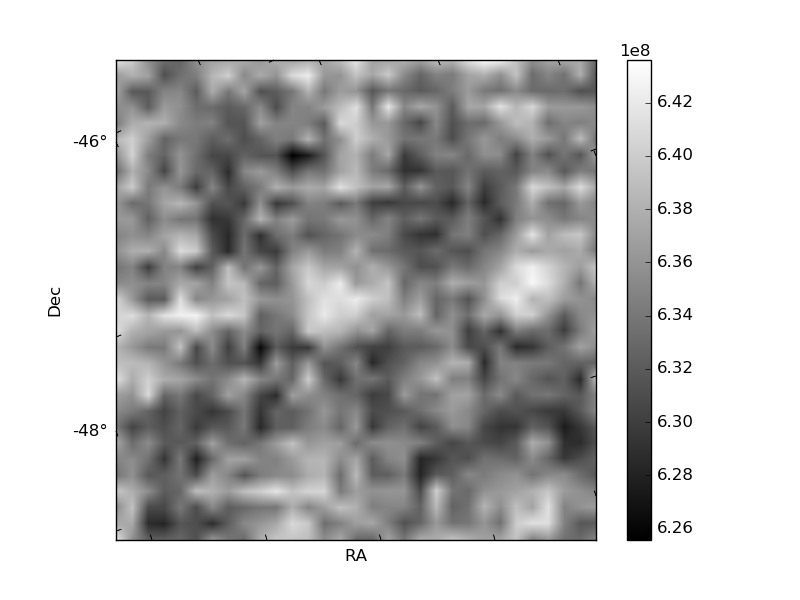
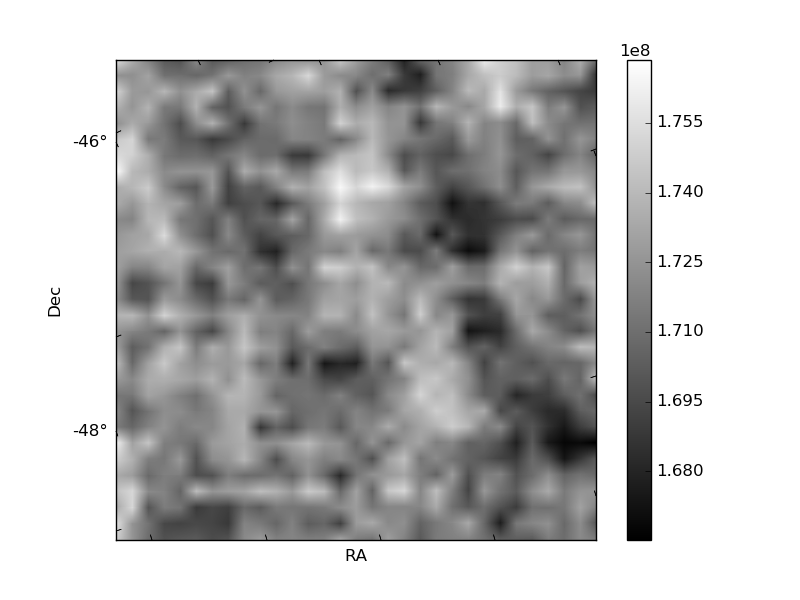
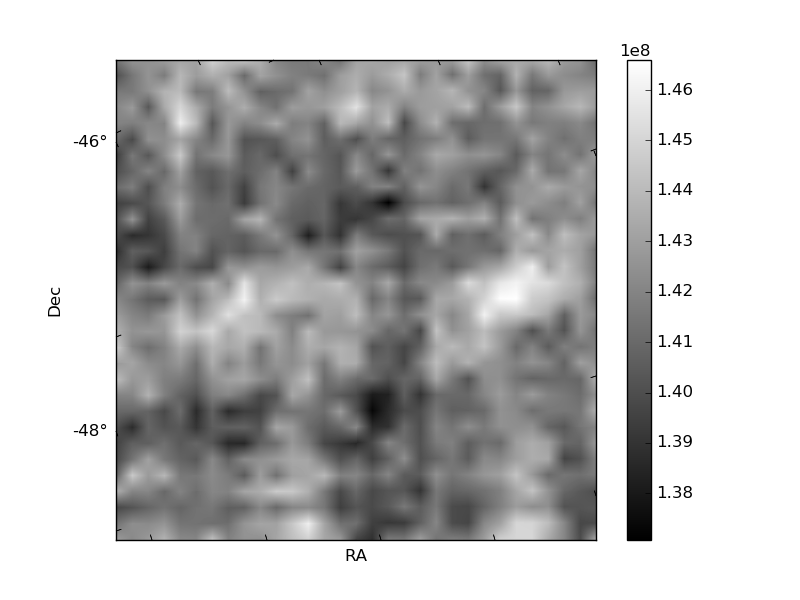
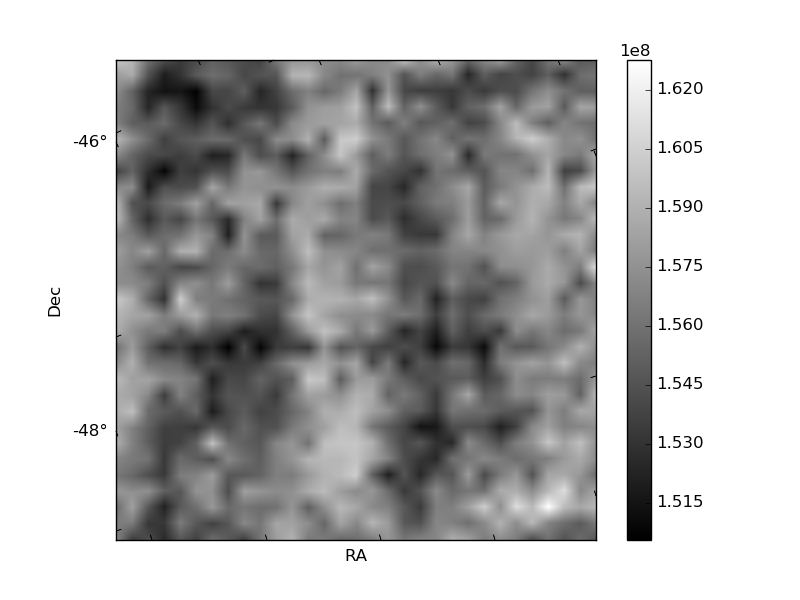
Histogram calculated using DETX and DETY for each event in the final _common_clean file
| Quadrant A | 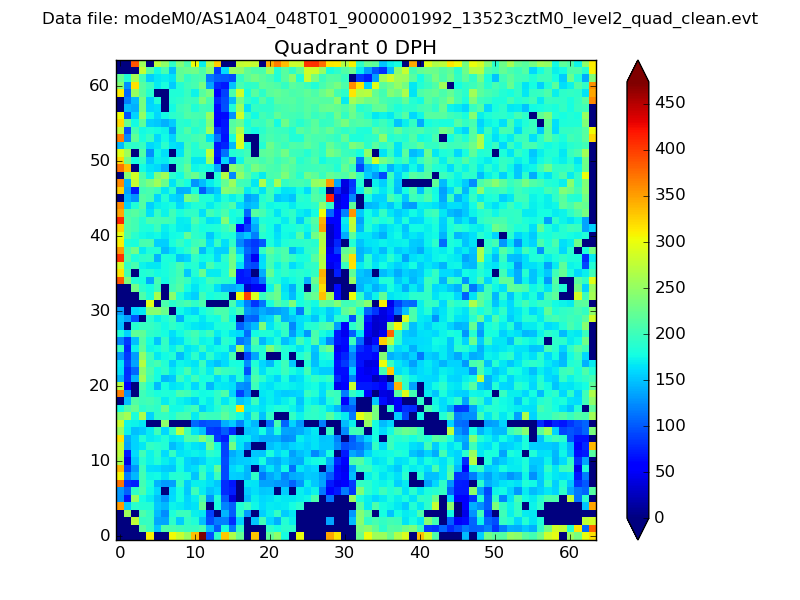 |
 |
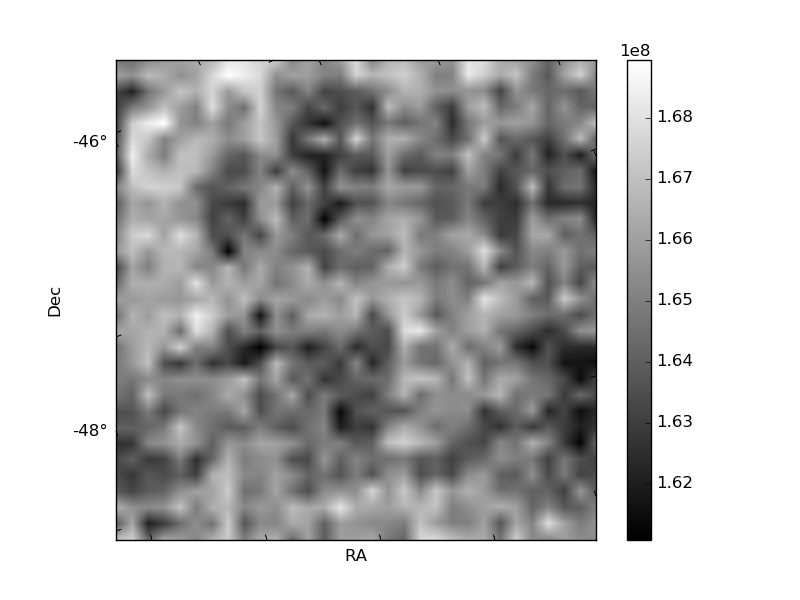
Quadrant B |
|---|---|---|---|
| Quadrant D | 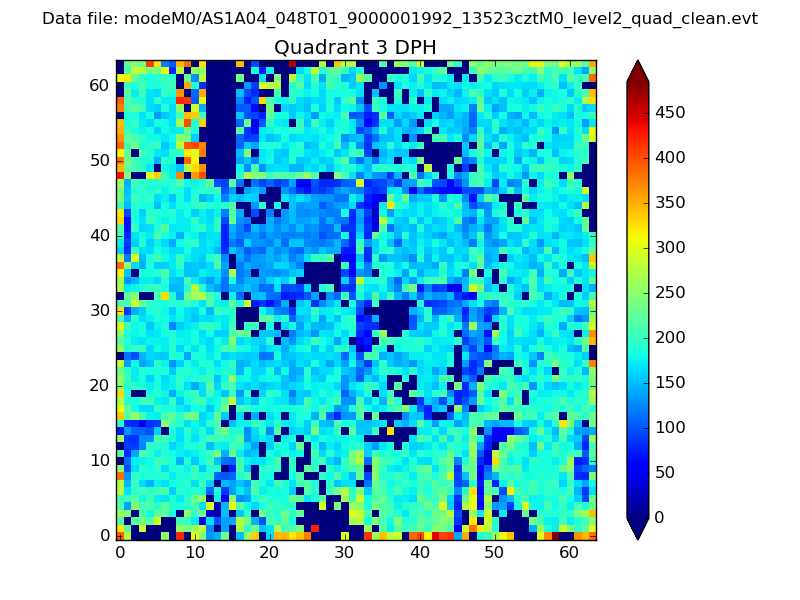 |
 |
Quadrant C |
| Plot type | Count rate plots | Images |
|---|---|---|
| Comparison with Poisson distribution Blue bars denote a histogram of data divided into 1 sec bins. Red curve is a Poisson curve with rate = median count rate of data. |
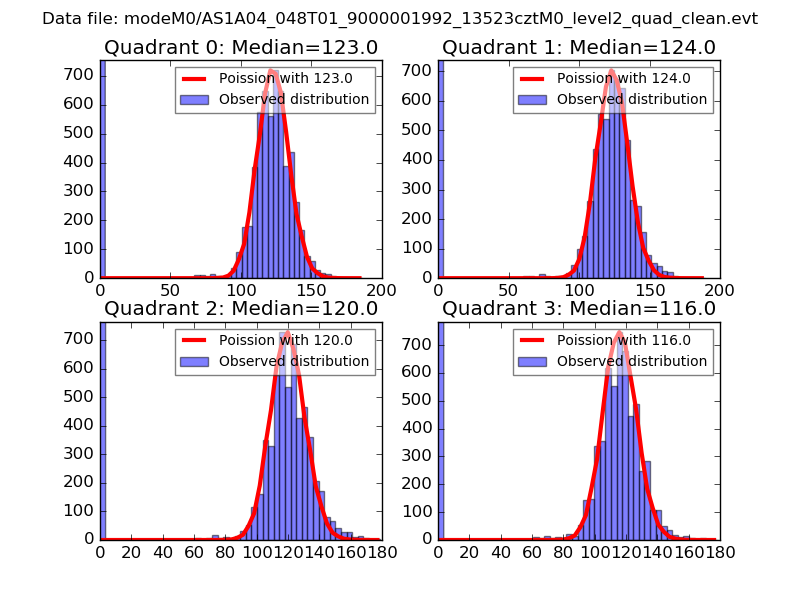 |
 |
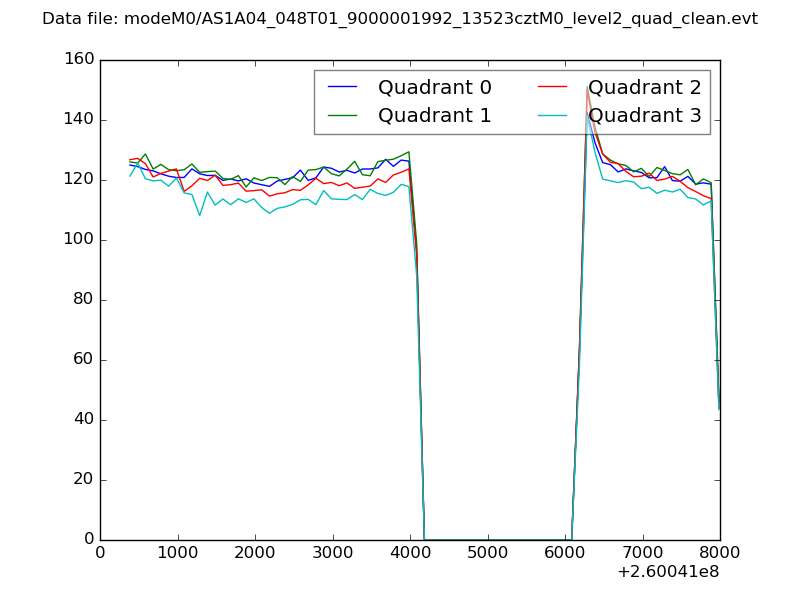
| Quadrant-wise count rates Data is divided into 100 sec bins |
 |
|
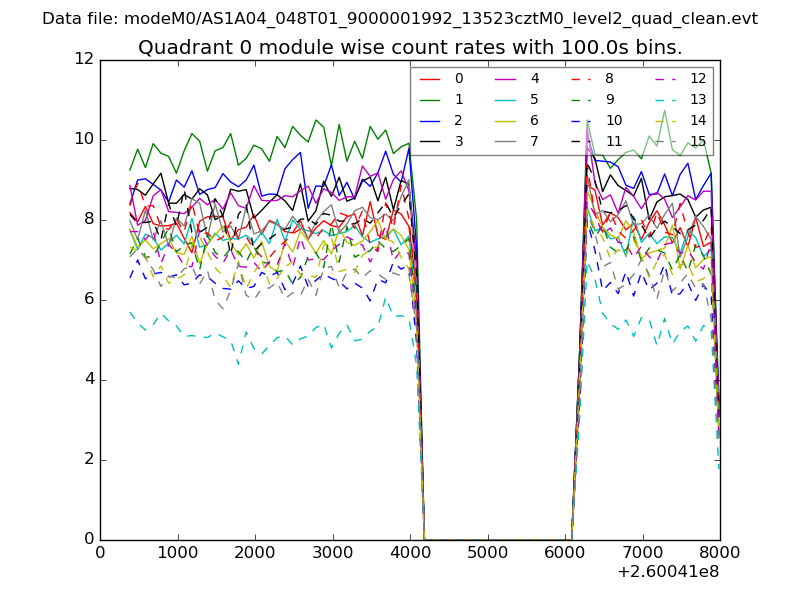
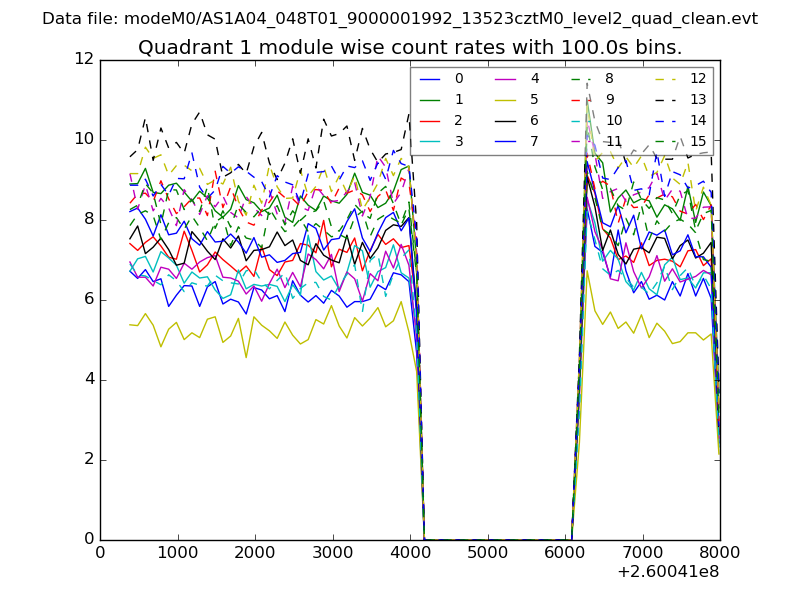
| Module-wise count rates for Quadrant A Data is divided into 100 sec bins |
 |
 |
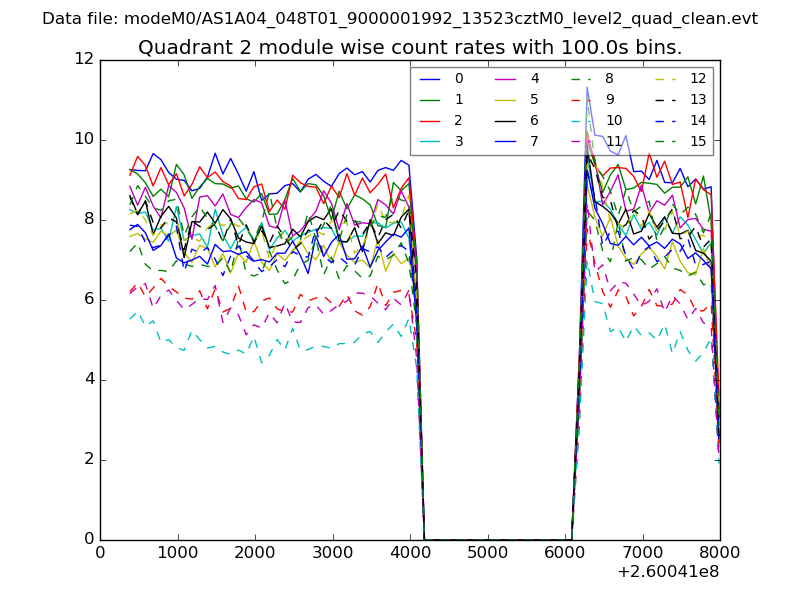
| Module-wise count rates for Quadrant B Data is divided into 100 sec bins |
 |
 |
| Module-wise count rates for Quadrant C Data is divided into 100 sec bins |
 |
 |
| Module-wise count rates for Quadrant D Data is divided into 100 sec bins |
 |
 |
| Parameter | Plot |
|---|---|
| CZT HV Monitor | 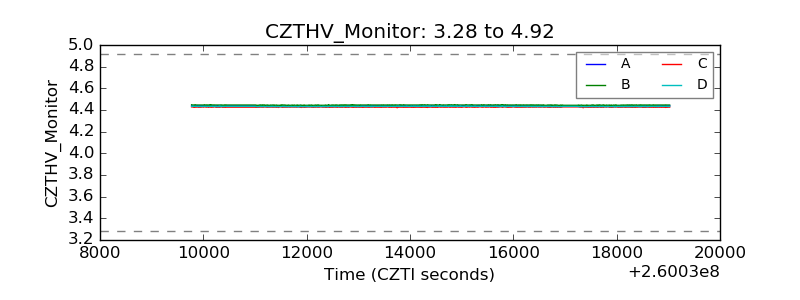 |
| D_VDD | 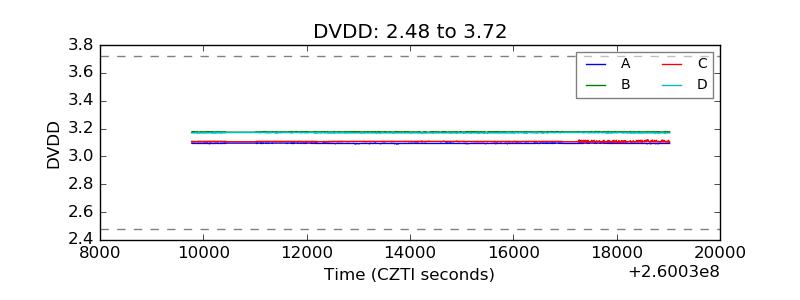 |
| Temperature 1 | 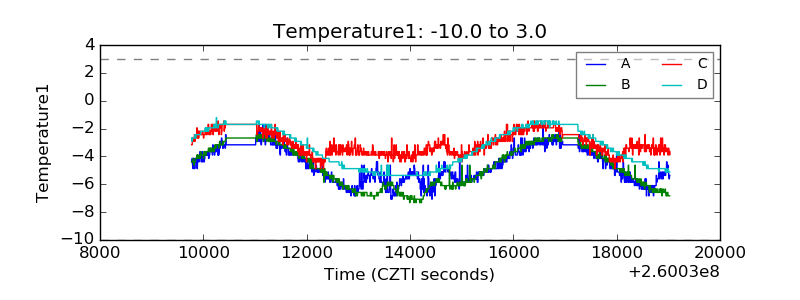 |
| Veto HV Monitor | 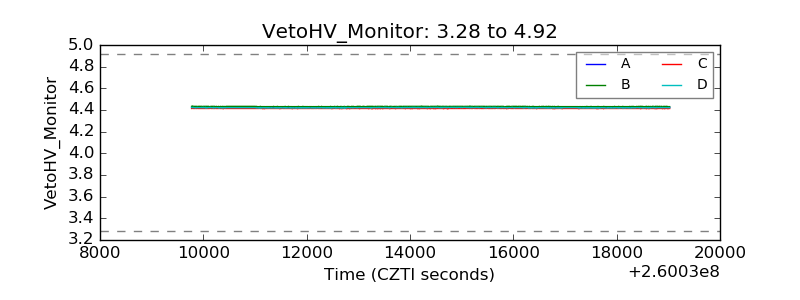 |
| Veto LLD | 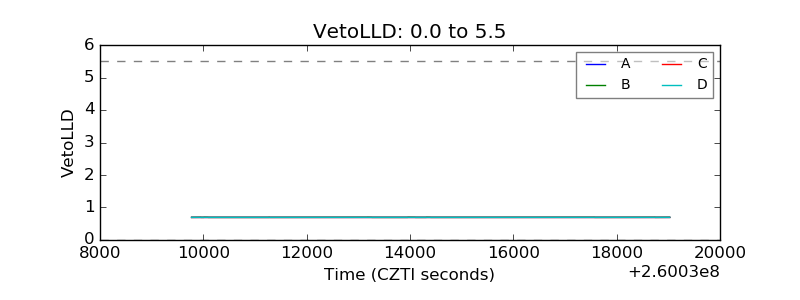 |
| Alpha Counter | 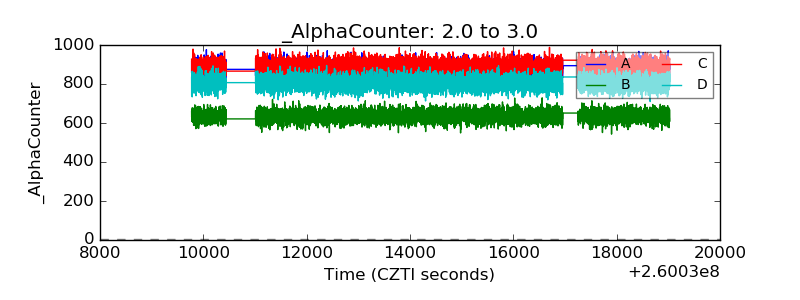 |
| _CPM_Rate | 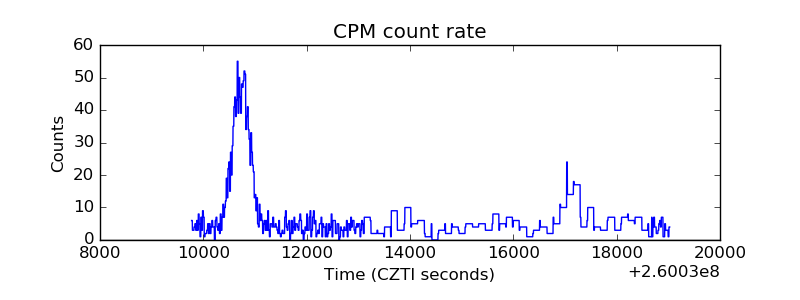 |
| CZT Counter | 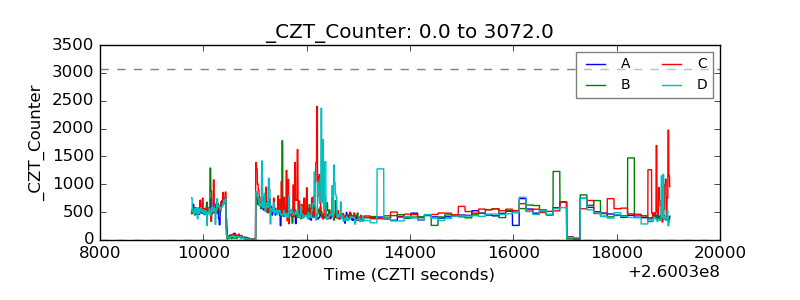 |
| +2.5 Volts monitor |  |
| +5 Volts monitor |  |
| _ROLL_ROT |  |
| _Roll_DEC |  |
| _Roll_RA | 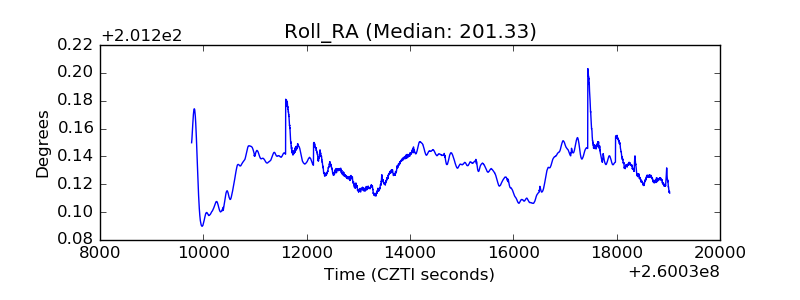 |
| Veto Counter | 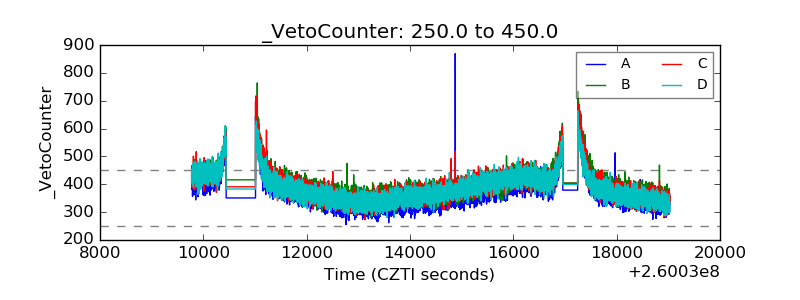 |