| Param | Original file | Final file |
|---|---|---|
| Filename | modeM0/AS1A04_048T01_9000001992_13524cztM0_level2.evt | modeM0/AS1A04_048T01_9000001992_13524cztM0_level2_quad_clean.evt |
| Size (bytes) | 520,813,440 | 102,271,680 |
| Size | 496.7 MB | 97.5 MB |
| Events in quadrant A | 3,393,818 | 657,968 |
| Events in quadrant B | 3,573,097 | 665,020 |
| Events in quadrant C | 4,305,631 | 645,252 |
| Events in quadrant D | 3,993,752 | 609,754 |
| Mode M0 | |||
|---|---|---|---|
| Quadrant | BADHDUFLAG | Total packets | Discarded packets |
| A | 0 | 15237 | 2 |
| B | 0 | 15618 | 1 |
| C | 0 | 17529 | 1 |
| D | 0 | 17506 | 1 |
| Mode M9 | |||
|---|---|---|---|
| Quadrant | BADHDUFLAG | Total packets | Discarded packets |
| A | 0 | 3 | 0 |
| B | 0 | 3 | 0 |
| C | 0 | 3 | 0 |
| D | 0 | 3 | 0 |
| Mode SS | |||
|---|---|---|---|
| Quadrant | BADHDUFLAG | Total packets | Discarded packets |
| A | 0 | 152 | 0 |
| B | 0 | 152 | 0 |
| C | 0 | 152 | 0 |
| D | 0 | 152 | 0 |
| Quadrant | Total seconds | Saturated seconds | Saturation percentage |
|---|---|---|---|
| A | 7458 | 19 | 0.254760% |
| B | 7458 | 66 | 0.884956% |
| C | 7458 | 61 | 0.817914% |
| D | 7458 | 330 | 4.424779% |
Noise dominated data is calculated using 1-second bins in cleaned event files. If a bin has >2000 counts, and if more than 50% of those come from <1% of pixels, then it is considered to be noise-dominated and hence unusable.
| Quadrant | # 1 sec bins | Bins with >0 counts | Bins with >2000 counts | High rate bins dominated by noise | Noise dominated (total time) | Noise dominated (detector-on time) | Marked lightcurve |
|---|---|---|---|---|---|---|---|
| A | 7784 | 7460 | 0 | 0 | 0.00% | 0.00% | 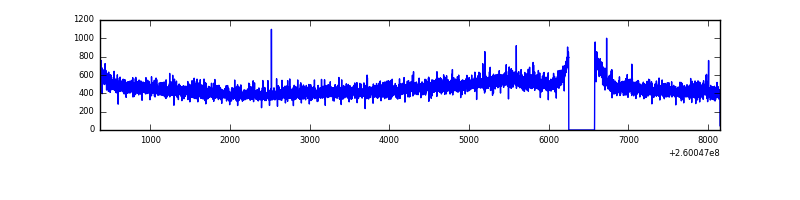 |
| B | 7784 | 7459 | 11 | 11 | 0.14% | 0.15% | 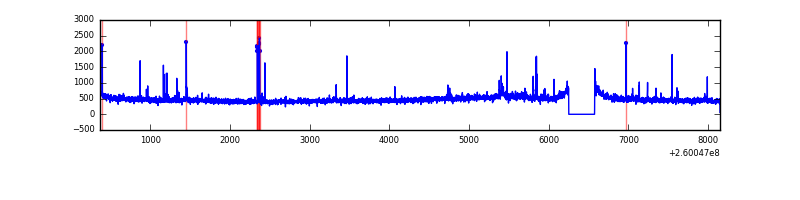 |
| C | 7784 | 7460 | 44 | 44 | 0.57% | 0.59% | 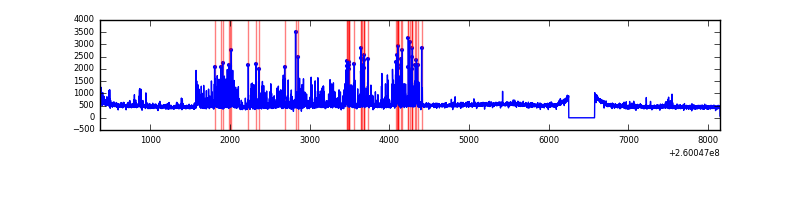 |
| D | 7784 | 7459 | 181 | 181 | 2.33% | 2.43% | 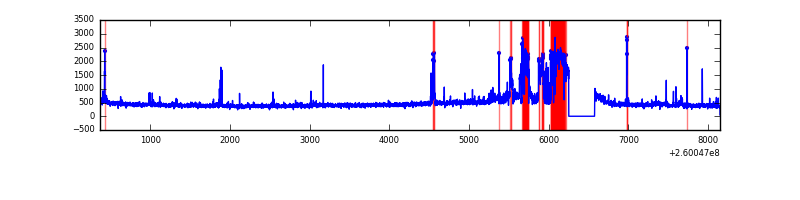 |
Top three noisy pixels from each quadrant. If the there are fewer than three noisy pixels in the level2.evt file, extra rows are filled as -1
| Pixel properties | Quadrant properties | ||||||
|---|---|---|---|---|---|---|---|
| Quadrant | DetID | PixID | Counts | Sigma | Mean | Median | Sigma |
| A | 1 | 162 | 10829 | 55.47 | 879 | 860 | 179.7 |
| A | 0 | 226 | 7828 | 38.77 | 879 | 860 | 179.7 |
| A | 12 | 194 | 6834 | 33.24 | 879 | 860 | 179.7 |
| B | 3 | 64 | 33822 | 195.05 | 880 | 857 | 169.0 |
| B | 4 | 142 | 31143 | 179.2 | 880 | 857 | 169.0 |
| B | 4 | 173 | 21916 | 124.6 | 880 | 857 | 169.0 |
| C | 3 | 233 | 977363 | 4952.43 | 850 | 855 | 197.2 |
| C | 8 | 128 | 7412 | 33.25 | 850 | 855 | 197.2 |
| C | 13 | 61 | 6178 | 26.99 | 850 | 855 | 197.2 |
| D | 13 | 104 | 796861 | 4008.75 | 822 | 798 | 198.6 |
| D | 13 | 122 | 48665 | 241.04 | 822 | 798 | 198.6 |
| D | 2 | 234 | 29397 | 144.02 | 822 | 798 | 198.6 |
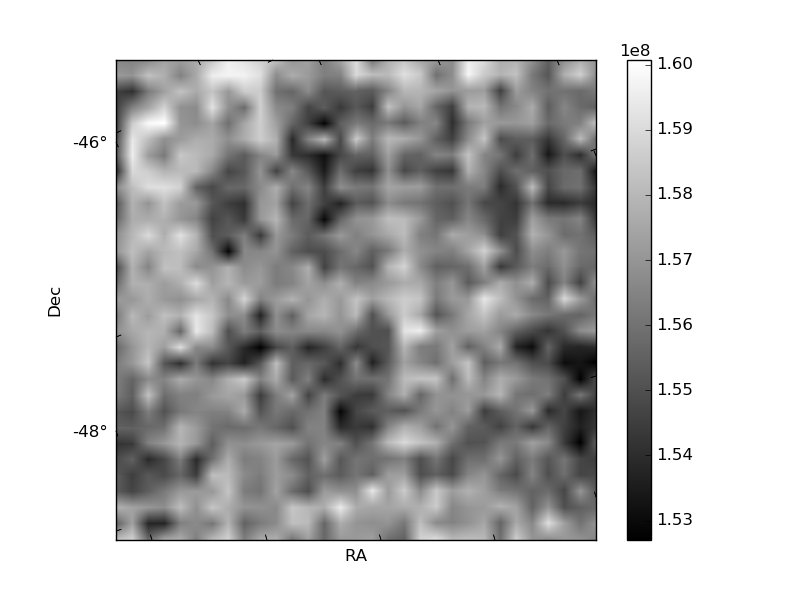
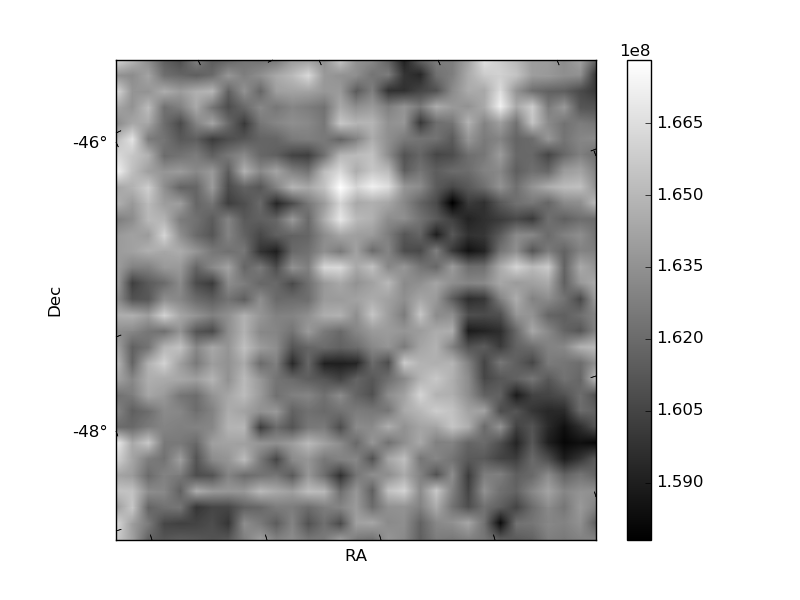
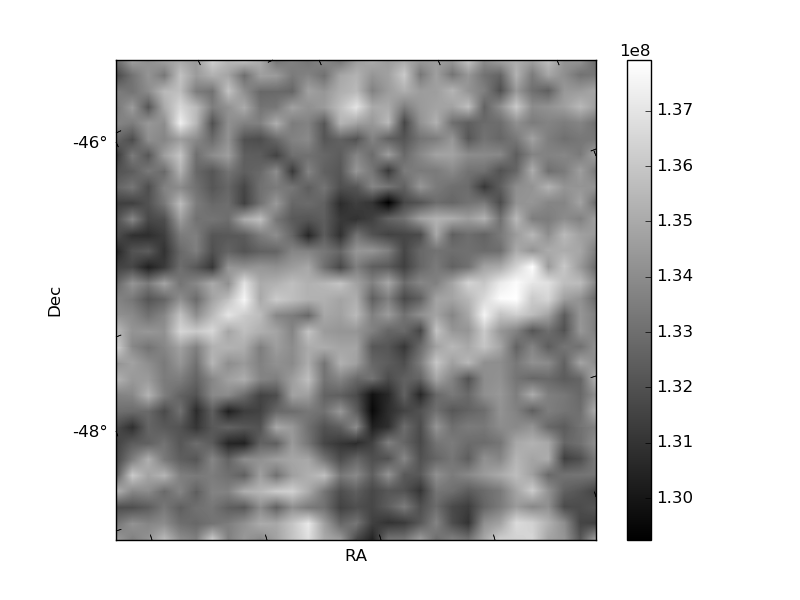
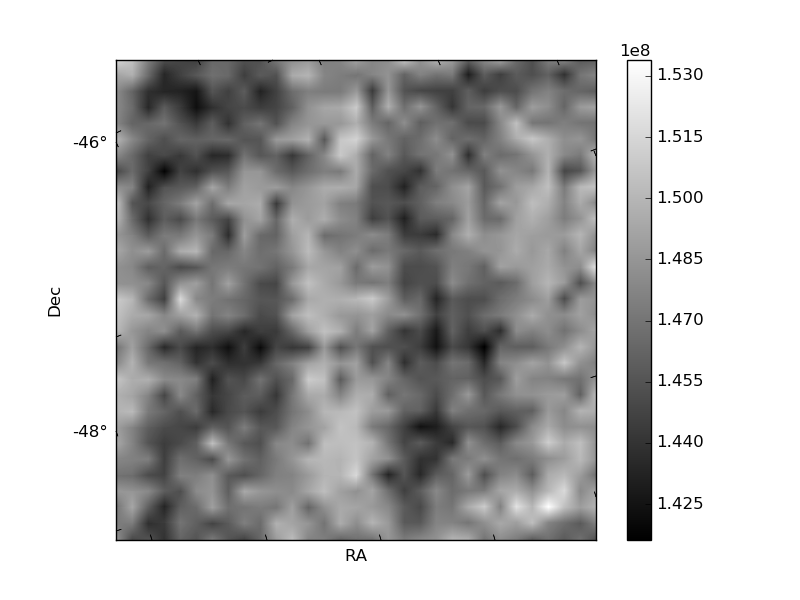
Histogram calculated using DETX and DETY for each event in the final _common_clean file
| Quadrant A | 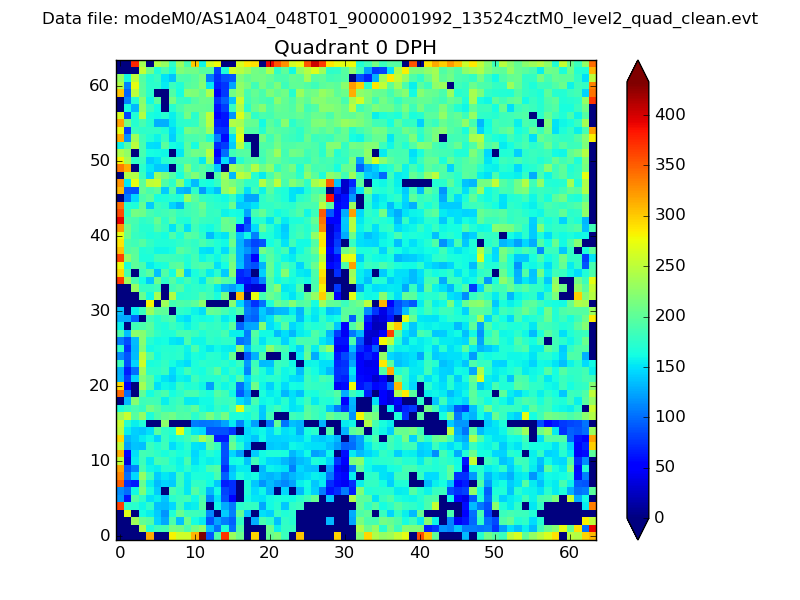 |
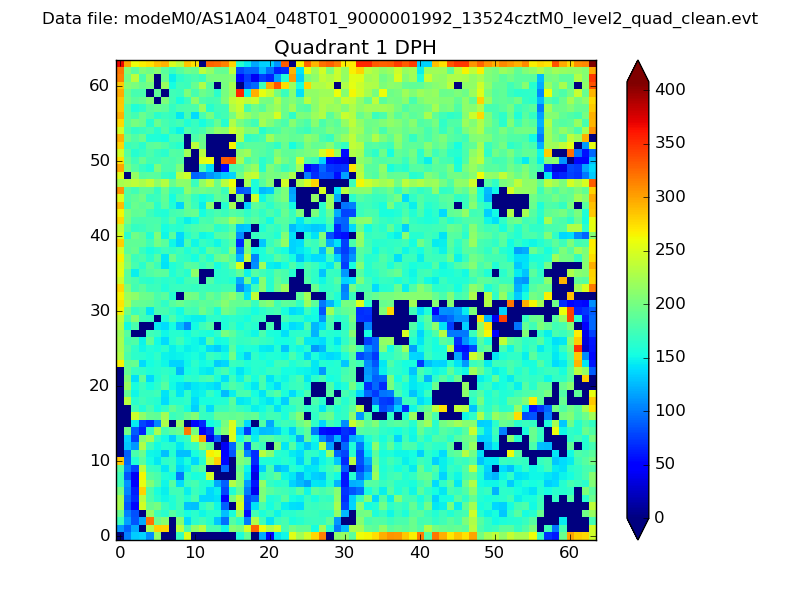 |
Quadrant B |
|---|---|---|---|
| Quadrant D | 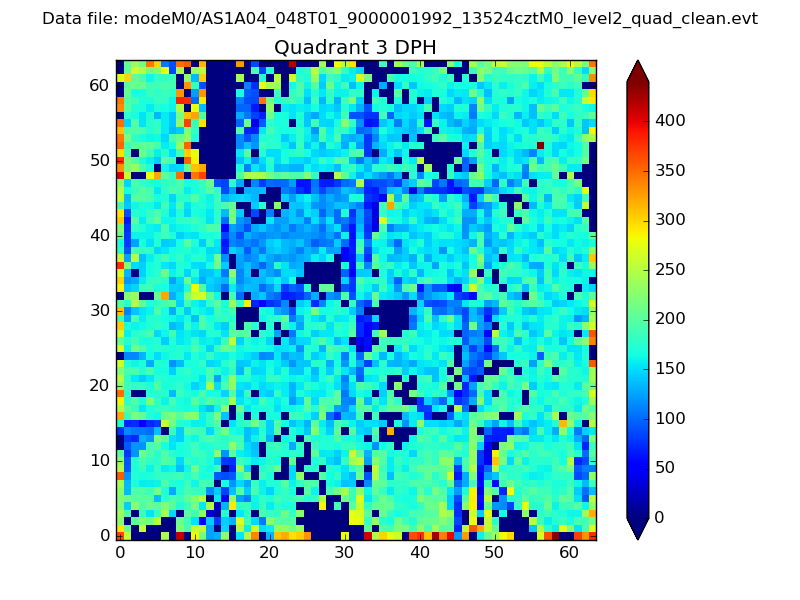 |
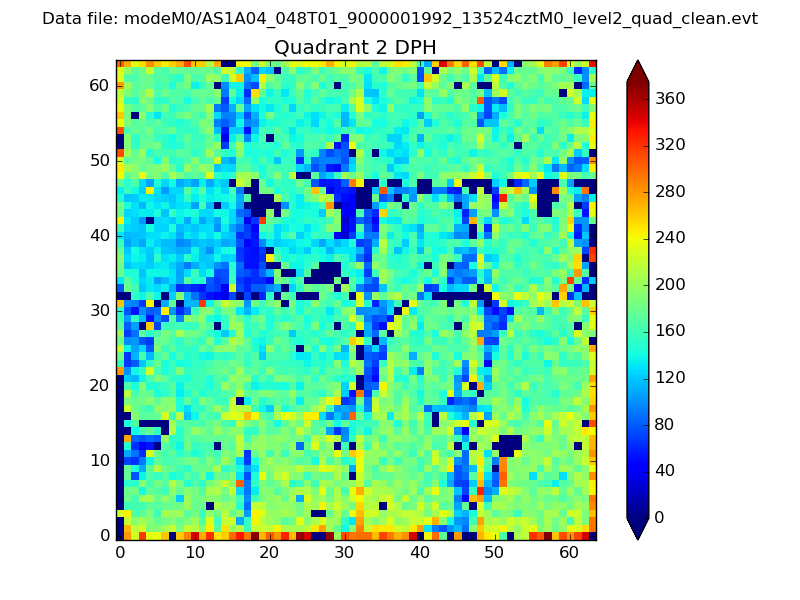 |
Quadrant C |
| Plot type | Count rate plots | Images |
|---|---|---|
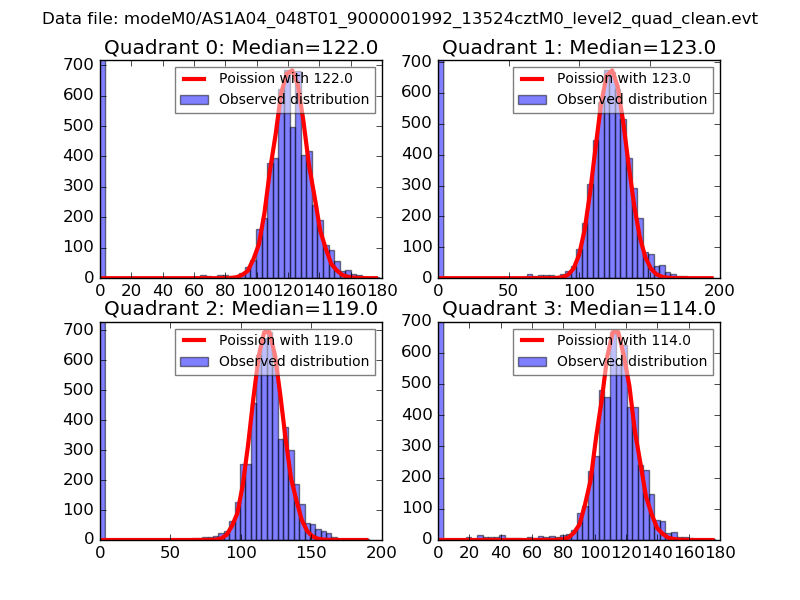
| Comparison with Poisson distribution Blue bars denote a histogram of data divided into 1 sec bins. Red curve is a Poisson curve with rate = median count rate of data. |
 |
 |
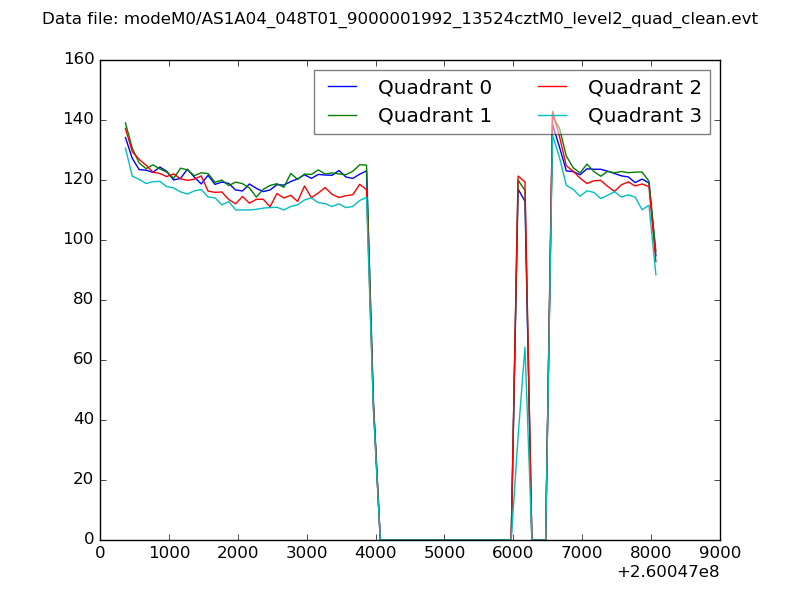
| Quadrant-wise count rates Data is divided into 100 sec bins |
 |
|
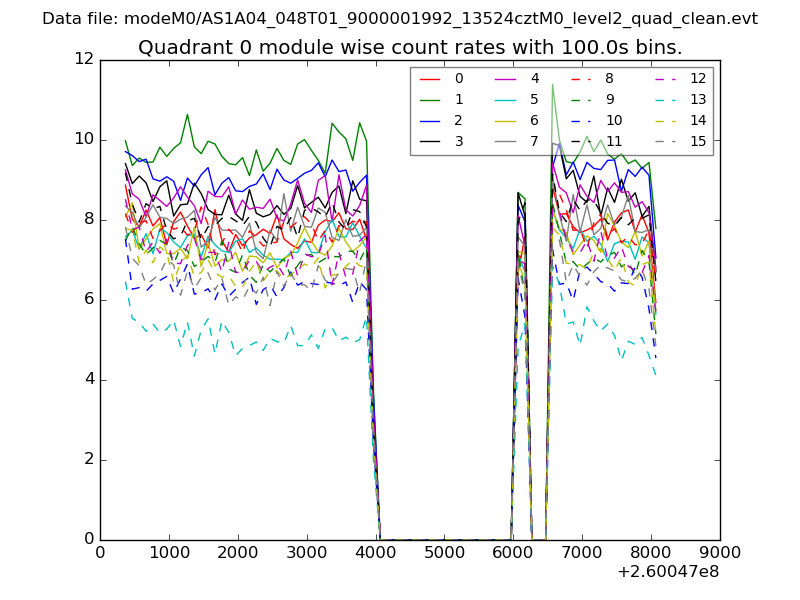
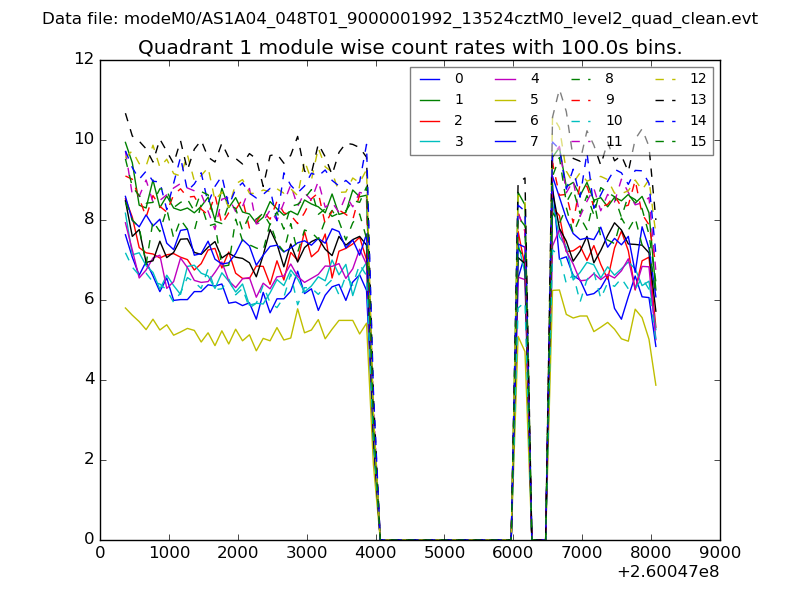
| Module-wise count rates for Quadrant A Data is divided into 100 sec bins |
 |
 |
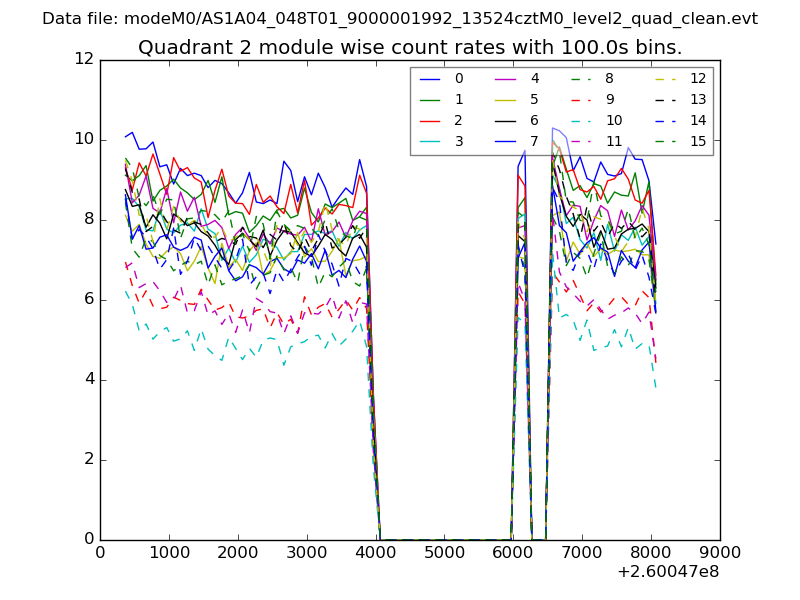
| Module-wise count rates for Quadrant B Data is divided into 100 sec bins |
 |
 |
| Module-wise count rates for Quadrant C Data is divided into 100 sec bins |
 |
 |
| Module-wise count rates for Quadrant D Data is divided into 100 sec bins |
 |
 |
| Parameter | Plot |
|---|---|
| CZT HV Monitor | 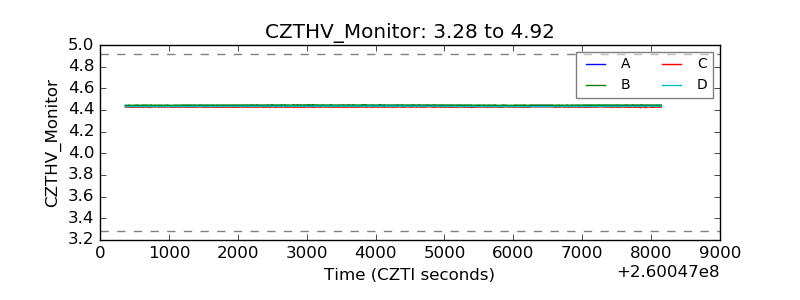 |
| D_VDD | 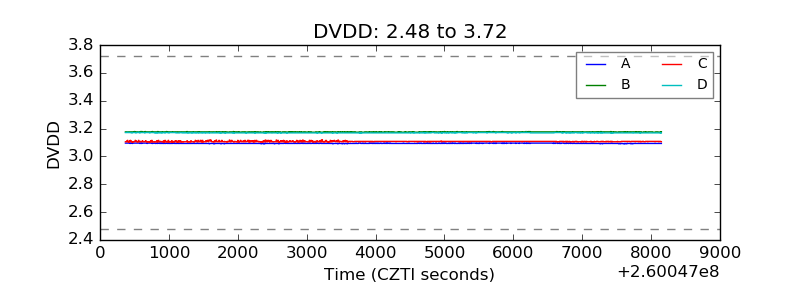 |
| Temperature 1 | 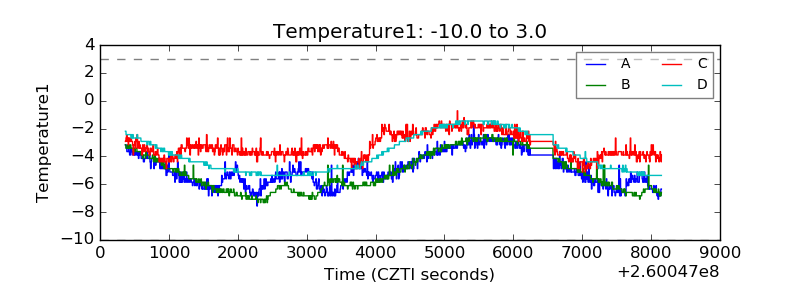 |
| Veto HV Monitor | 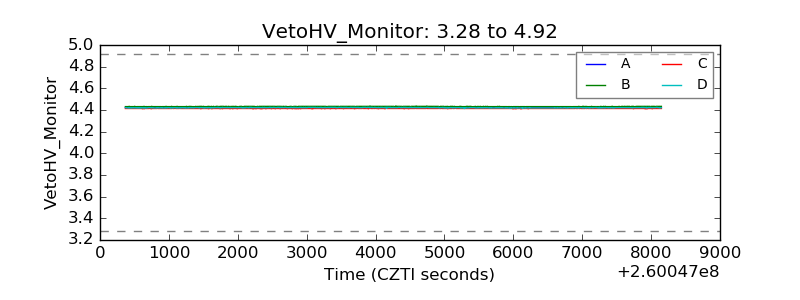 |
| Veto LLD | 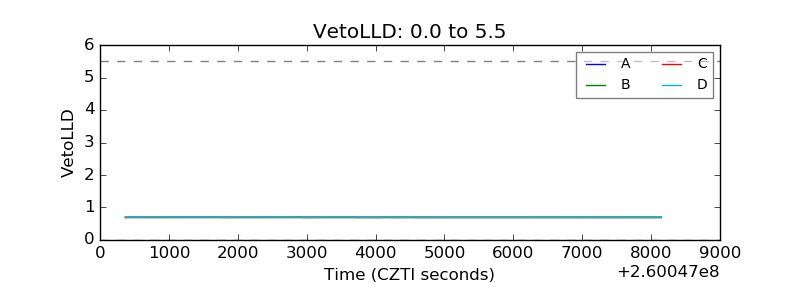 |
| Alpha Counter | 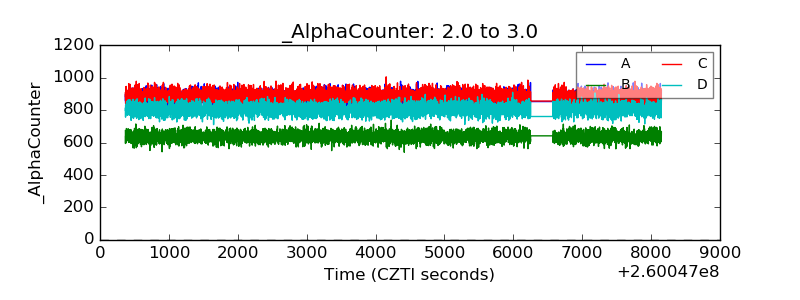 |
| _CPM_Rate | 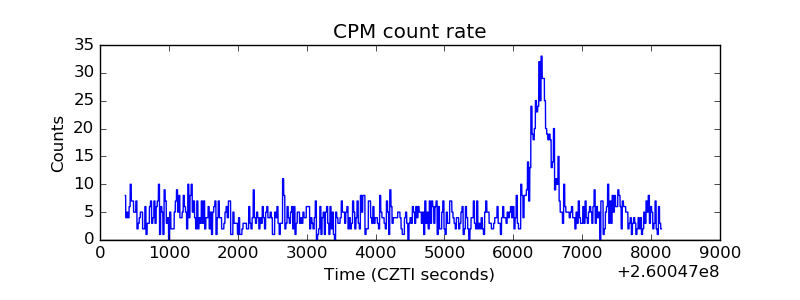 |
| CZT Counter | 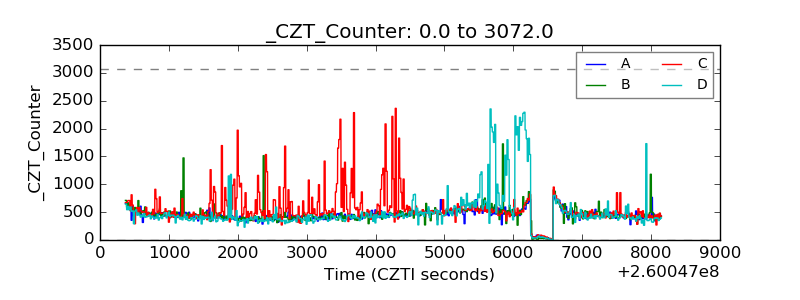 |
| +2.5 Volts monitor |  |
| +5 Volts monitor |  |
| _ROLL_ROT | 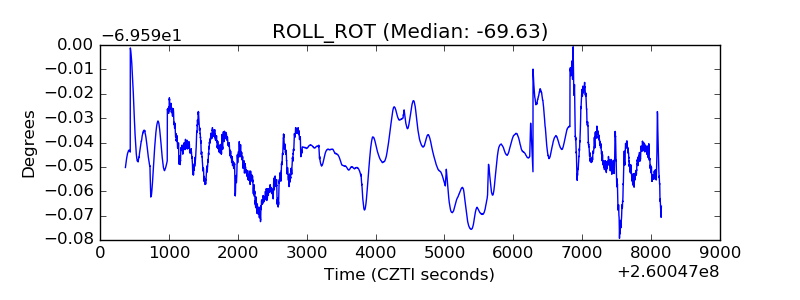 |
| _Roll_DEC | 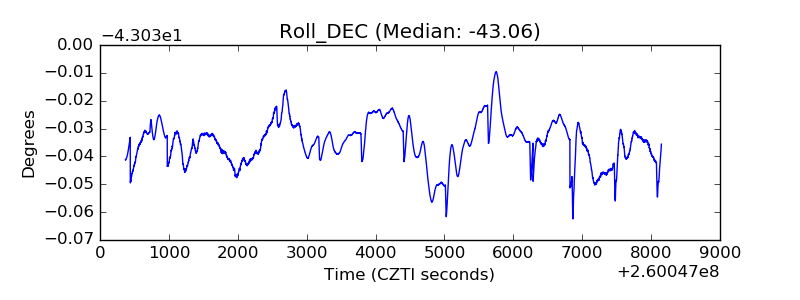 |
| _Roll_RA | 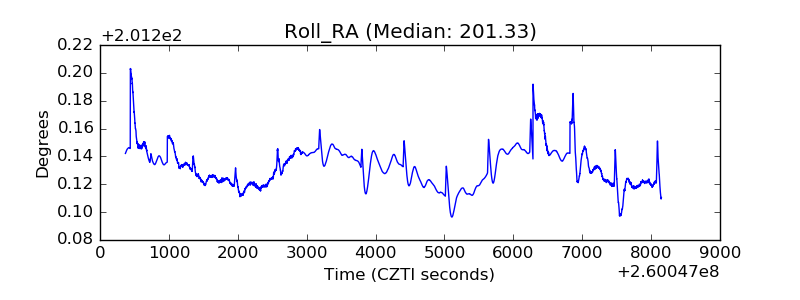 |
| Veto Counter | 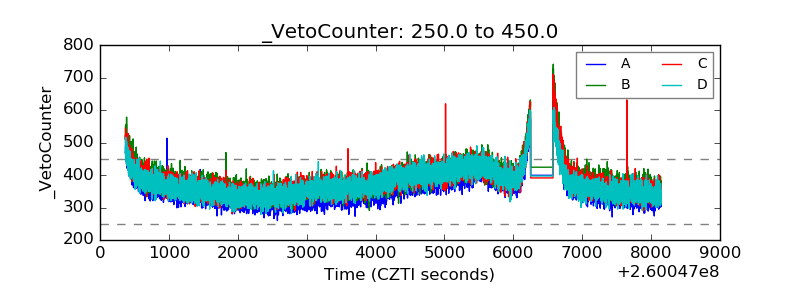 |