| Param | Original file | Final file |
|---|---|---|
| Filename | modeM0/AS1A04_048T01_9000001992_13527cztM0_level2.evt | modeM0/AS1A04_048T01_9000001992_13527cztM0_level2_quad_clean.evt |
| Size (bytes) | 1,222,966,080 | 241,329,600 |
| Size | 1.1 GB | 230.1 MB |
| Events in quadrant A | 8,468,759 | 1,531,490 |
| Events in quadrant B | 9,158,254 | 1,548,506 |
| Events in quadrant C | 9,355,598 | 1,511,811 |
| Events in quadrant D | 8,794,745 | 1,434,104 |
| Mode M0 | |||
|---|---|---|---|
| Quadrant | BADHDUFLAG | Total packets | Discarded packets |
| A | 0 | 37902 | 5 |
| B | 0 | 39555 | 4 |
| C | 0 | 39214 | 4 |
| D | 0 | 39573 | 4 |
| Mode M9 | |||
|---|---|---|---|
| Quadrant | BADHDUFLAG | Total packets | Discarded packets |
| A | 0 | 23 | 0 |
| B | 0 | 23 | 0 |
| C | 0 | 23 | 0 |
| D | 0 | 23 | 0 |
| Mode SS | |||
|---|---|---|---|
| Quadrant | BADHDUFLAG | Total packets | Discarded packets |
| A | 0 | 382 | 0 |
| B | 0 | 382 | 0 |
| C | 0 | 382 | 0 |
| D | 0 | 382 | 0 |
| Quadrant | Total seconds | Saturated seconds | Saturation percentage |
|---|---|---|---|
| A | 18622 | 54 | 0.289980% |
| B | 18622 | 240 | 1.288798% |
| C | 18622 | 109 | 0.585329% |
| D | 18622 | 242 | 1.299538% |
Noise dominated data is calculated using 1-second bins in cleaned event files. If a bin has >2000 counts, and if more than 50% of those come from <1% of pixels, then it is considered to be noise-dominated and hence unusable.
| Quadrant | # 1 sec bins | Bins with >0 counts | Bins with >2000 counts | High rate bins dominated by noise | Noise dominated (total time) | Noise dominated (detector-on time) | Marked lightcurve |
|---|---|---|---|---|---|---|---|
| A | 20913 | 18626 | 0 | 0 | 0.00% | 0.00% |  |
| B | 20913 | 18624 | 69 | 69 | 0.33% | 0.37% |  |
| C | 20913 | 18626 | 15 | 15 | 0.07% | 0.08% | 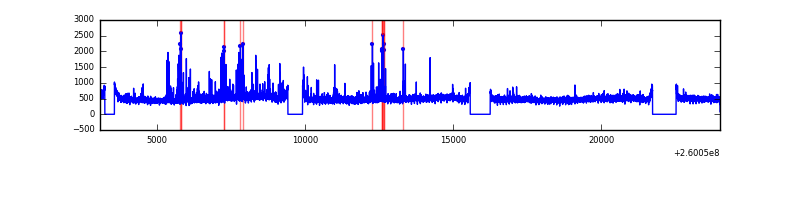 |
| D | 20913 | 18624 | 121 | 121 | 0.58% | 0.65% | 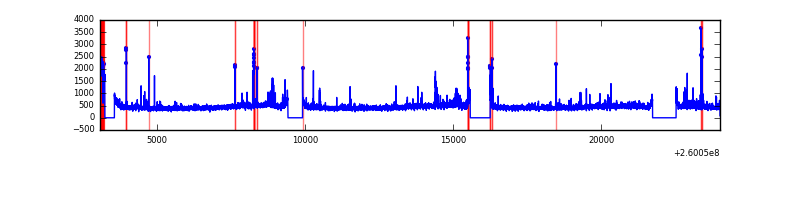 |
Top three noisy pixels from each quadrant. If the there are fewer than three noisy pixels in the level2.evt file, extra rows are filled as -1
| Pixel properties | Quadrant properties | ||||||
|---|---|---|---|---|---|---|---|
| Quadrant | DetID | PixID | Counts | Sigma | Mean | Median | Sigma |
| A | 1 | 162 | 30944 | 64.68 | 2188 | 2140 | 445.3 |
| A | 0 | 226 | 19134 | 38.16 | 2188 | 2140 | 445.3 |
| A | 12 | 194 | 16444 | 32.12 | 2188 | 2140 | 445.3 |
| B | 3 | 64 | 256707 | 611.28 | 2191 | 2131 | 416.5 |
| B | 4 | 173 | 128864 | 304.31 | 2191 | 2131 | 416.5 |
| B | 0 | 230 | 77165 | 180.17 | 2191 | 2131 | 416.5 |
| C | 3 | 233 | 993548 | 2010.71 | 2143 | 2155 | 493.1 |
| C | 13 | 61 | 15499 | 27.06 | 2143 | 2155 | 493.1 |
| C | 14 | 234 | 7418 | 10.67 | 2143 | 2155 | 493.1 |
| D | 13 | 104 | 407620 | 806.32 | 2104 | 2044 | 503.0 |
| D | 12 | 110 | 164079 | 322.14 | 2104 | 2044 | 503.0 |
| D | 13 | 122 | 95526 | 185.85 | 2104 | 2044 | 503.0 |
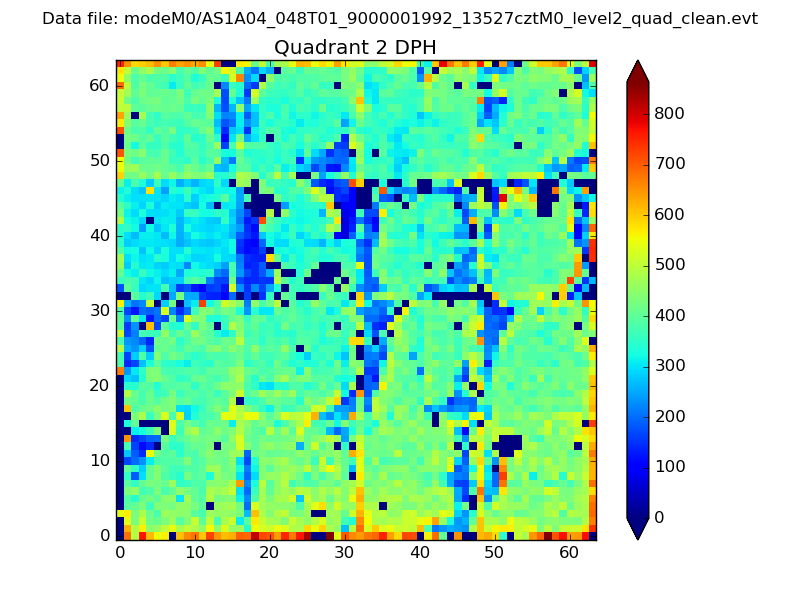
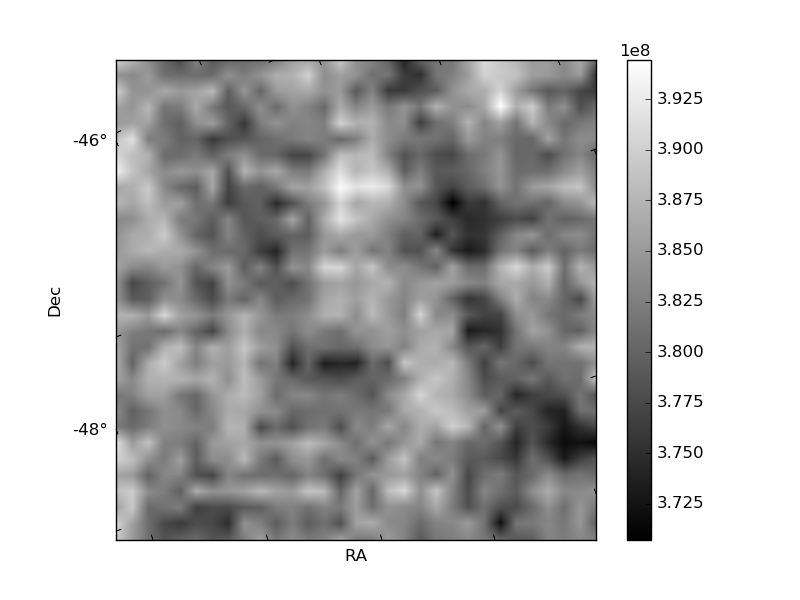
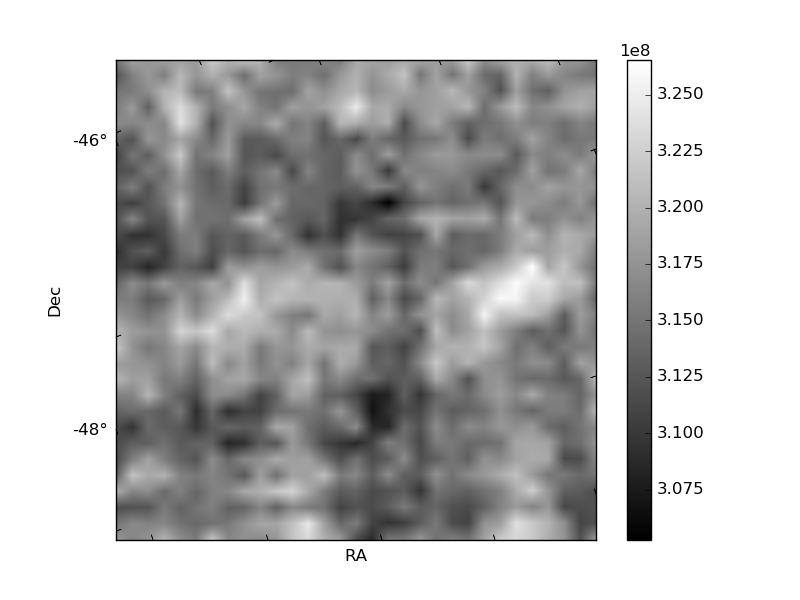
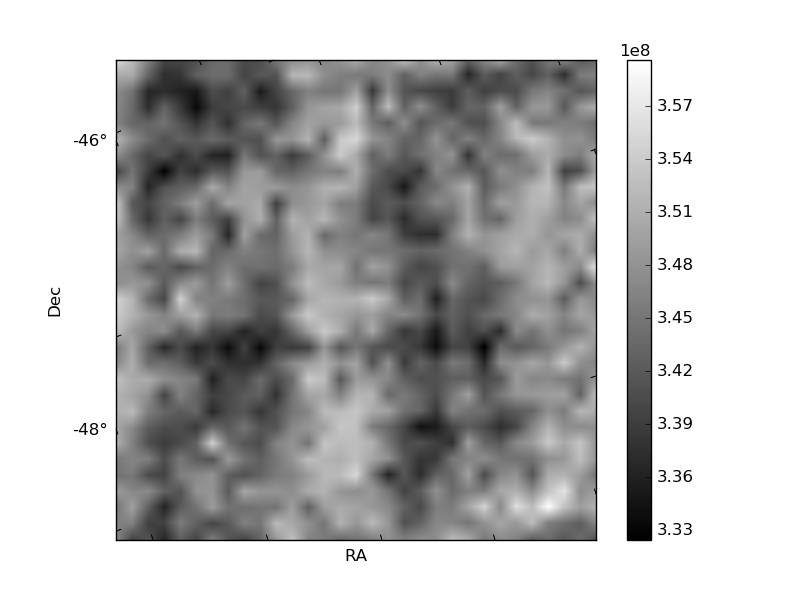
Histogram calculated using DETX and DETY for each event in the final _common_clean file
| Quadrant A | 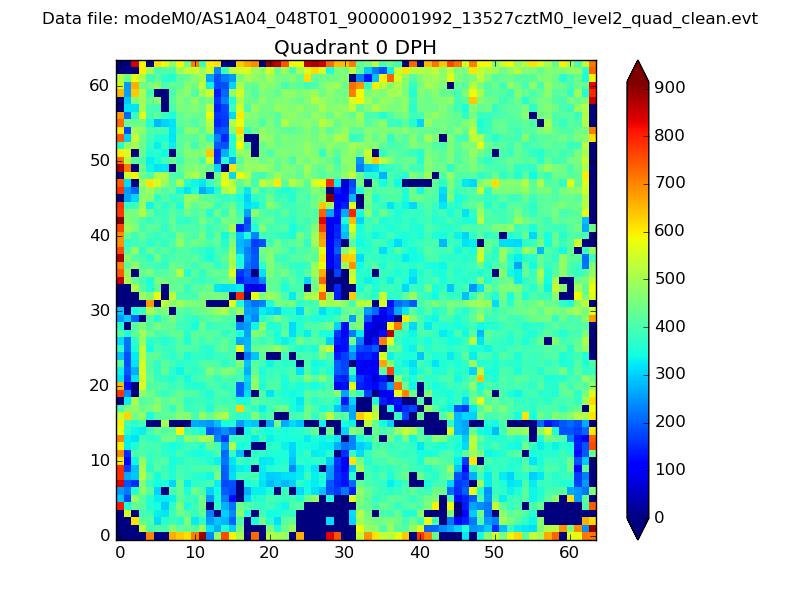 |
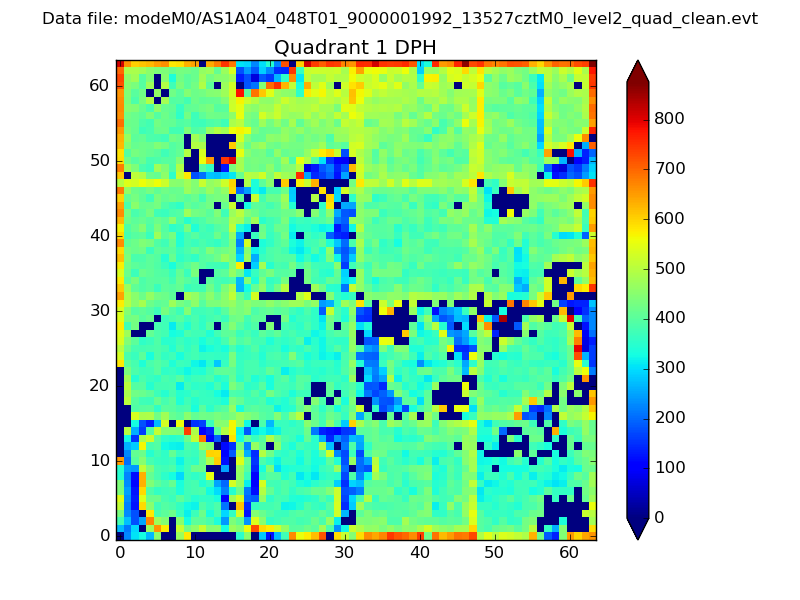 |
Quadrant B |
|---|---|---|---|
| Quadrant D | 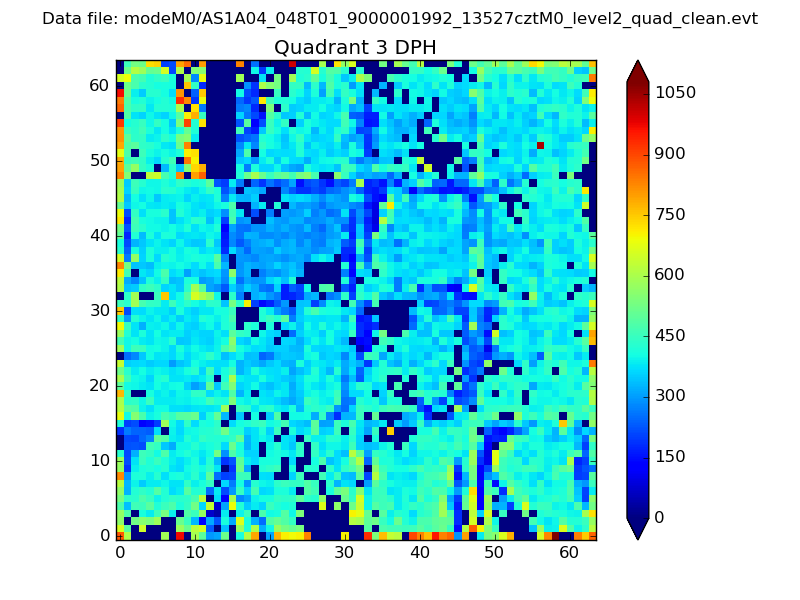 |
 |
Quadrant C |
| Plot type | Count rate plots | Images |
|---|---|---|
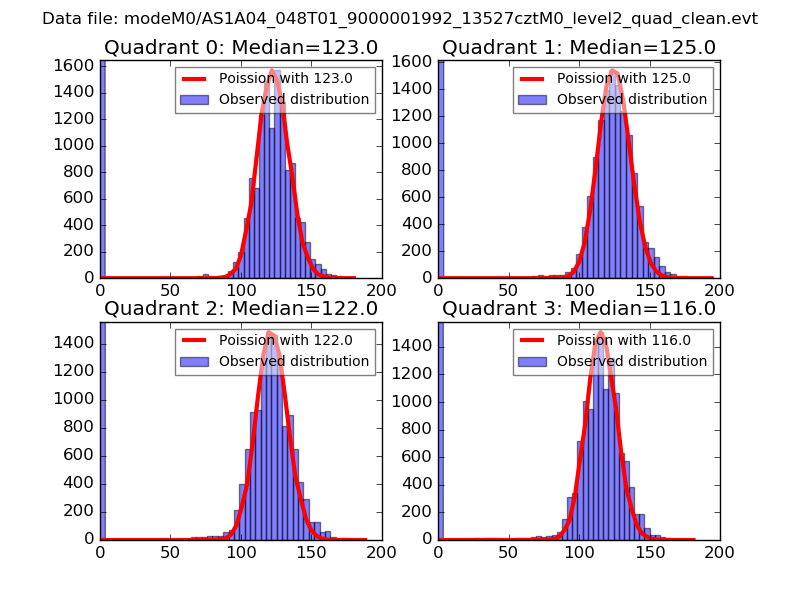
| Comparison with Poisson distribution Blue bars denote a histogram of data divided into 1 sec bins. Red curve is a Poisson curve with rate = median count rate of data. |
 |
 |
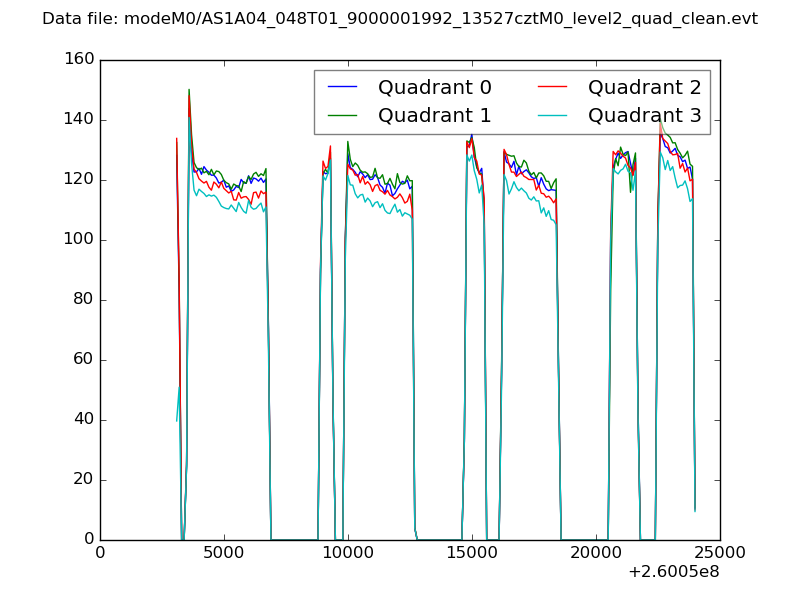
| Quadrant-wise count rates Data is divided into 100 sec bins |
 |
|
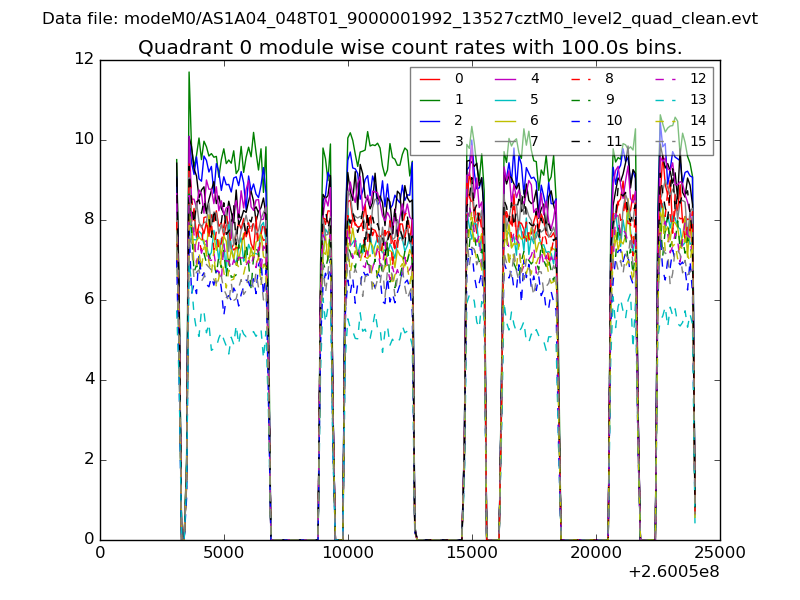
| Module-wise count rates for Quadrant A Data is divided into 100 sec bins |
 |
 |
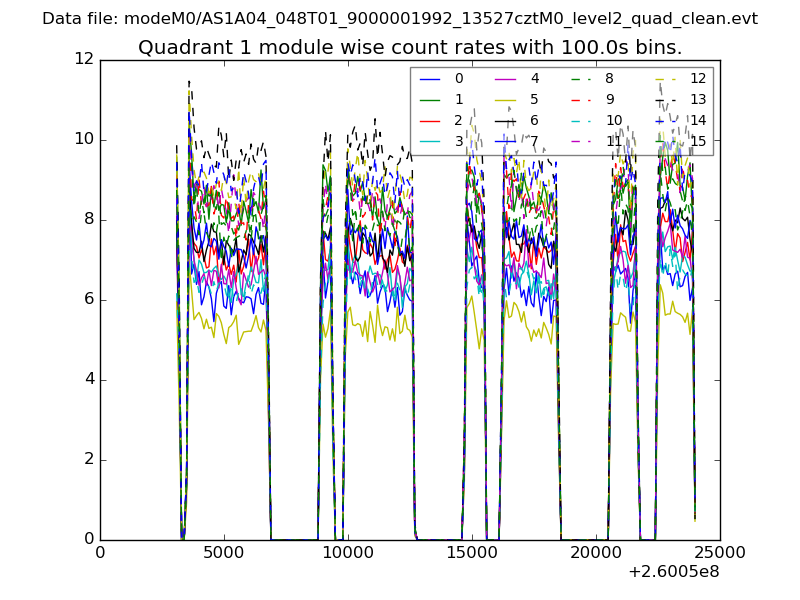
| Module-wise count rates for Quadrant B Data is divided into 100 sec bins |
 |
 |
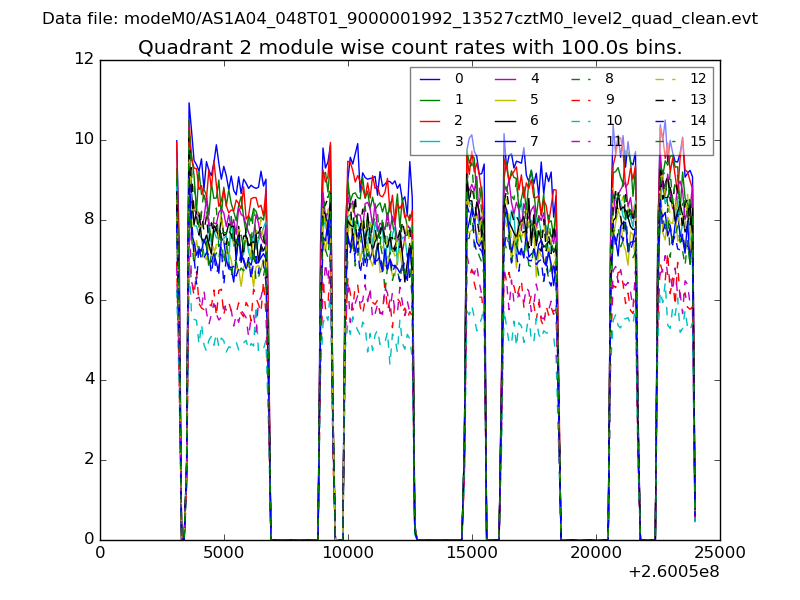
| Module-wise count rates for Quadrant C Data is divided into 100 sec bins |
 |
 |
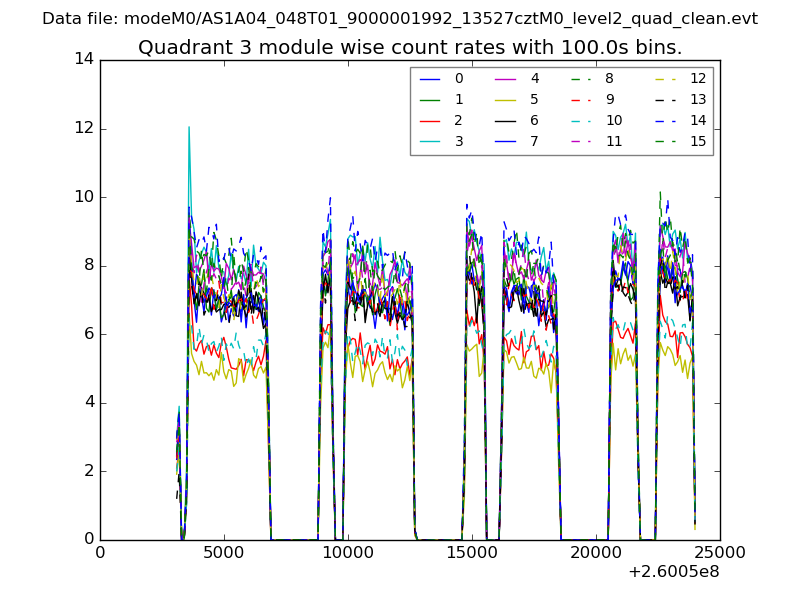
| Module-wise count rates for Quadrant D Data is divided into 100 sec bins |
 |
 |
| Parameter | Plot |
|---|---|
| CZT HV Monitor | 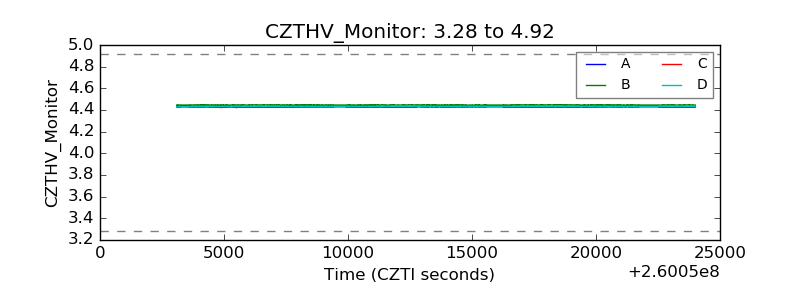 |
| D_VDD | 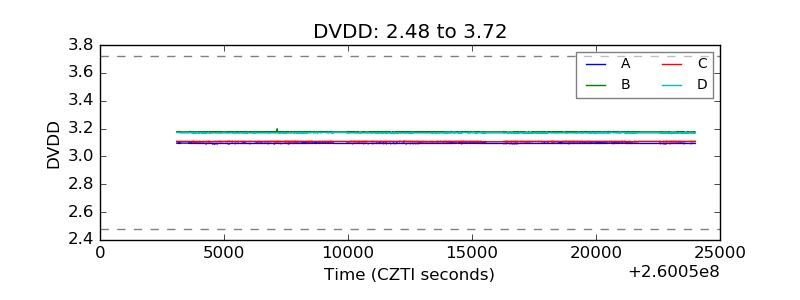 |
| Temperature 1 | 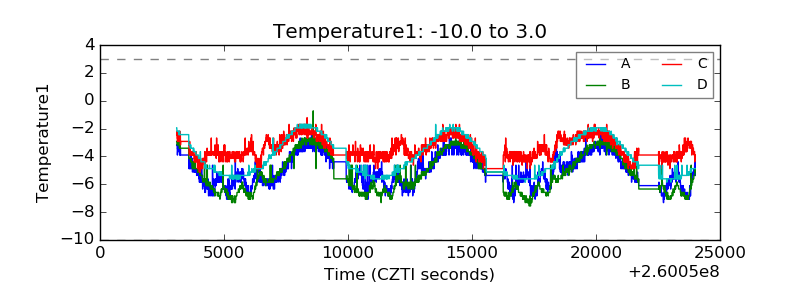 |
| Veto HV Monitor | 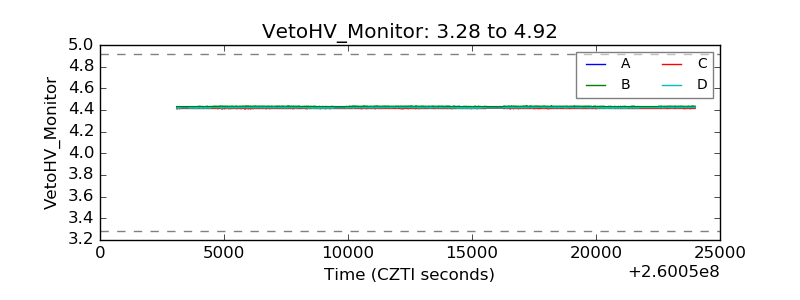 |
| Veto LLD | 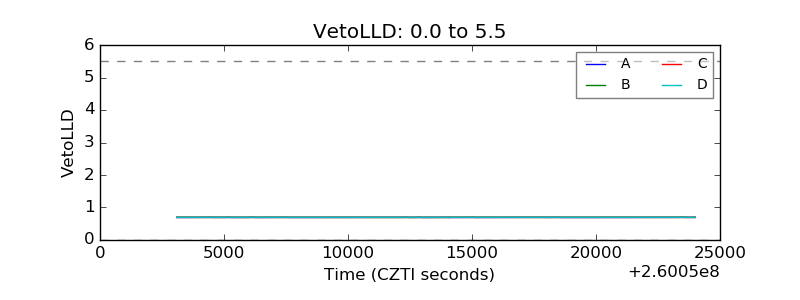 |
| Alpha Counter | 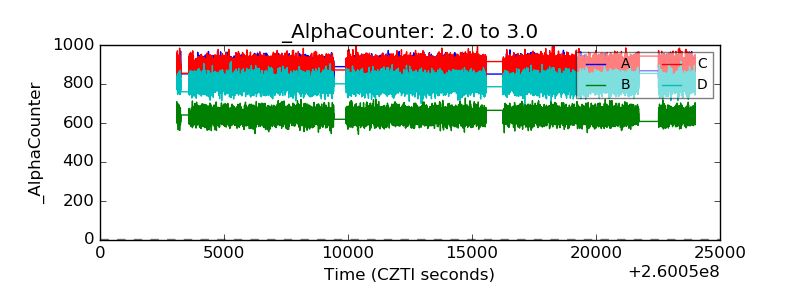 |
| _CPM_Rate | 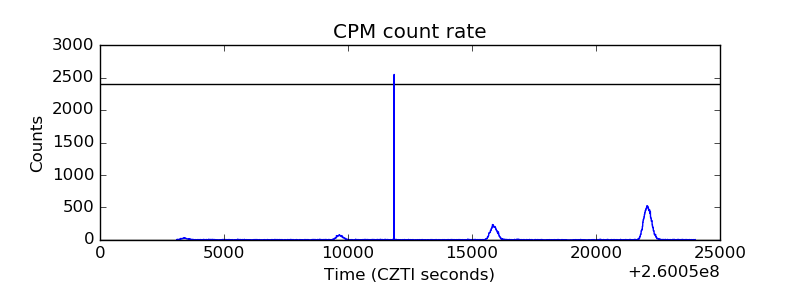 |
| CZT Counter | 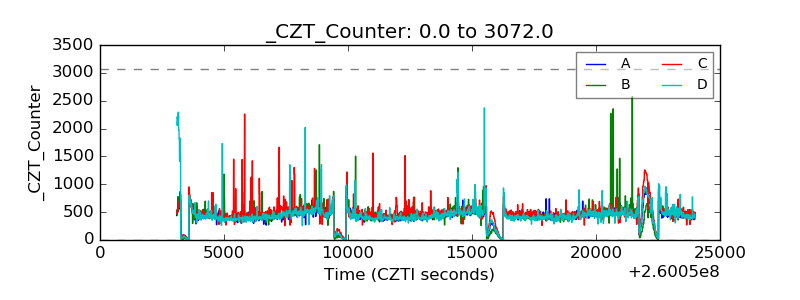 |
| +2.5 Volts monitor |  |
| +5 Volts monitor |  |
| _ROLL_ROT | 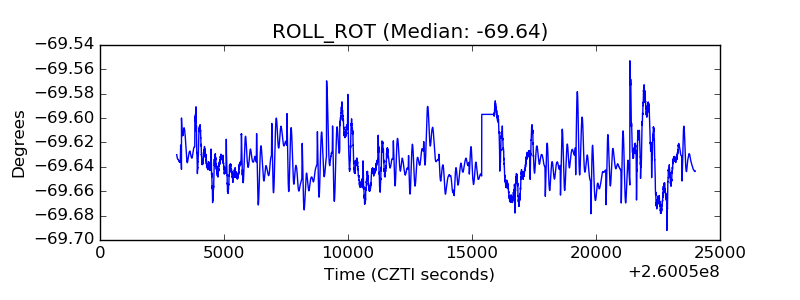 |
| _Roll_DEC | 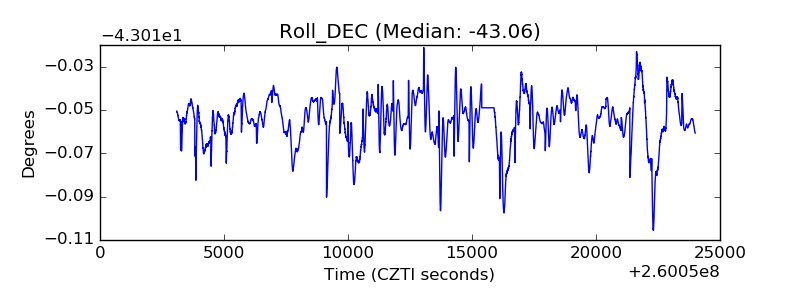 |
| _Roll_RA | 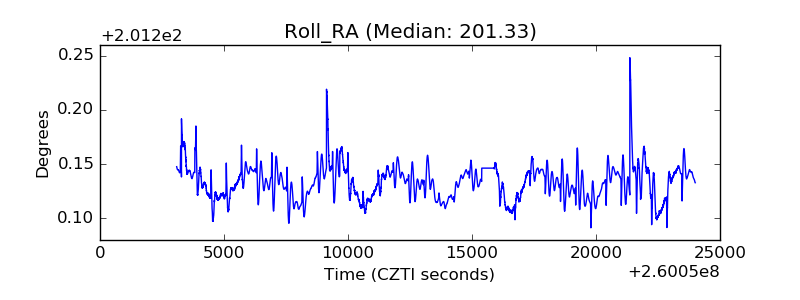 |
| Veto Counter | 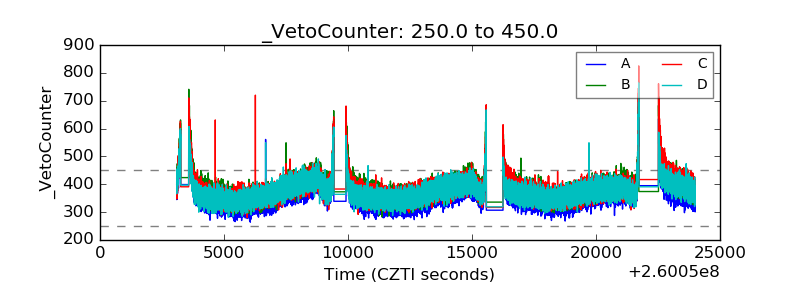 |