| Param | Original file | Final file |
|---|---|---|
| Filename | modeM0/AS1A04_048T01_9000001992_13528cztM0_level2.evt | modeM0/AS1A04_048T01_9000001992_13528cztM0_level2_quad_clean.evt |
| Size (bytes) | 443,436,480 | 94,700,160 |
| Size | 422.9 MB | 90.3 MB |
| Events in quadrant A | 3,113,851 | 605,779 |
| Events in quadrant B | 3,246,804 | 618,724 |
| Events in quadrant C | 3,425,931 | 603,380 |
| Events in quadrant D | 3,187,936 | 573,402 |
| Mode M0 | |||
|---|---|---|---|
| Quadrant | BADHDUFLAG | Total packets | Discarded packets |
| A | 0 | 13649 | 3 |
| B | 0 | 13877 | 2 |
| C | 0 | 14117 | 2 |
| D | 0 | 14051 | 2 |
| Mode M9 | |||
|---|---|---|---|
| Quadrant | BADHDUFLAG | Total packets | Discarded packets |
| A | 0 | 10 | 0 |
| B | 0 | 10 | 0 |
| C | 0 | 10 | 0 |
| D | 0 | 11 | 0 |
| Mode SS | |||
|---|---|---|---|
| Quadrant | BADHDUFLAG | Total packets | Discarded packets |
| A | 0 | 134 | 0 |
| B | 0 | 134 | 0 |
| C | 0 | 134 | 0 |
| D | 0 | 134 | 0 |
| Quadrant | Total seconds | Saturated seconds | Saturation percentage |
|---|---|---|---|
| A | 6700 | 21 | 0.313433% |
| B | 6700 | 42 | 0.626866% |
| C | 6700 | 39 | 0.582090% |
| D | 6700 | 23 | 0.343284% |
Noise dominated data is calculated using 1-second bins in cleaned event files. If a bin has >2000 counts, and if more than 50% of those come from <1% of pixels, then it is considered to be noise-dominated and hence unusable.
| Quadrant | # 1 sec bins | Bins with >0 counts | Bins with >2000 counts | High rate bins dominated by noise | Noise dominated (total time) | Noise dominated (detector-on time) | Marked lightcurve |
|---|---|---|---|---|---|---|---|
| A | 7666 | 6701 | 2 | 2 | 0.03% | 0.03% | 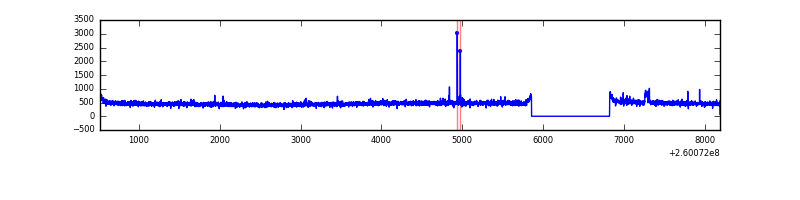 |
| B | 7666 | 6702 | 10 | 10 | 0.13% | 0.15% |  |
| C | 7666 | 6701 | 1 | 1 | 0.01% | 0.01% | 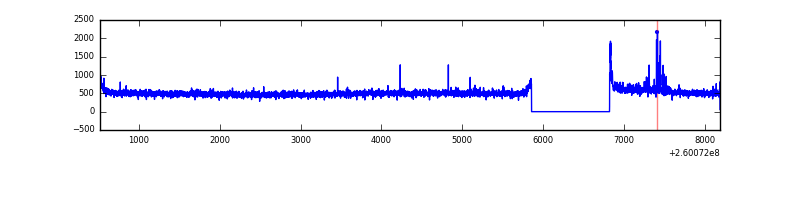 |
| D | 7666 | 6701 | 4 | 4 | 0.05% | 0.06% |  |
Top three noisy pixels from each quadrant. If the there are fewer than three noisy pixels in the level2.evt file, extra rows are filled as -1
| Pixel properties | Quadrant properties | ||||||
|---|---|---|---|---|---|---|---|
| Quadrant | DetID | PixID | Counts | Sigma | Mean | Median | Sigma |
| A | 11 | 29 | 17018 | 99.52 | 797 | 781 | 163.2 |
| A | 2 | 250 | 11197 | 63.84 | 797 | 781 | 163.2 |
| A | 4 | 2 | 10045 | 56.78 | 797 | 781 | 163.2 |
| B | 4 | 142 | 50895 | 329.01 | 802 | 781 | 152.3 |
| B | 12 | 111 | 18072 | 113.52 | 802 | 781 | 152.3 |
| B | 0 | 189 | 17144 | 107.43 | 802 | 781 | 152.3 |
| C | 3 | 233 | 354172 | 1948.38 | 787 | 790 | 181.4 |
| C | 13 | 61 | 5555 | 26.27 | 787 | 790 | 181.4 |
| C | 14 | 234 | 2400 | 8.88 | 787 | 790 | 181.4 |
| D | 12 | 110 | 130297 | 699.31 | 776 | 756 | 185.2 |
| D | 2 | 136 | 33379 | 176.11 | 776 | 756 | 185.2 |
| D | 13 | 122 | 28627 | 150.46 | 776 | 756 | 185.2 |
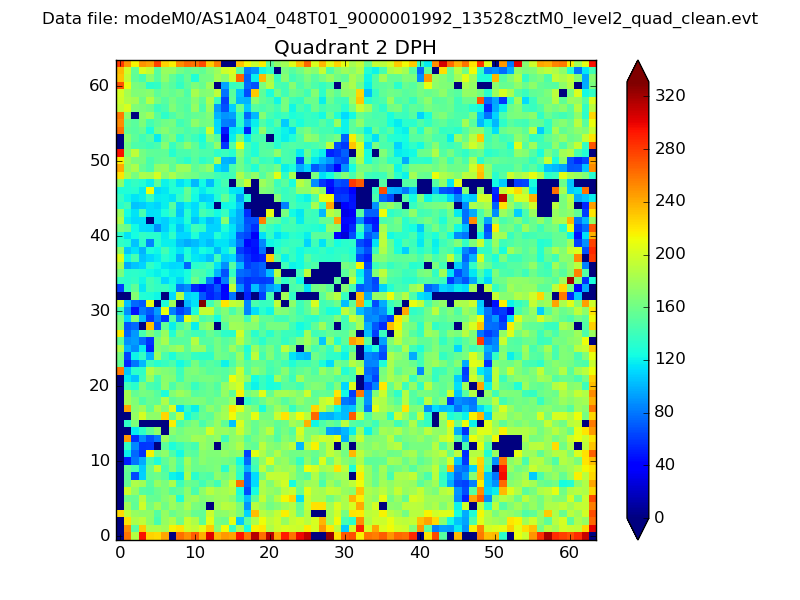
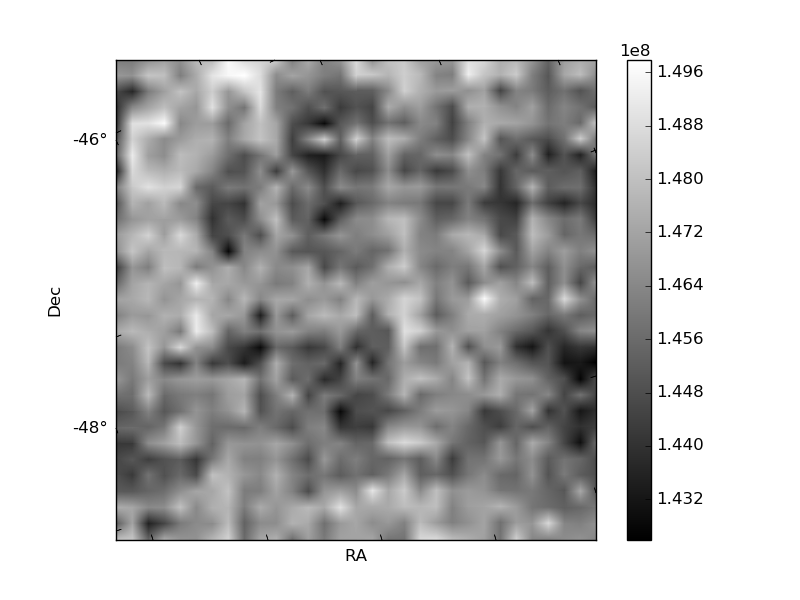
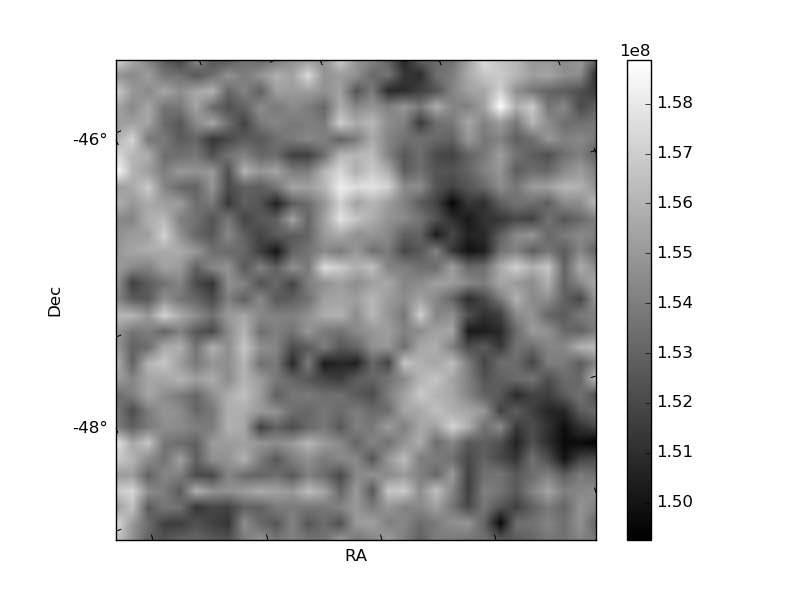
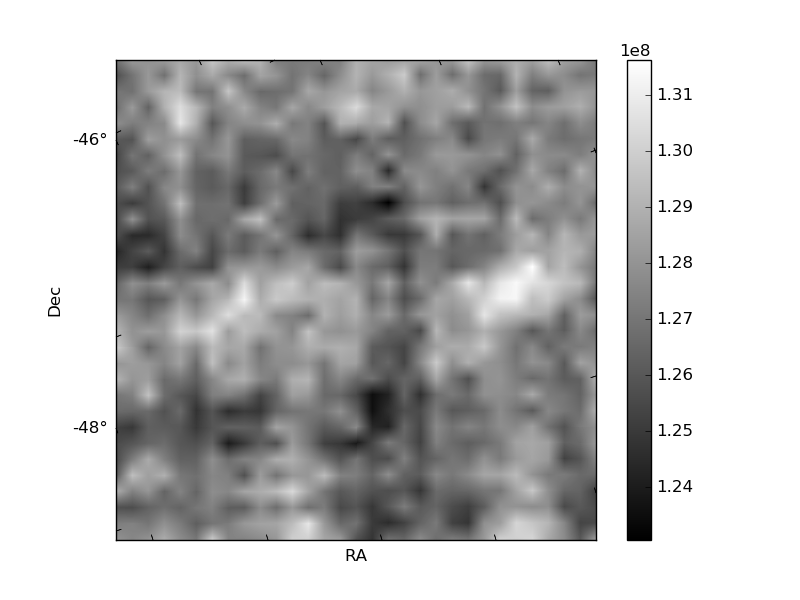
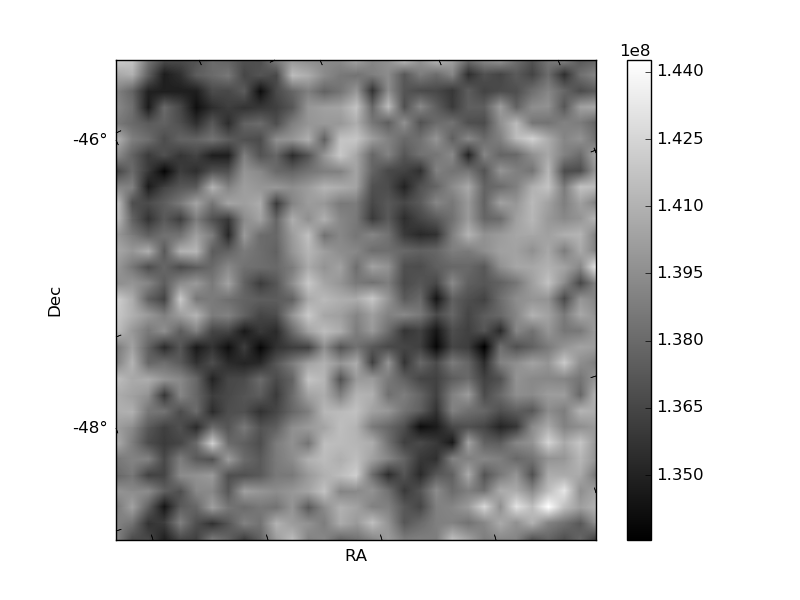
Histogram calculated using DETX and DETY for each event in the final _common_clean file
| Quadrant A | 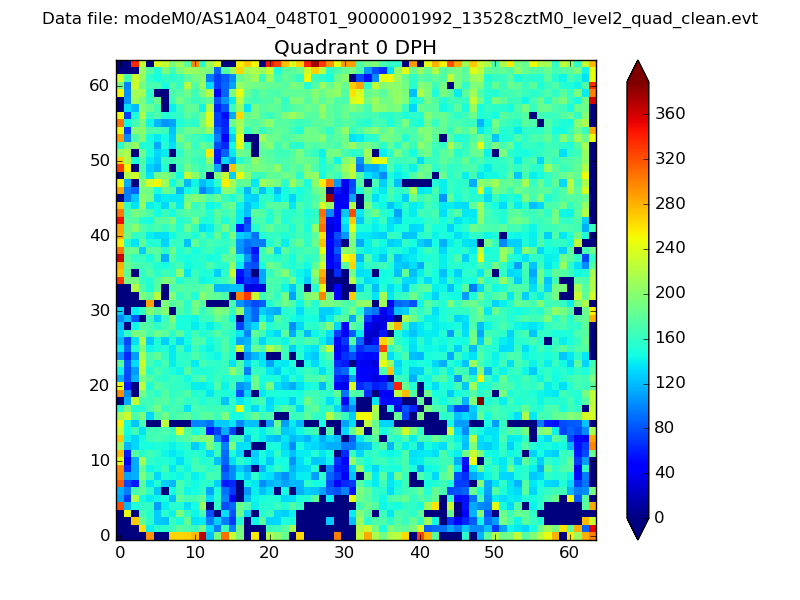 |
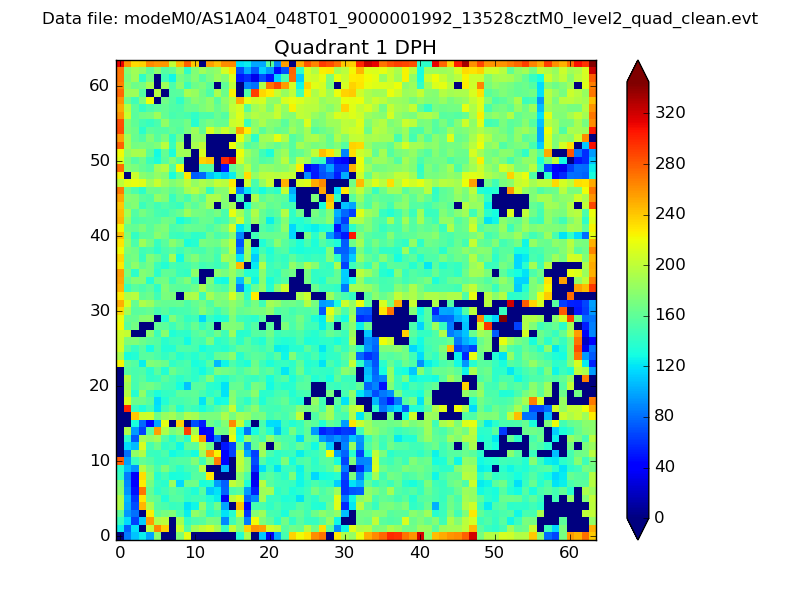 |
Quadrant B |
|---|---|---|---|
| Quadrant D | 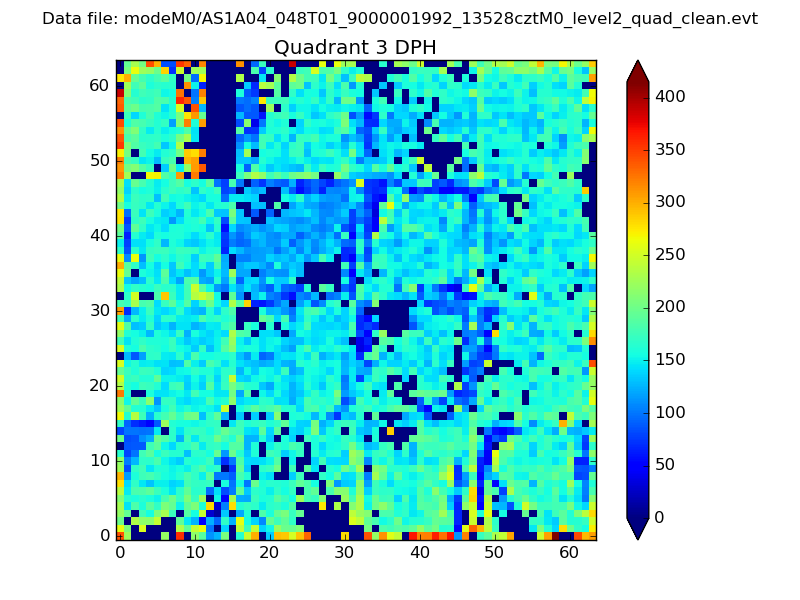 |
 |
Quadrant C |
| Plot type | Count rate plots | Images |
|---|---|---|
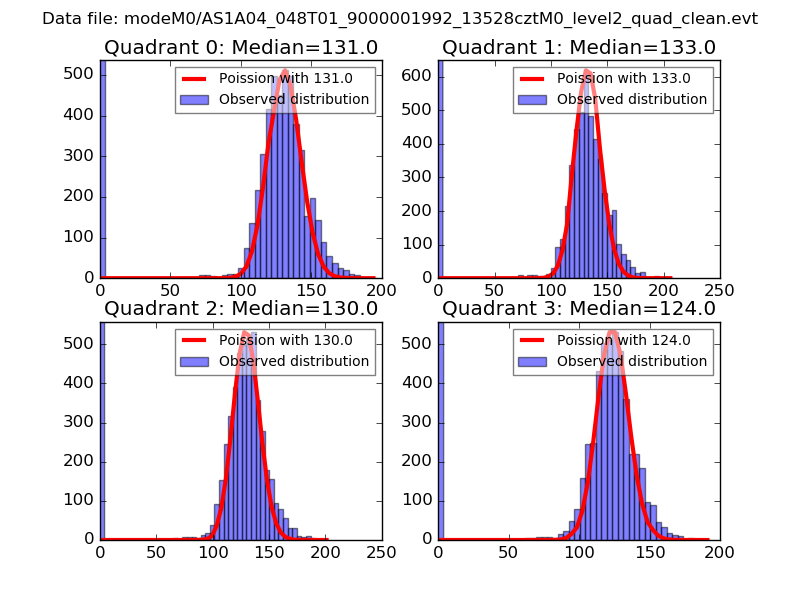
| Comparison with Poisson distribution Blue bars denote a histogram of data divided into 1 sec bins. Red curve is a Poisson curve with rate = median count rate of data. |
 |
 |
| Quadrant-wise count rates Data is divided into 100 sec bins |
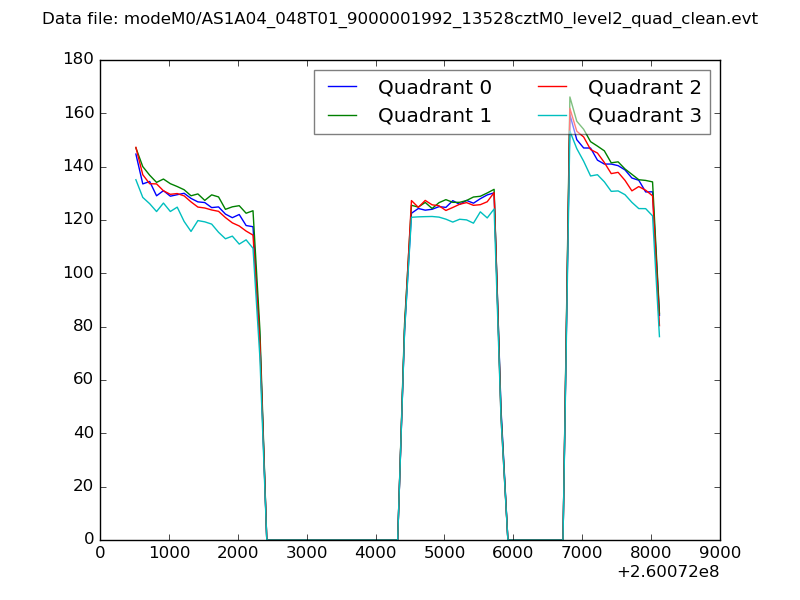 |
|
| Module-wise count rates for Quadrant A Data is divided into 100 sec bins |
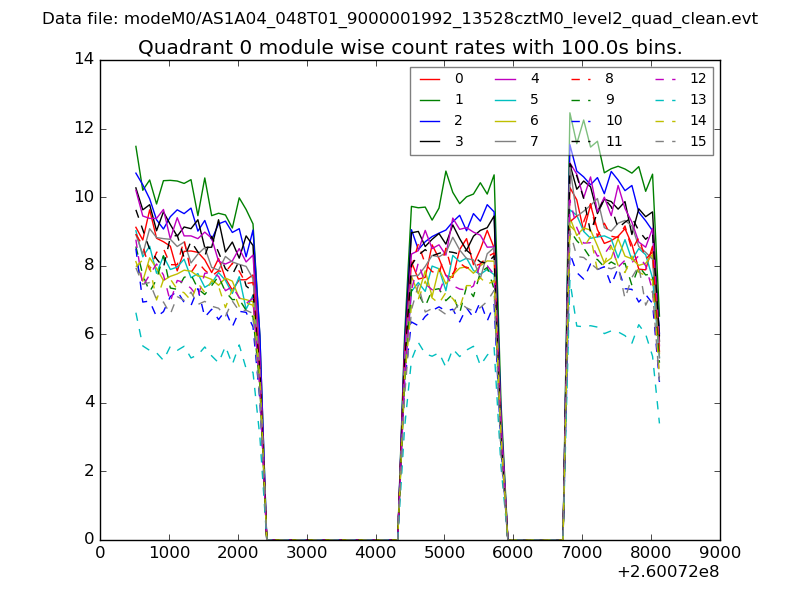 |
 |
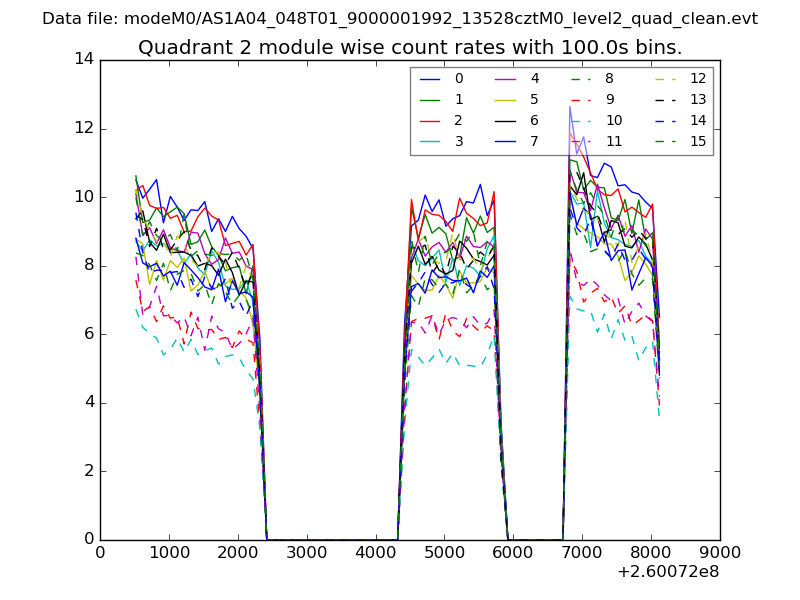
| Module-wise count rates for Quadrant B Data is divided into 100 sec bins |
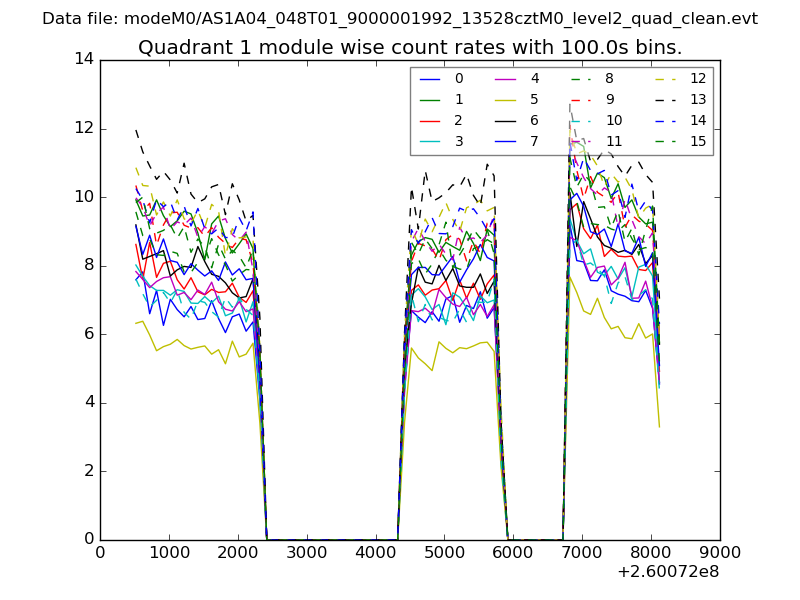 |
 |
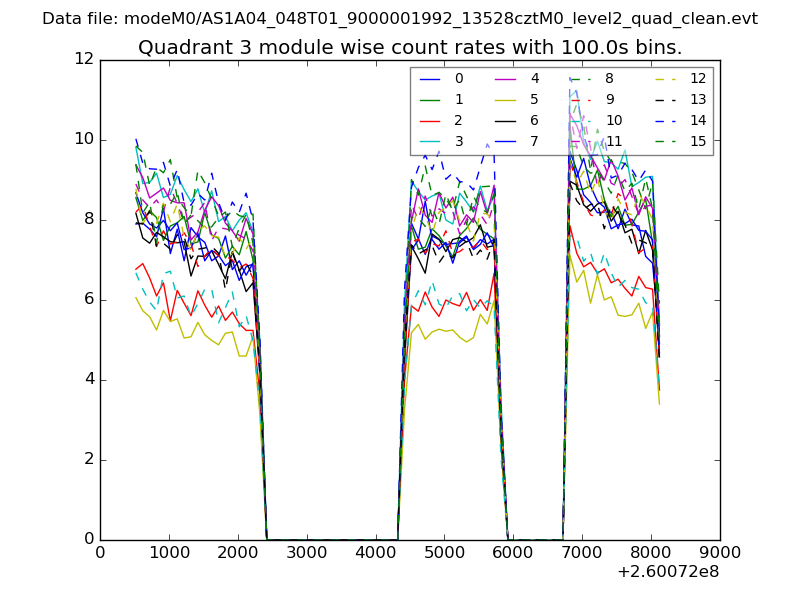
| Module-wise count rates for Quadrant C Data is divided into 100 sec bins |
 |
 |
| Module-wise count rates for Quadrant D Data is divided into 100 sec bins |
 |
 |
| Parameter | Plot |
|---|---|
| CZT HV Monitor | 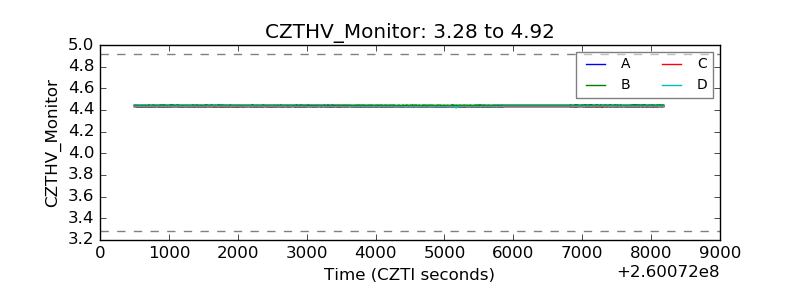 |
| D_VDD | 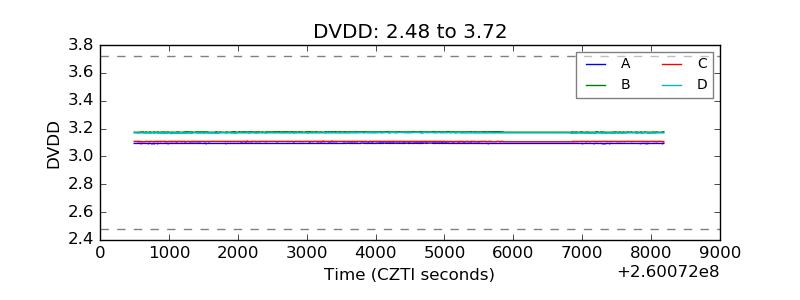 |
| Temperature 1 | 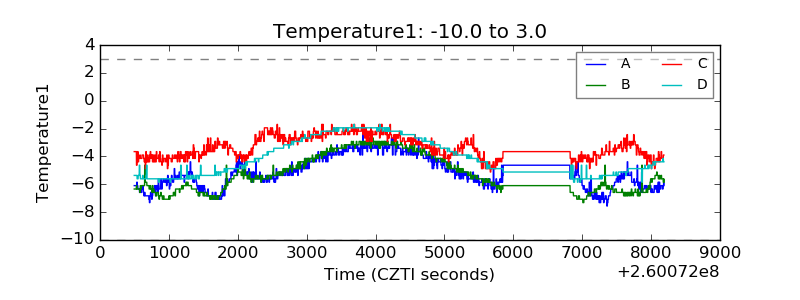 |
| Veto HV Monitor | 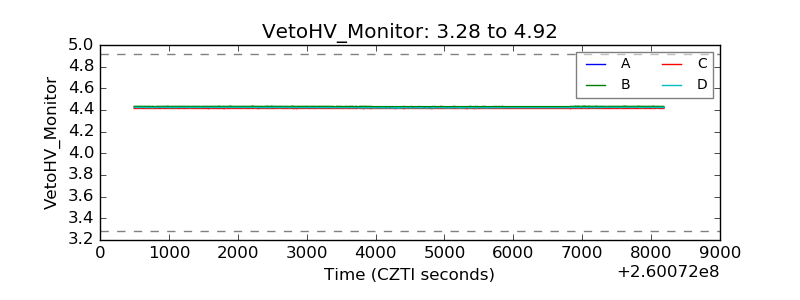 |
| Veto LLD | 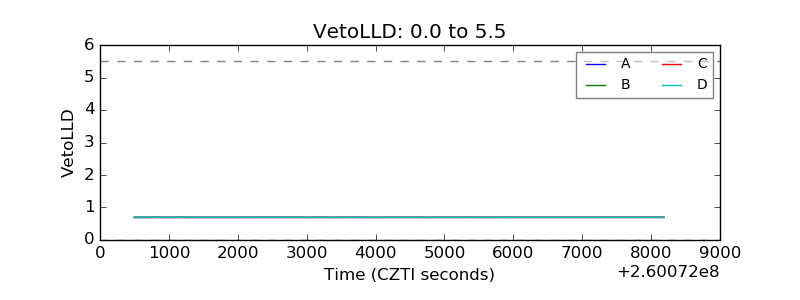 |
| Alpha Counter | 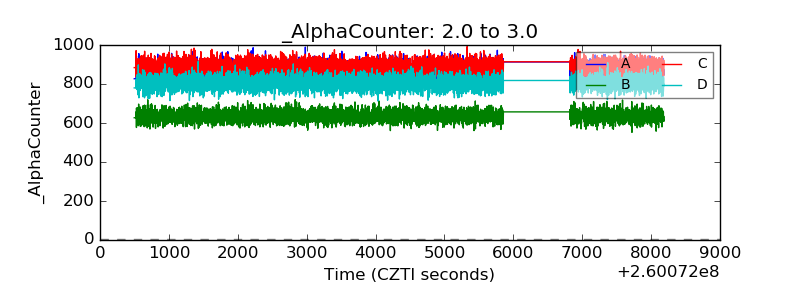 |
| _CPM_Rate | 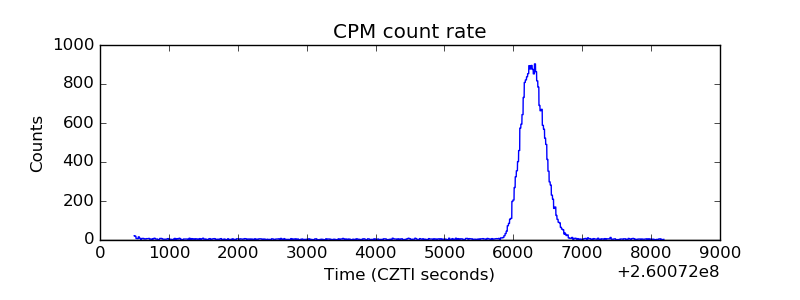 |
| CZT Counter | 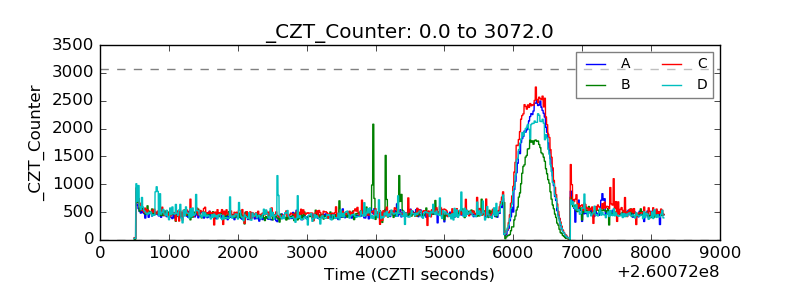 |
| +2.5 Volts monitor |  |
| +5 Volts monitor |  |
| _ROLL_ROT | 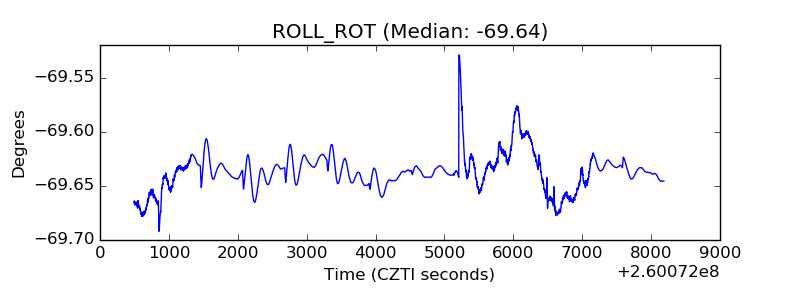 |
| _Roll_DEC | 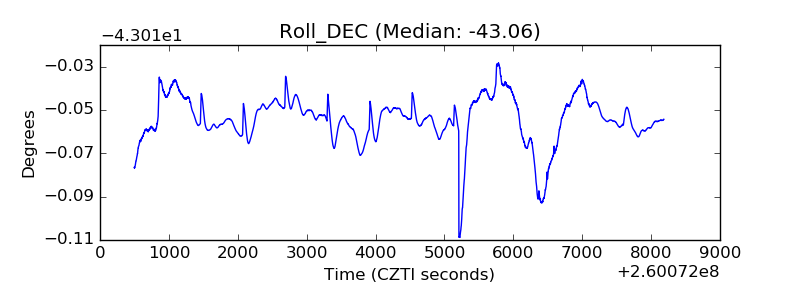 |
| _Roll_RA | 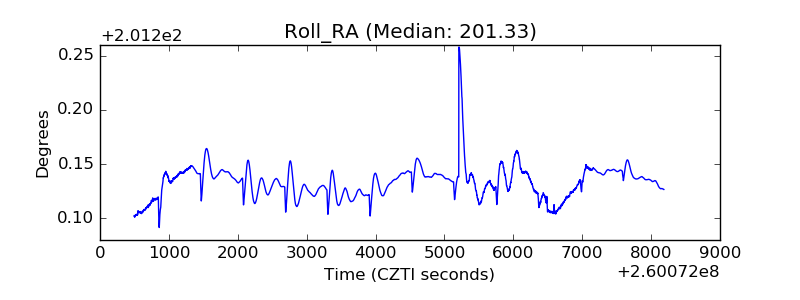 |
| Veto Counter | 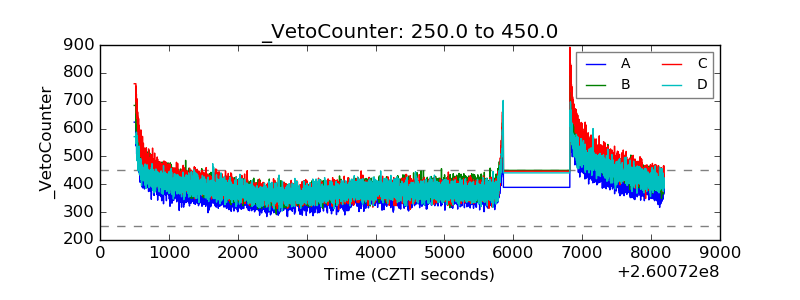 |