| Param | Original file | Final file |
|---|---|---|
| Filename | modeM0/AS1A04_048T01_9000001992_13530cztM0_level2.evt | modeM0/AS1A04_048T01_9000001992_13530cztM0_level2_quad_clean.evt |
| Size (bytes) | 440,464,320 | 90,158,400 |
| Size | 420.1 MB | 86.0 MB |
| Events in quadrant A | 3,108,909 | 574,539 |
| Events in quadrant B | 3,214,533 | 587,851 |
| Events in quadrant C | 3,383,479 | 573,716 |
| Events in quadrant D | 3,193,333 | 543,568 |
| Mode M0 | |||
|---|---|---|---|
| Quadrant | BADHDUFLAG | Total packets | Discarded packets |
| A | 0 | 13347 | 3 |
| B | 0 | 13546 | 2 |
| C | 0 | 14054 | 2 |
| D | 0 | 13837 | 2 |
| Mode M9 | |||
|---|---|---|---|
| Quadrant | BADHDUFLAG | Total packets | Discarded packets |
| A | 0 | 15 | 0 |
| B | 0 | 15 | 0 |
| C | 0 | 15 | 0 |
| D | 0 | 16 | 0 |
| Mode SS | |||
|---|---|---|---|
| Quadrant | BADHDUFLAG | Total packets | Discarded packets |
| A | 0 | 132 | 0 |
| B | 0 | 132 | 0 |
| C | 0 | 132 | 0 |
| D | 0 | 132 | 0 |
| Quadrant | Total seconds | Saturated seconds | Saturation percentage |
|---|---|---|---|
| A | 6457 | 47 | 0.727892% |
| B | 6457 | 75 | 1.161530% |
| C | 6457 | 71 | 1.099582% |
| D | 6457 | 80 | 1.238965% |
Noise dominated data is calculated using 1-second bins in cleaned event files. If a bin has >2000 counts, and if more than 50% of those come from <1% of pixels, then it is considered to be noise-dominated and hence unusable.
| Quadrant | # 1 sec bins | Bins with >0 counts | Bins with >2000 counts | High rate bins dominated by noise | Noise dominated (total time) | Noise dominated (detector-on time) | Marked lightcurve |
|---|---|---|---|---|---|---|---|
| A | 7528 | 6458 | 0 | 0 | 0.00% | 0.00% |  |
| B | 7528 | 6458 | 16 | 16 | 0.21% | 0.25% |  |
| C | 7528 | 6458 | 1 | 1 | 0.01% | 0.02% | 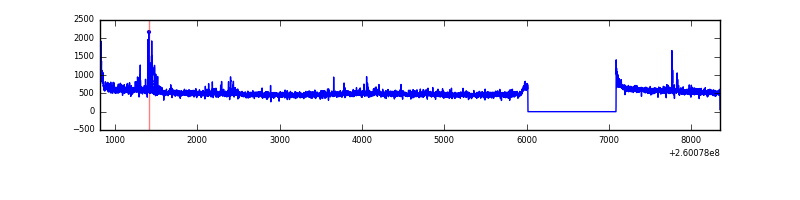 |
| D | 7528 | 6458 | 34 | 34 | 0.45% | 0.53% | 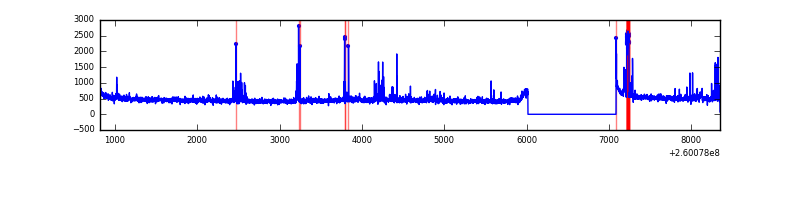 |
Top three noisy pixels from each quadrant. If the there are fewer than three noisy pixels in the level2.evt file, extra rows are filled as -1
| Pixel properties | Quadrant properties | ||||||
|---|---|---|---|---|---|---|---|
| Quadrant | DetID | PixID | Counts | Sigma | Mean | Median | Sigma |
| A | 11 | 29 | 17112 | 100.74 | 798 | 780 | 162.1 |
| A | 2 | 250 | 11791 | 67.92 | 798 | 780 | 162.1 |
| A | 1 | 162 | 10812 | 61.88 | 798 | 780 | 162.1 |
| B | 3 | 64 | 61625 | 404.38 | 797 | 777 | 150.5 |
| B | 0 | 230 | 21004 | 134.42 | 797 | 777 | 150.5 |
| B | 12 | 111 | 17604 | 111.83 | 797 | 777 | 150.5 |
| C | 3 | 233 | 294155 | 1612.36 | 789 | 794 | 181.9 |
| C | 7 | 238 | 11762 | 60.28 | 789 | 794 | 181.9 |
| C | 13 | 61 | 5580 | 26.3 | 789 | 794 | 181.9 |
| D | 2 | 225 | 101615 | 546.84 | 775 | 755 | 184.4 |
| D | 2 | 136 | 54760 | 292.8 | 775 | 755 | 184.4 |
| D | 13 | 122 | 33426 | 177.13 | 775 | 755 | 184.4 |
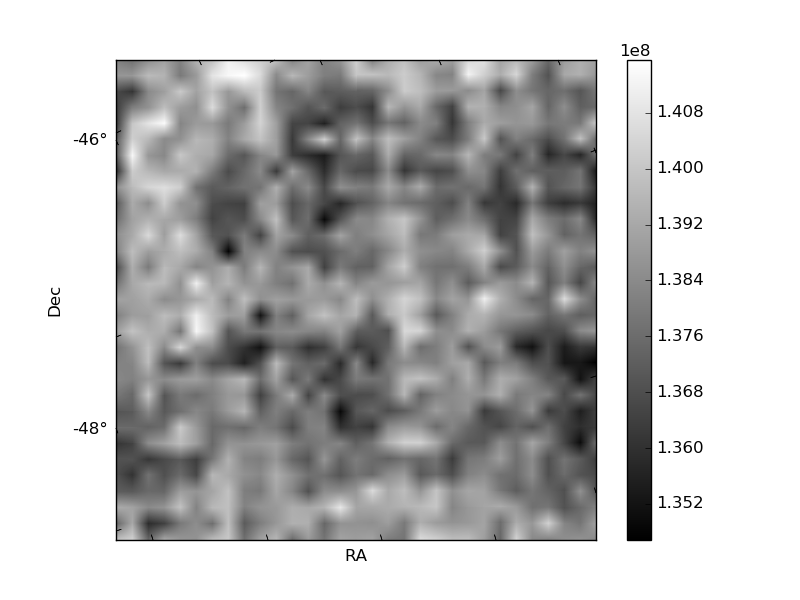
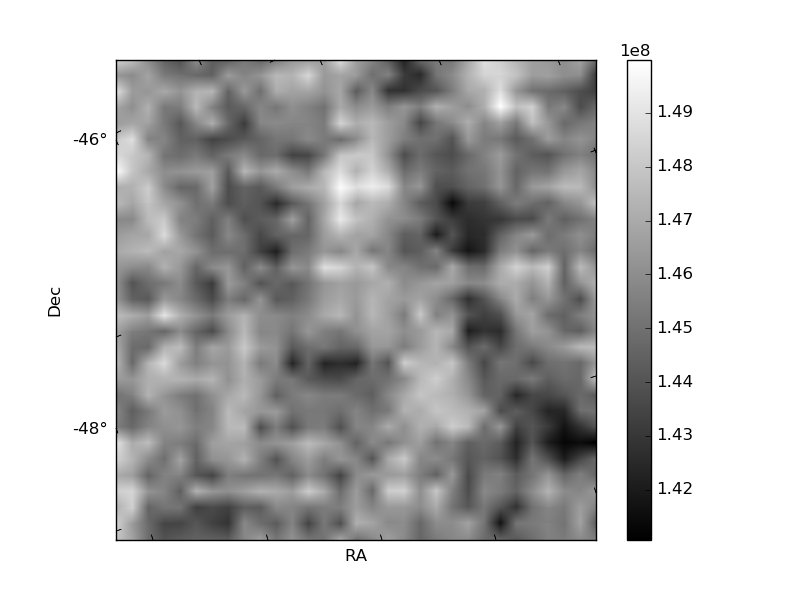
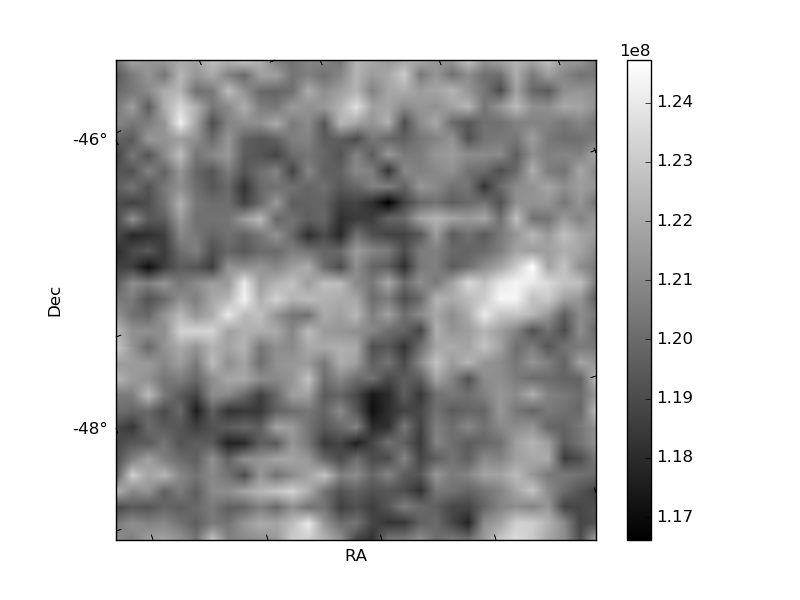
Histogram calculated using DETX and DETY for each event in the final _common_clean file
| Quadrant A | 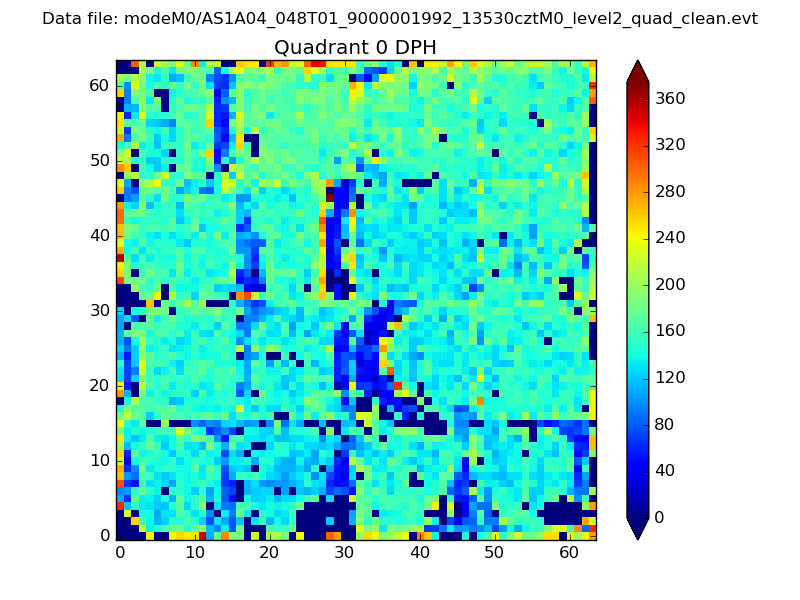 |
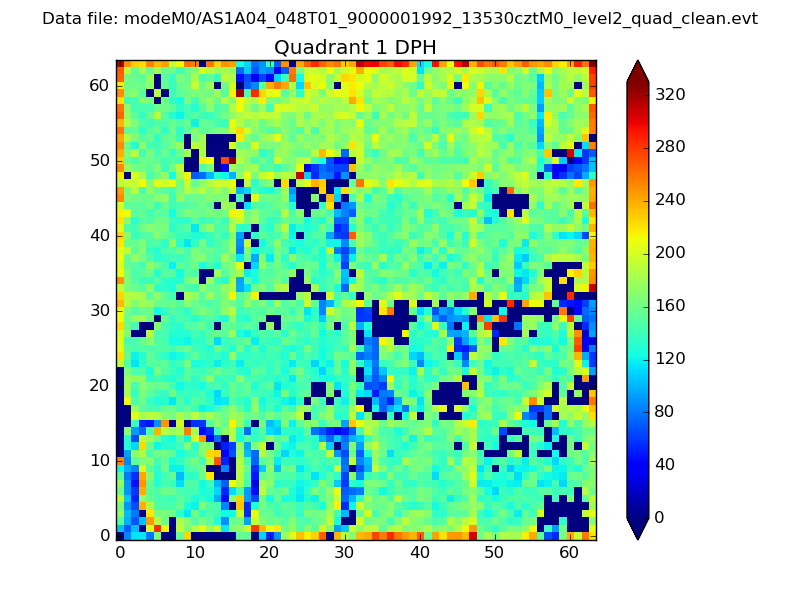 |
Quadrant B |
|---|---|---|---|
| Quadrant D |  |
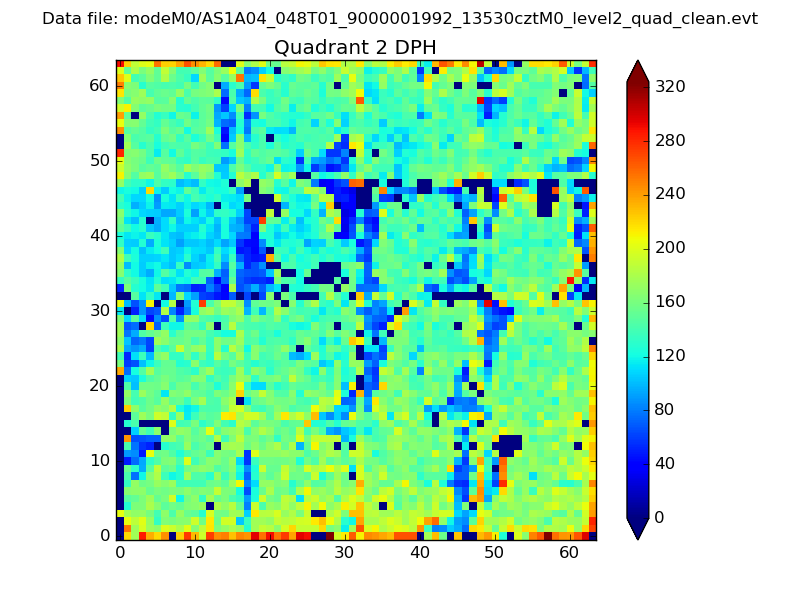 |
Quadrant C |
| Plot type | Count rate plots | Images |
|---|---|---|
| Comparison with Poisson distribution Blue bars denote a histogram of data divided into 1 sec bins. Red curve is a Poisson curve with rate = median count rate of data. |
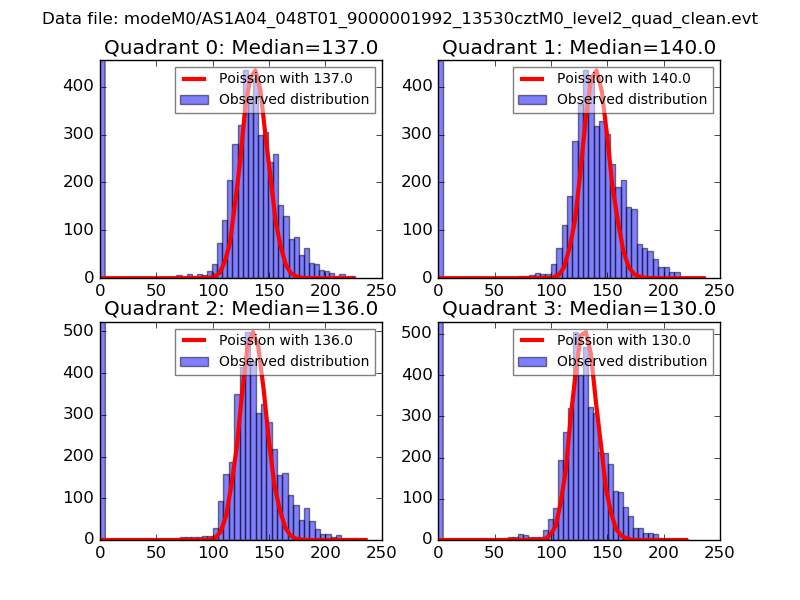 |
 |
| Quadrant-wise count rates Data is divided into 100 sec bins |
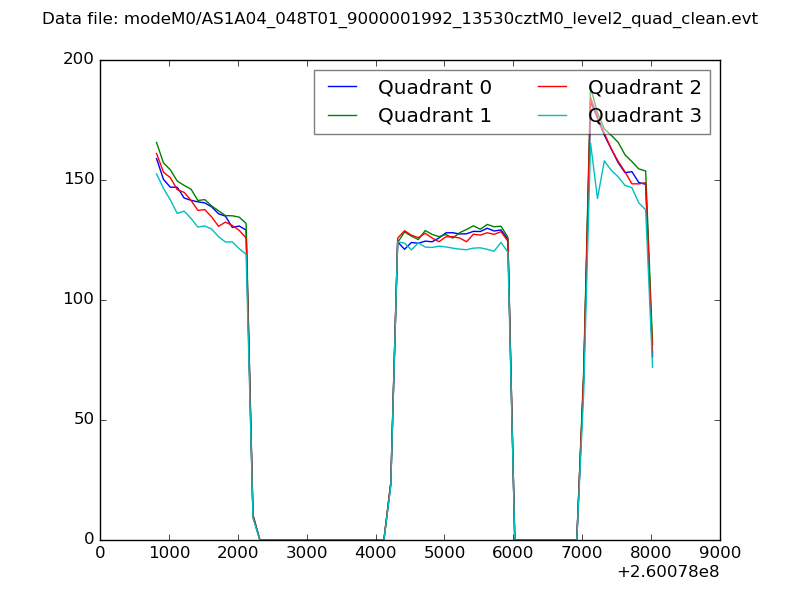 |
|
| Module-wise count rates for Quadrant A Data is divided into 100 sec bins |
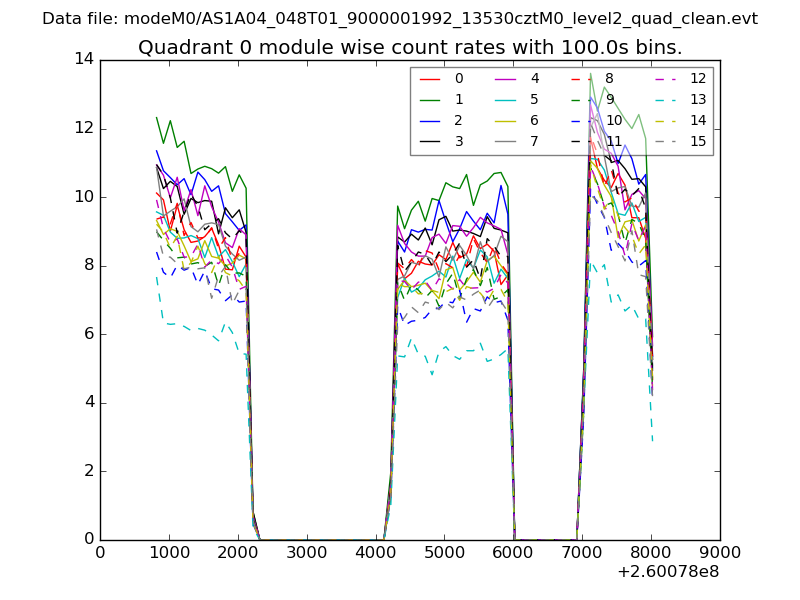 |
 |
| Module-wise count rates for Quadrant B Data is divided into 100 sec bins |
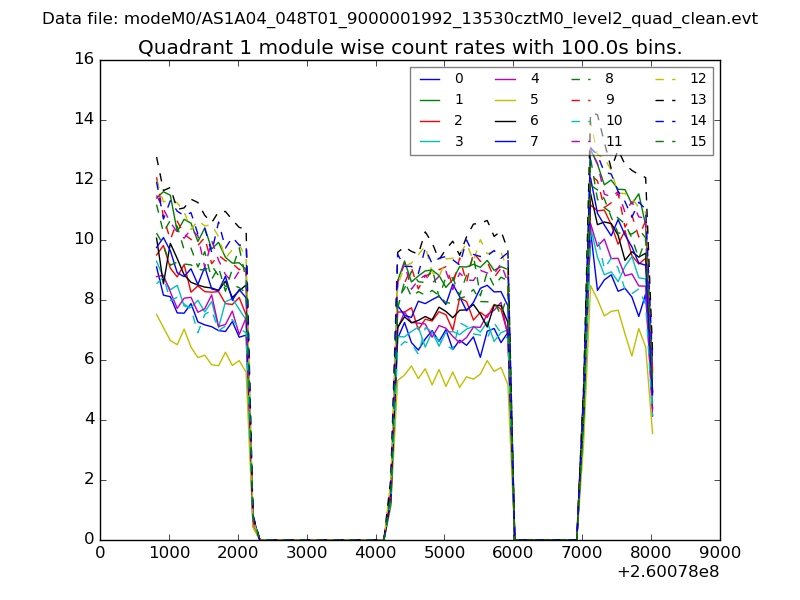 |
 |
| Module-wise count rates for Quadrant C Data is divided into 100 sec bins |
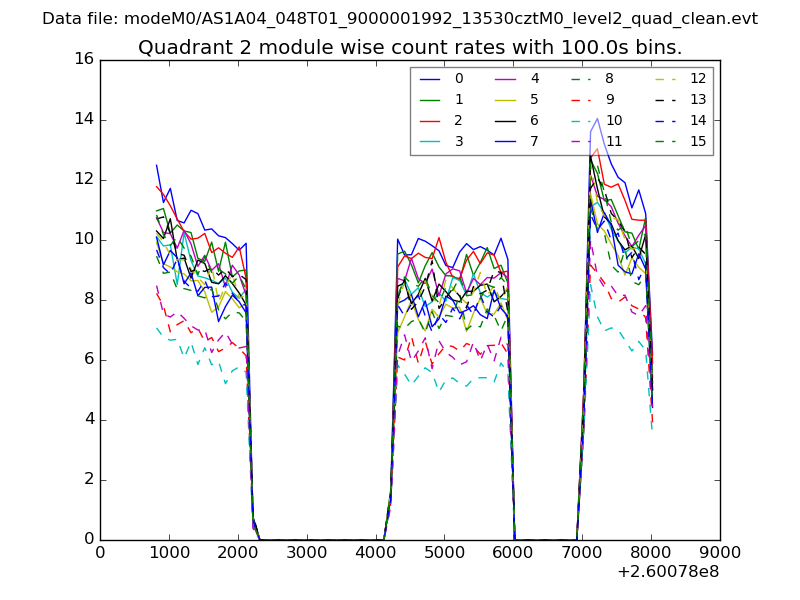 |
 |
| Module-wise count rates for Quadrant D Data is divided into 100 sec bins |
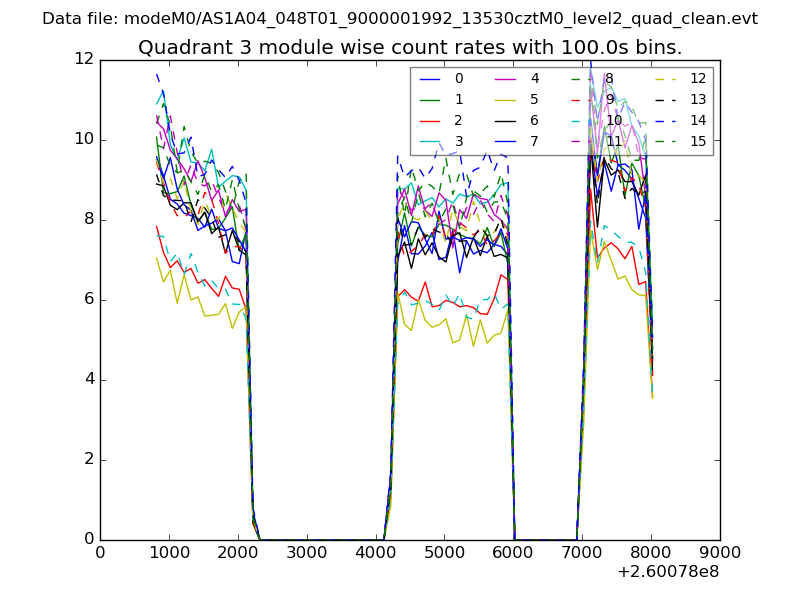 |
 |
| Parameter | Plot |
|---|---|
| CZT HV Monitor | 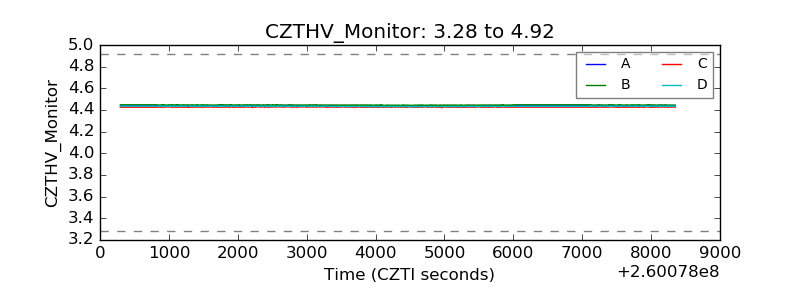 |
| D_VDD | 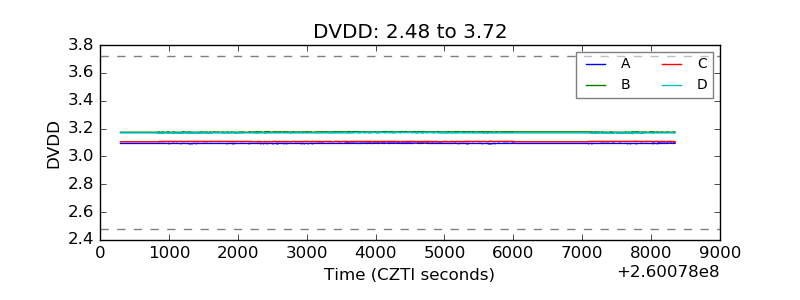 |
| Temperature 1 | 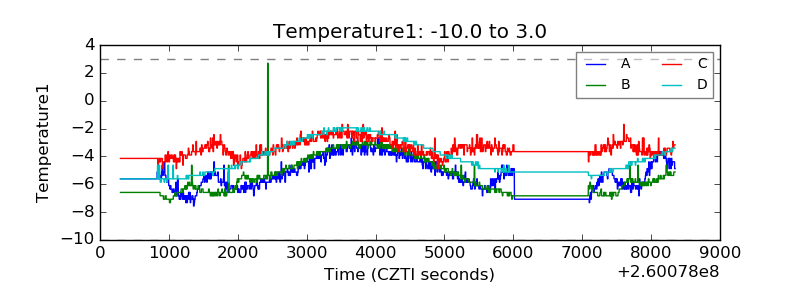 |
| Veto HV Monitor | 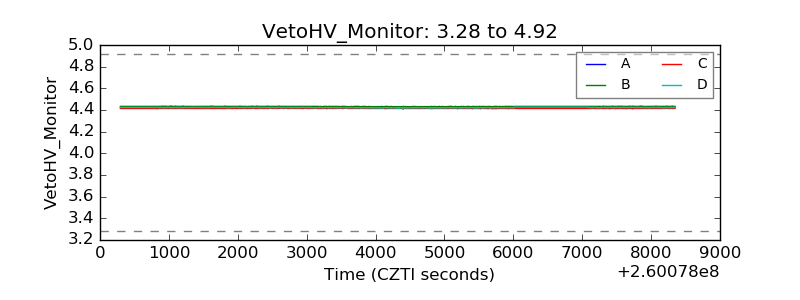 |
| Veto LLD | 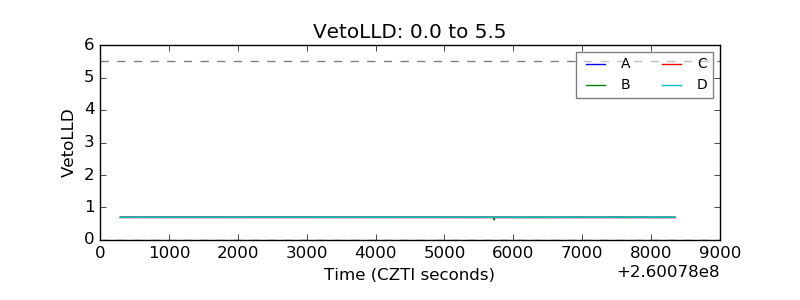 |
| Alpha Counter | 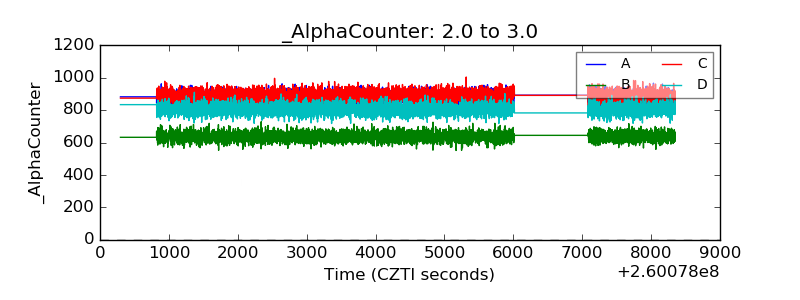 |
| _CPM_Rate | 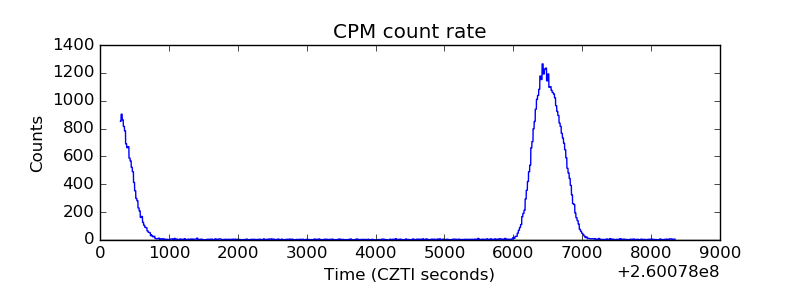 |
| CZT Counter | 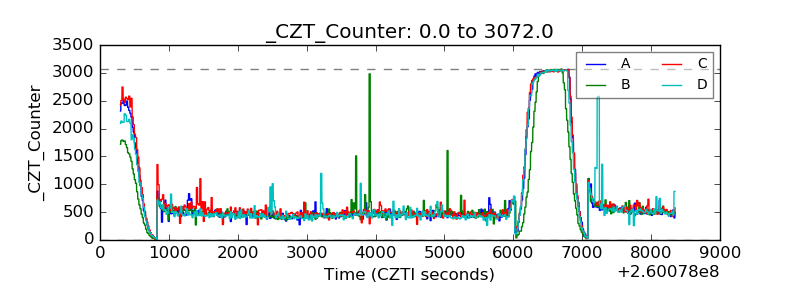 |
| +2.5 Volts monitor |  |
| +5 Volts monitor |  |
| _ROLL_ROT | 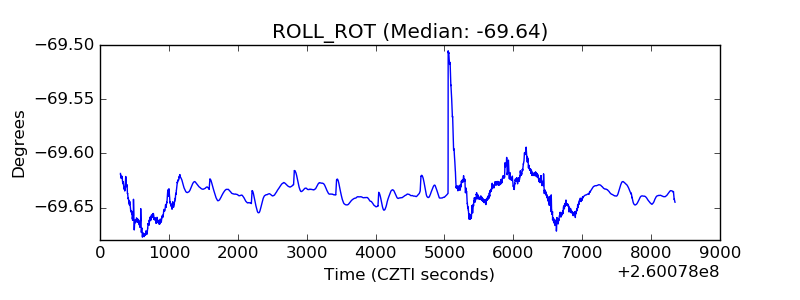 |
| _Roll_DEC | 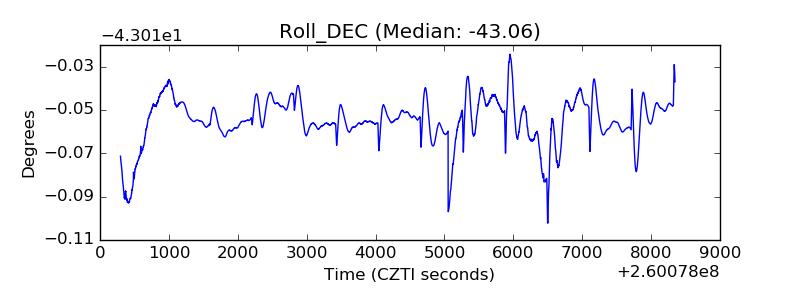 |
| _Roll_RA | 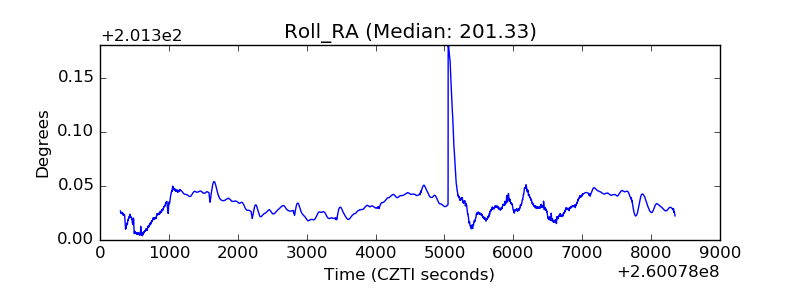 |
| Veto Counter | 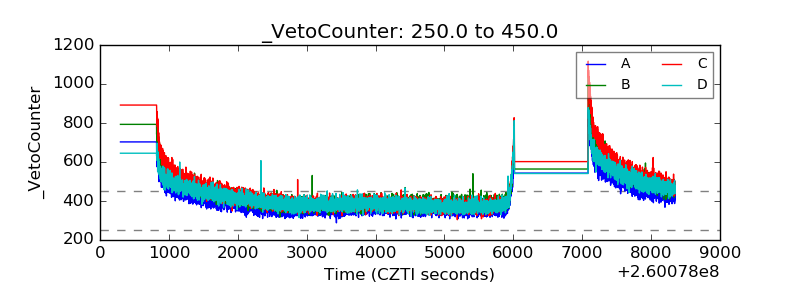 |