| Param | Original file | Final file |
|---|---|---|
| Filename | modeM0/AS1A04_048T01_9000001992_13531cztM0_level2.evt | modeM0/AS1A04_048T01_9000001992_13531cztM0_level2_quad_clean.evt |
| Size (bytes) | 456,851,520 | 77,198,400 |
| Size | 435.7 MB | 73.6 MB |
| Events in quadrant A | 3,043,390 | 479,676 |
| Events in quadrant B | 3,248,788 | 490,831 |
| Events in quadrant C | 3,248,249 | 481,225 |
| Events in quadrant D | 3,879,089 | 457,778 |
| Mode M0 | |||
|---|---|---|---|
| Quadrant | BADHDUFLAG | Total packets | Discarded packets |
| A | 0 | 12817 | 2 |
| B | 0 | 13398 | 1 |
| C | 0 | 13398 | 1 |
| D | 0 | 15491 | 1 |
| Mode M9 | |||
|---|---|---|---|
| Quadrant | BADHDUFLAG | Total packets | Discarded packets |
| A | 0 | 12 | 0 |
| B | 0 | 12 | 0 |
| C | 0 | 12 | 0 |
| D | 0 | 12 | 0 |
| Mode SS | |||
|---|---|---|---|
| Quadrant | BADHDUFLAG | Total packets | Discarded packets |
| A | 0 | 124 | 0 |
| B | 0 | 124 | 0 |
| C | 0 | 124 | 0 |
| D | 0 | 124 | 0 |
| Quadrant | Total seconds | Saturated seconds | Saturation percentage |
|---|---|---|---|
| A | 6132 | 69 | 1.125245% |
| B | 6132 | 101 | 1.647097% |
| C | 6132 | 68 | 1.108937% |
| D | 6132 | 202 | 3.294194% |
Noise dominated data is calculated using 1-second bins in cleaned event files. If a bin has >2000 counts, and if more than 50% of those come from <1% of pixels, then it is considered to be noise-dominated and hence unusable.
| Quadrant | # 1 sec bins | Bins with >0 counts | Bins with >2000 counts | High rate bins dominated by noise | Noise dominated (total time) | Noise dominated (detector-on time) | Marked lightcurve |
|---|---|---|---|---|---|---|---|
| A | 7298 | 6133 | 0 | 0 | 0.00% | 0.00% | 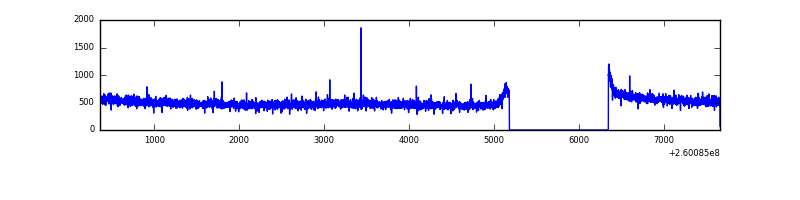 |
| B | 7298 | 6133 | 27 | 27 | 0.37% | 0.44% |  |
| C | 7298 | 6133 | 0 | 0 | 0.00% | 0.00% |  |
| D | 7298 | 6133 | 69 | 69 | 0.95% | 1.13% |  |
Top three noisy pixels from each quadrant. If the there are fewer than three noisy pixels in the level2.evt file, extra rows are filled as -1
| Pixel properties | Quadrant properties | ||||||
|---|---|---|---|---|---|---|---|
| Quadrant | DetID | PixID | Counts | Sigma | Mean | Median | Sigma |
| A | 2 | 250 | 15213 | 91.37 | 784 | 769 | 158.1 |
| A | 1 | 162 | 13473 | 80.36 | 784 | 769 | 158.1 |
| A | 0 | 226 | 6967 | 39.21 | 784 | 769 | 158.1 |
| B | 3 | 64 | 54043 | 364.12 | 780 | 762 | 146.3 |
| B | 0 | 189 | 46468 | 312.35 | 780 | 762 | 146.3 |
| B | 4 | 173 | 42892 | 287.91 | 780 | 762 | 146.3 |
| C | 3 | 233 | 222288 | 1255.16 | 773 | 779 | 176.5 |
| C | 7 | 238 | 11771 | 62.29 | 773 | 779 | 176.5 |
| C | 13 | 61 | 5477 | 26.62 | 773 | 779 | 176.5 |
| D | 13 | 122 | 642423 | 3562.56 | 760 | 740 | 180.1 |
| D | 8 | 195 | 192052 | 1062.15 | 760 | 740 | 180.1 |
| D | 2 | 136 | 55970 | 306.63 | 760 | 740 | 180.1 |
Histogram calculated using DETX and DETY for each event in the final _common_clean file
| Quadrant A | 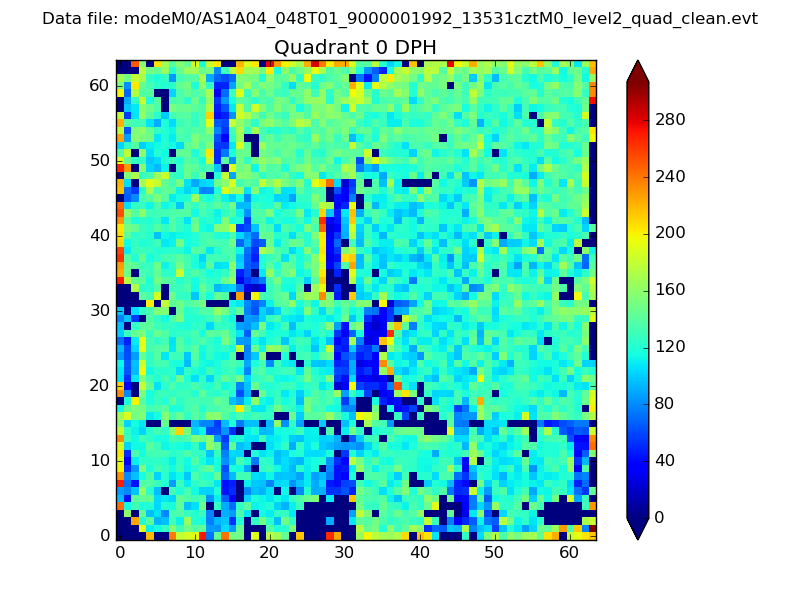 |
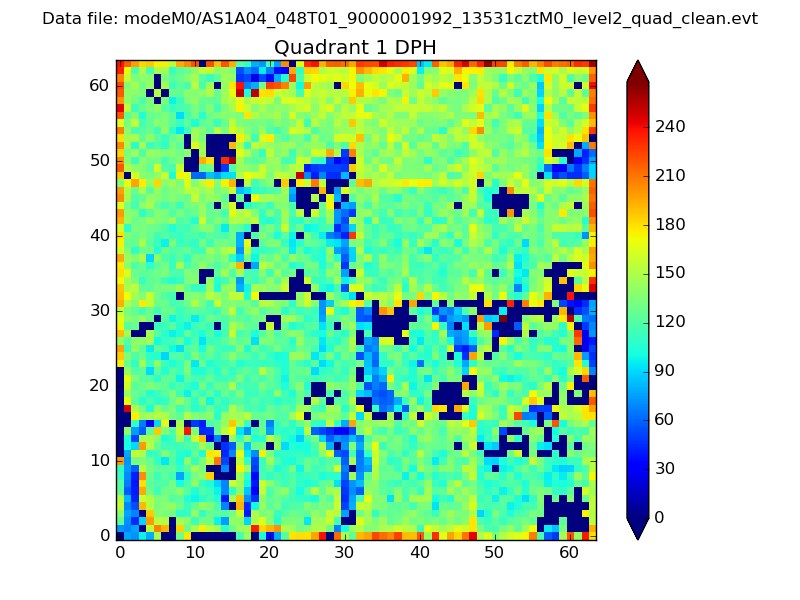 |
Quadrant B |
|---|---|---|---|
| Quadrant D | 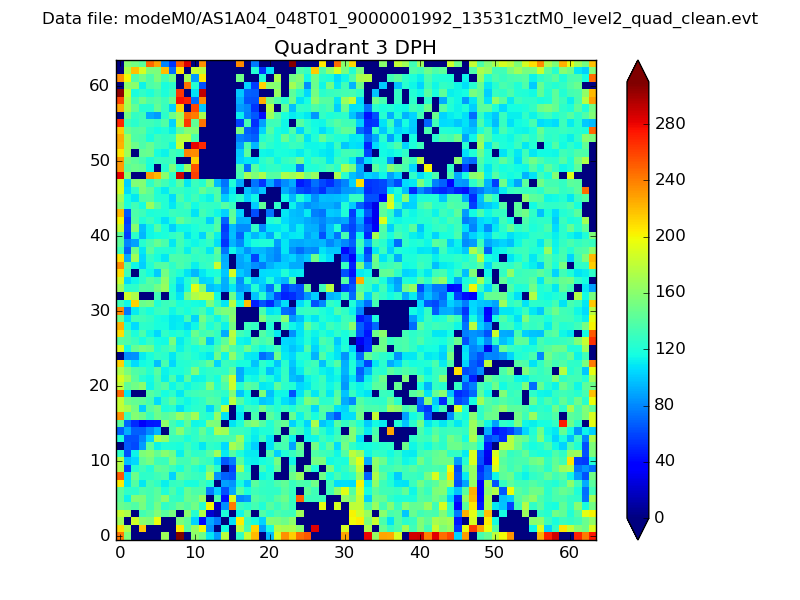 |
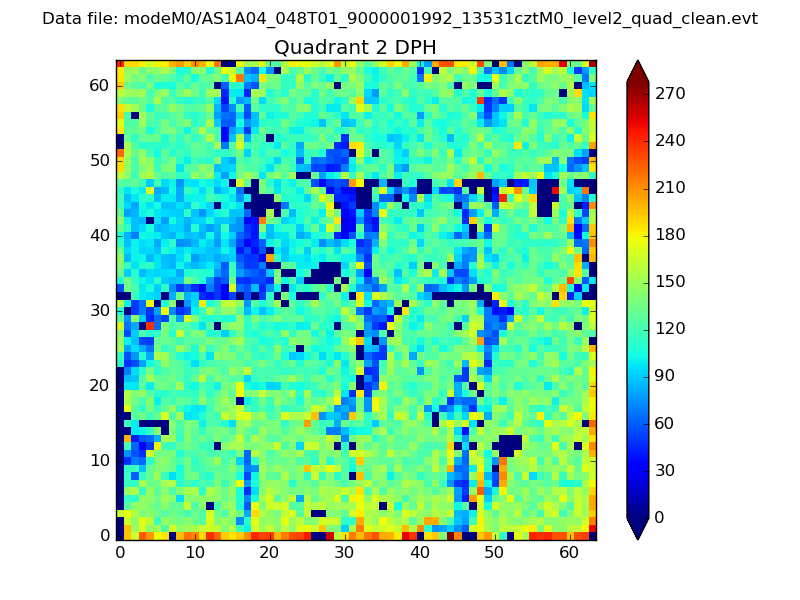 |
Quadrant C |
| Plot type | Count rate plots | Images |
|---|---|---|
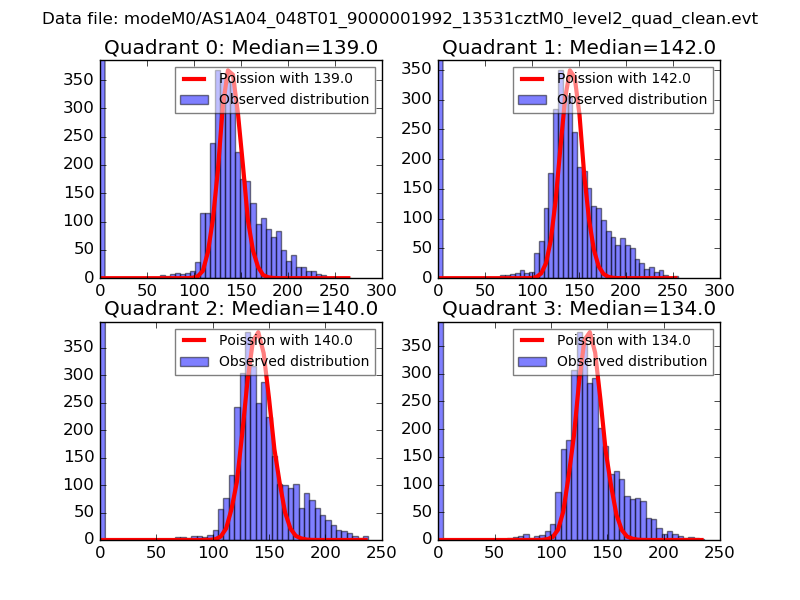
| Comparison with Poisson distribution Blue bars denote a histogram of data divided into 1 sec bins. Red curve is a Poisson curve with rate = median count rate of data. |
 |
 |
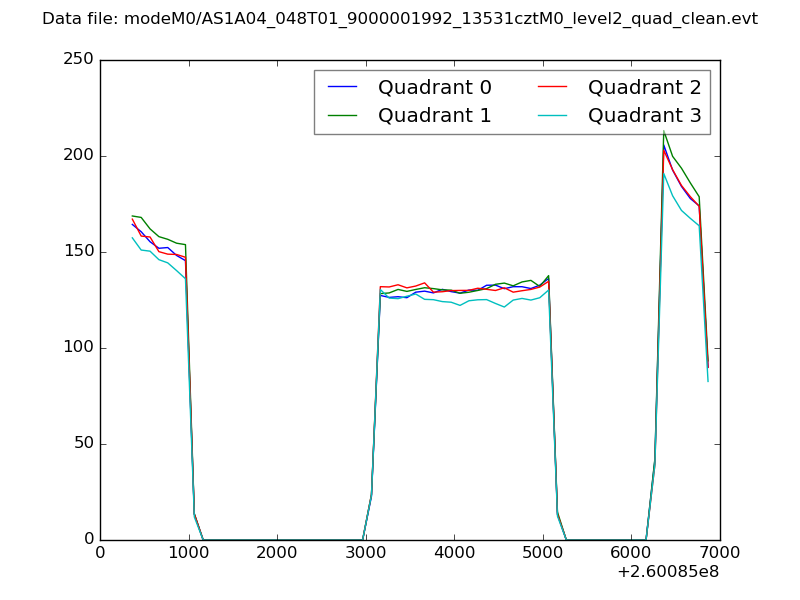
| Quadrant-wise count rates Data is divided into 100 sec bins |
 |
|
| Module-wise count rates for Quadrant A Data is divided into 100 sec bins |
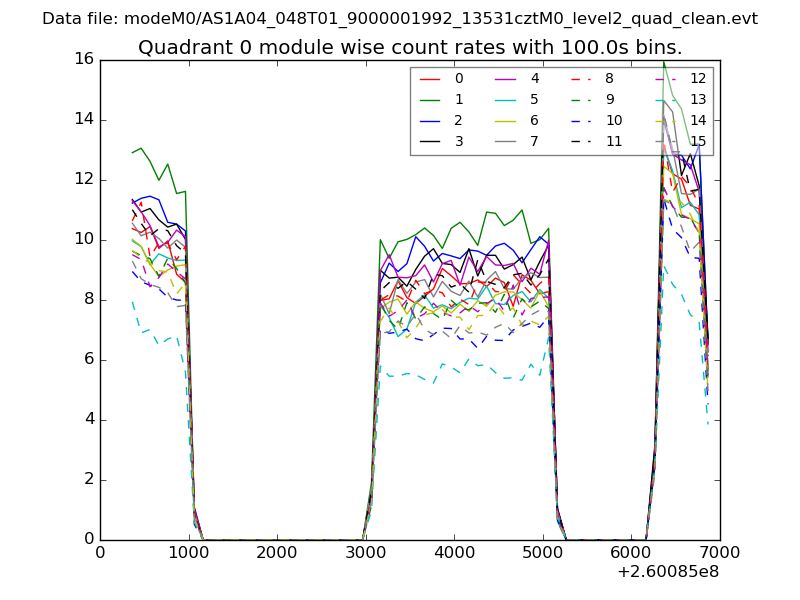 |
 |
| Module-wise count rates for Quadrant B Data is divided into 100 sec bins |
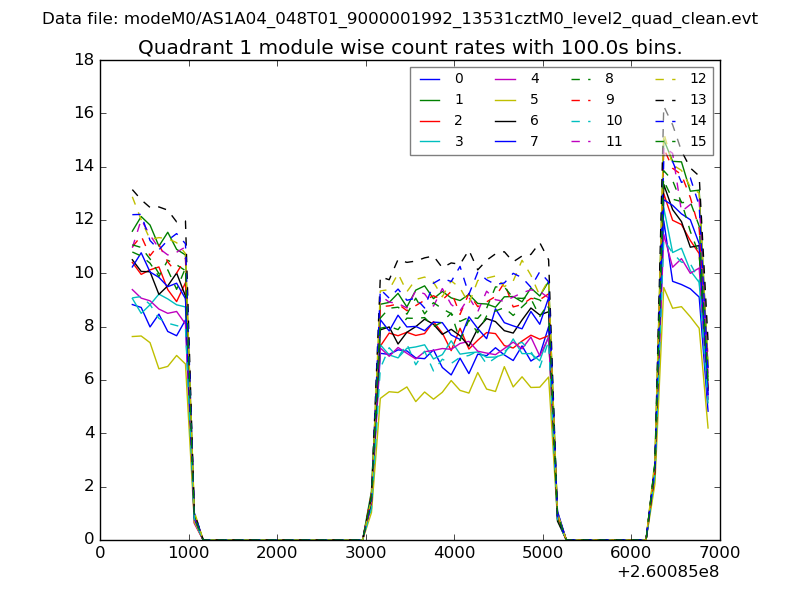 |
 |
| Module-wise count rates for Quadrant C Data is divided into 100 sec bins |
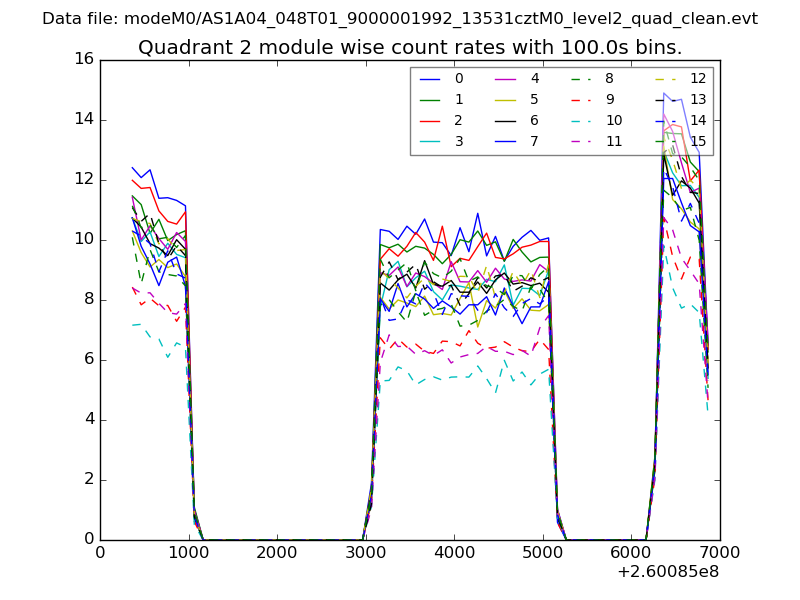 |
 |
| Module-wise count rates for Quadrant D Data is divided into 100 sec bins |
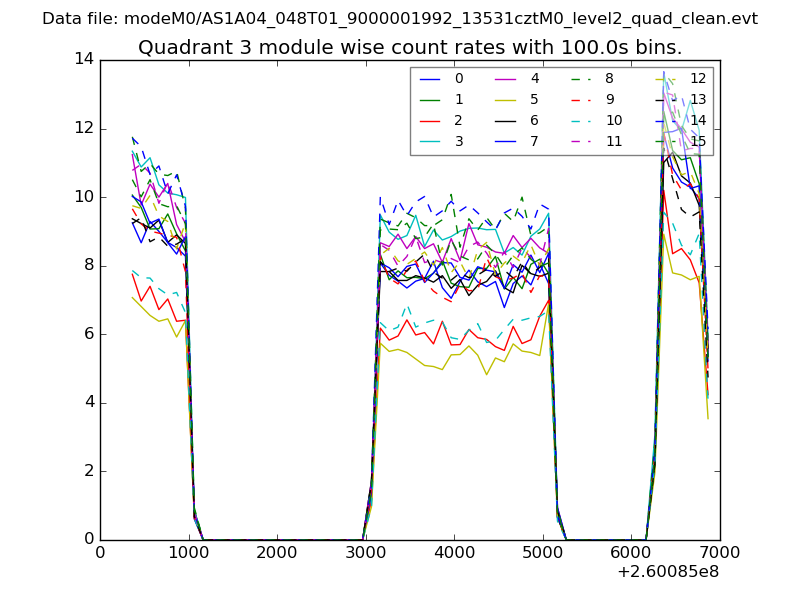 |
 |
| Parameter | Plot |
|---|---|
| CZT HV Monitor | 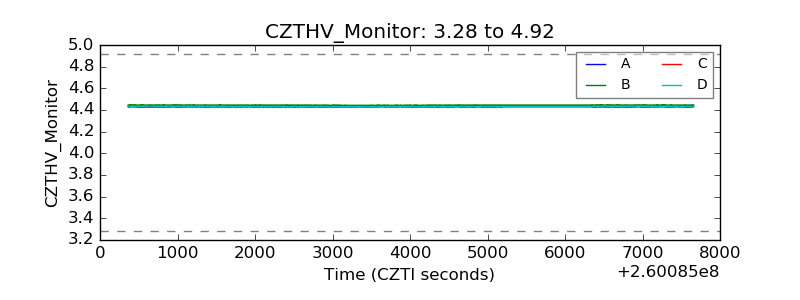 |
| D_VDD | 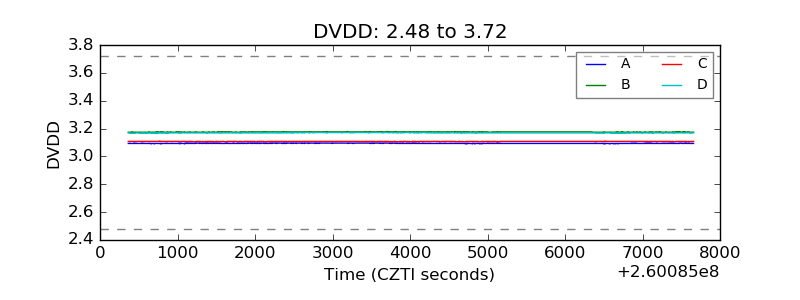 |
| Temperature 1 | 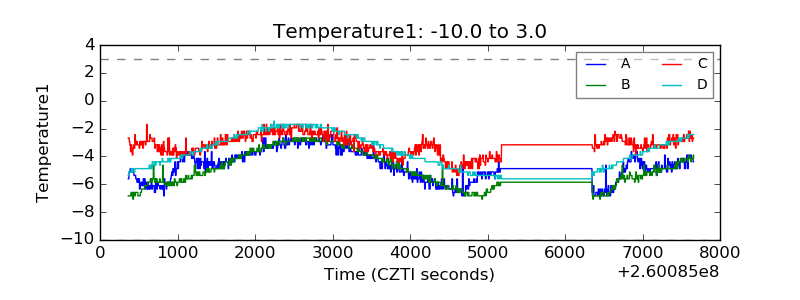 |
| Veto HV Monitor | 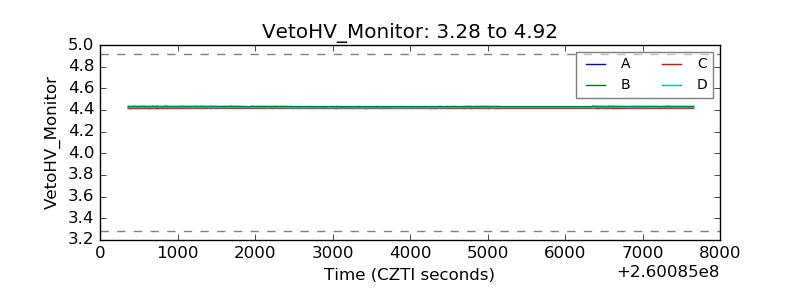 |
| Veto LLD | 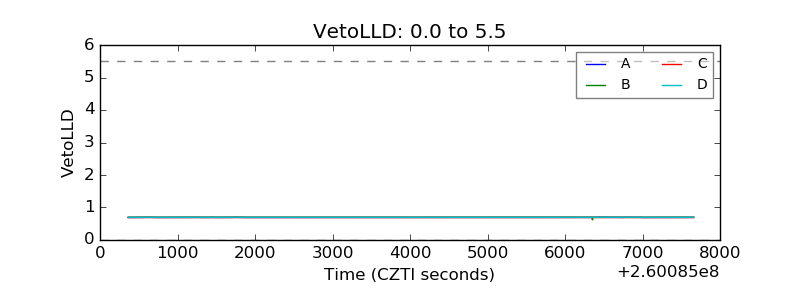 |
| Alpha Counter | 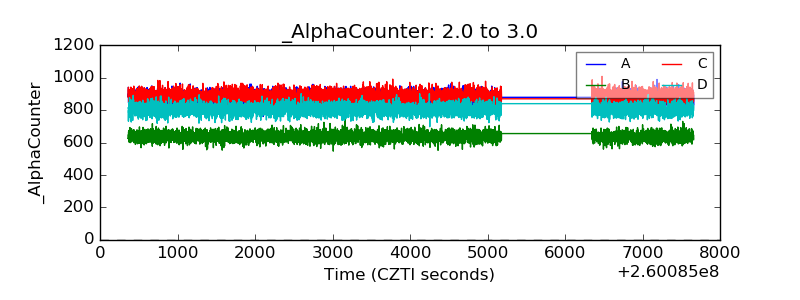 |
| _CPM_Rate | 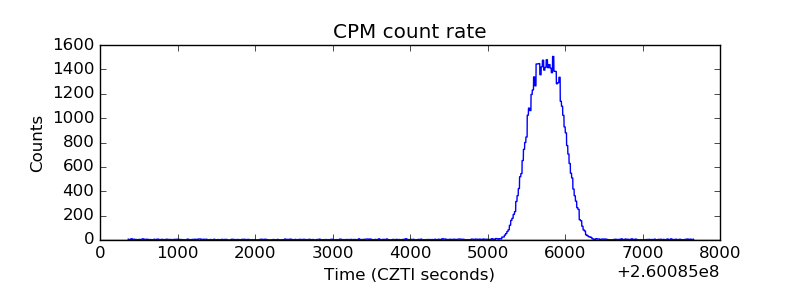 |
| CZT Counter | 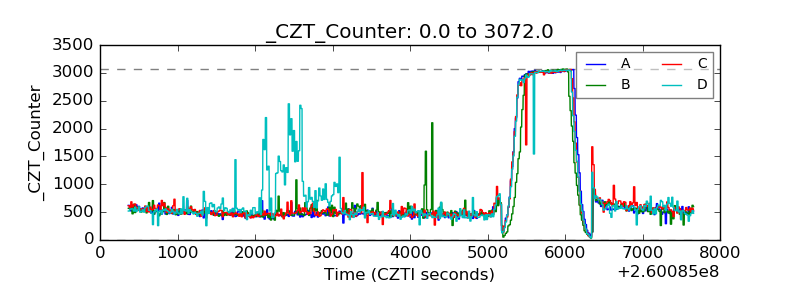 |
| +2.5 Volts monitor |  |
| +5 Volts monitor |  |
| _ROLL_ROT | 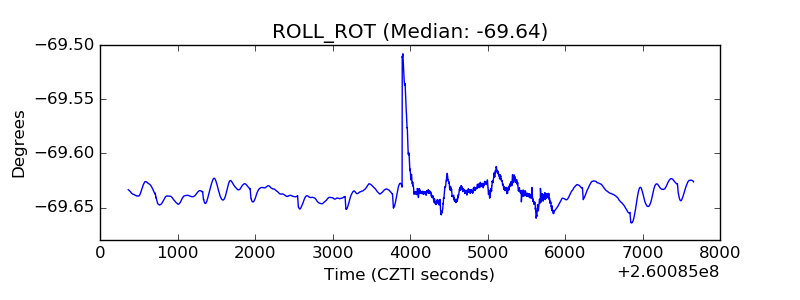 |
| _Roll_DEC | 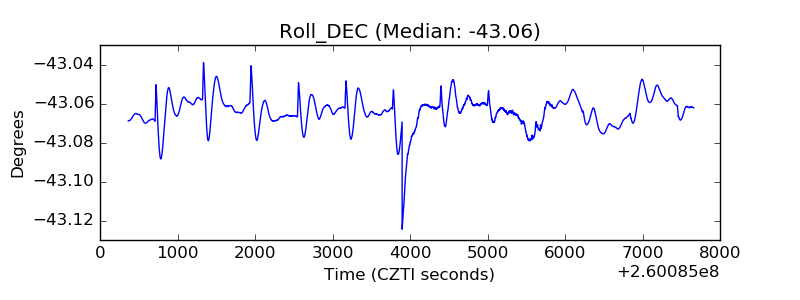 |
| _Roll_RA | 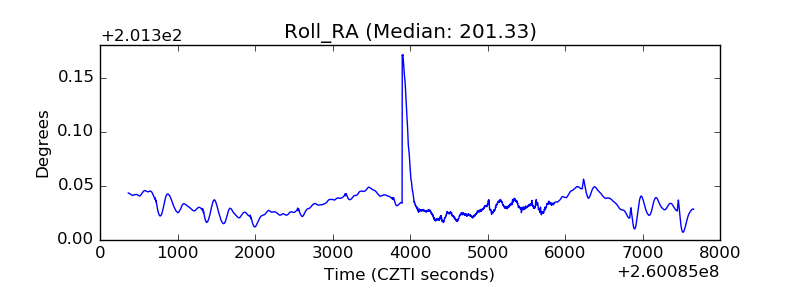 |
| Veto Counter | 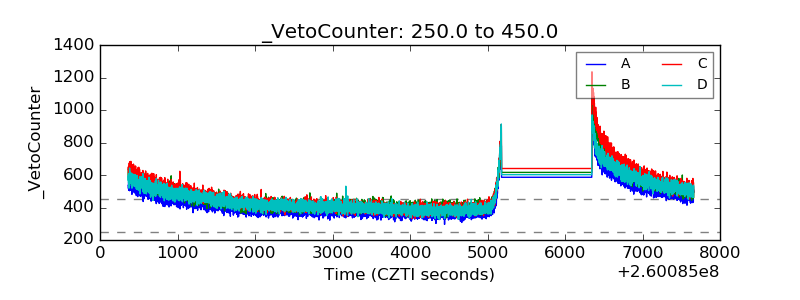 |