| Param | Original file | Final file |
|---|---|---|
| Filename | modeM0/AS1A04_048T01_9000001992_13533cztM0_level2.evt | modeM0/AS1A04_048T01_9000001992_13533cztM0_level2_quad_clean.evt |
| Size (bytes) | 310,294,080 | 48,692,160 |
| Size | 295.9 MB | 46.4 MB |
| Events in quadrant A | 2,139,989 | 297,070 |
| Events in quadrant B | 2,179,924 | 302,794 |
| Events in quadrant C | 2,568,392 | 297,110 |
| Events in quadrant D | 2,225,367 | 283,967 |
| Mode M0 | |||
|---|---|---|---|
| Quadrant | BADHDUFLAG | Total packets | Discarded packets |
| A | 0 | 8914 | 1 |
| B | 0 | 8987 | 1 |
| C | 0 | 10490 | 6 |
| D | 0 | 9134 | 1 |
| Mode M9 | |||
|---|---|---|---|
| Quadrant | BADHDUFLAG | Total packets | Discarded packets |
| A | 0 | 1 | 0 |
| B | 0 | 1 | 0 |
| C | 0 | 1 | 0 |
| D | 0 | 2 | 0 |
| Mode SS | |||
|---|---|---|---|
| Quadrant | BADHDUFLAG | Total packets | Discarded packets |
| A | 0 | 82 | 0 |
| B | 0 | 82 | 0 |
| C | 0 | 82 | 0 |
| D | 0 | 82 | 0 |
| Quadrant | Total seconds | Saturated seconds | Saturation percentage |
|---|---|---|---|
| A | 4164 | 8 | 0.192123% |
| B | 4164 | 19 | 0.456292% |
| C | 4162 | 14 | 0.336377% |
| D | 4164 | 10 | 0.240154% |
Noise dominated data is calculated using 1-second bins in cleaned event files. If a bin has >2000 counts, and if more than 50% of those come from <1% of pixels, then it is considered to be noise-dominated and hence unusable.
| Quadrant | # 1 sec bins | Bins with >0 counts | Bins with >2000 counts | High rate bins dominated by noise | Noise dominated (total time) | Noise dominated (detector-on time) | Marked lightcurve |
|---|---|---|---|---|---|---|---|
| A | 4165 | 4165 | 0 | 0 | 0.00% | 0.00% | 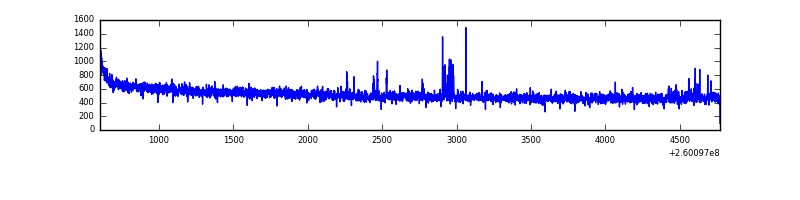 |
| B | 4165 | 4165 | 4 | 4 | 0.10% | 0.10% | 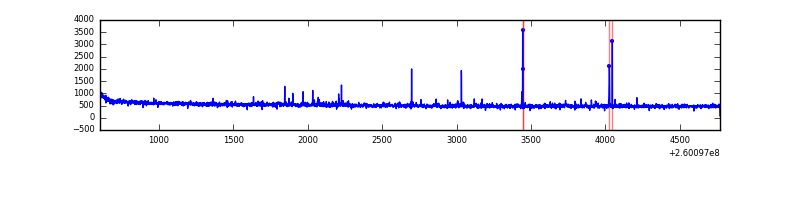 |
| C | 4165 | 4164 | 2 | 2 | 0.05% | 0.05% | 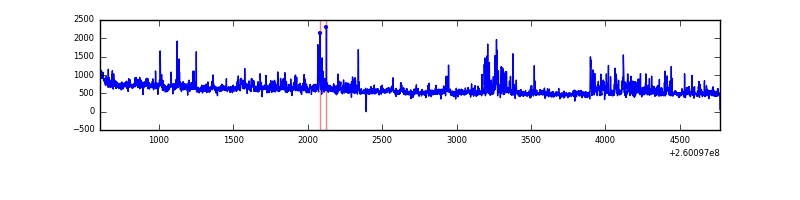 |
| D | 4165 | 4165 | 6 | 6 | 0.14% | 0.14% | 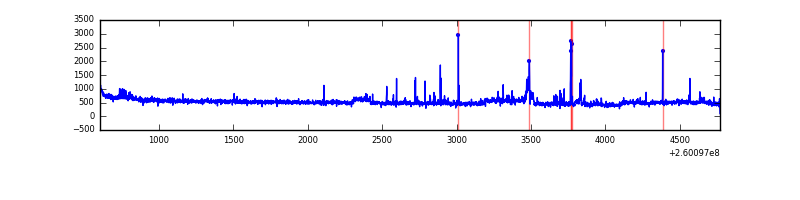 |
Top three noisy pixels from each quadrant. If the there are fewer than three noisy pixels in the level2.evt file, extra rows are filled as -1
| Pixel properties | Quadrant properties | ||||||
|---|---|---|---|---|---|---|---|
| Quadrant | DetID | PixID | Counts | Sigma | Mean | Median | Sigma |
| A | 8 | 15 | 21084 | 187.04 | 546 | 538 | 109.8 |
| A | 1 | 162 | 10279 | 88.68 | 546 | 538 | 109.8 |
| A | 0 | 226 | 4994 | 40.57 | 546 | 538 | 109.8 |
| B | 4 | 142 | 17187 | 166.72 | 542 | 531 | 99.9 |
| B | 3 | 209 | 14331 | 138.13 | 542 | 531 | 99.9 |
| B | 0 | 214 | 12922 | 124.03 | 542 | 531 | 99.9 |
| C | 3 | 233 | 506343 | 4211.88 | 529 | 533 | 120.1 |
| C | 13 | 61 | 3872 | 27.8 | 529 | 533 | 120.1 |
| C | 3 | 203 | 1260 | 6.05 | 529 | 533 | 120.1 |
| D | 8 | 195 | 131779 | 1048.89 | 525 | 513 | 125.1 |
| D | 13 | 104 | 42549 | 335.89 | 525 | 513 | 125.1 |
| D | 2 | 14 | 21681 | 169.14 | 525 | 513 | 125.1 |
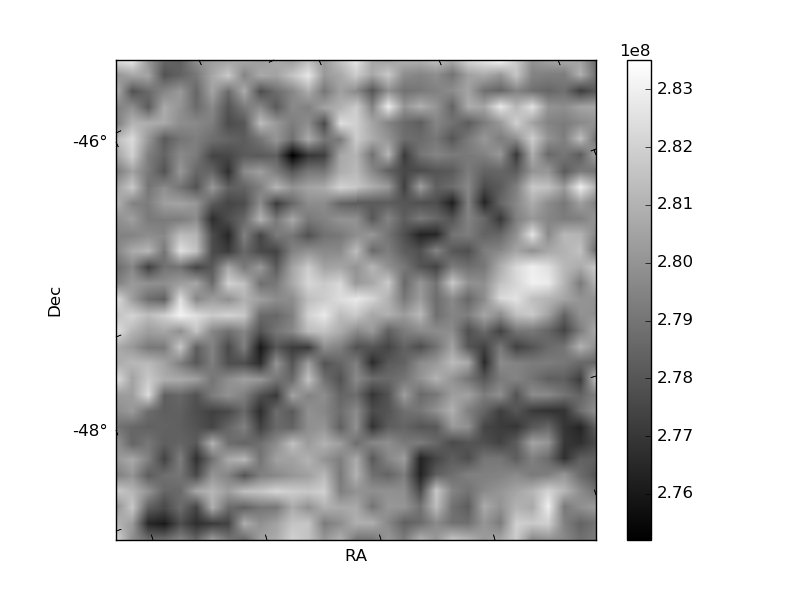
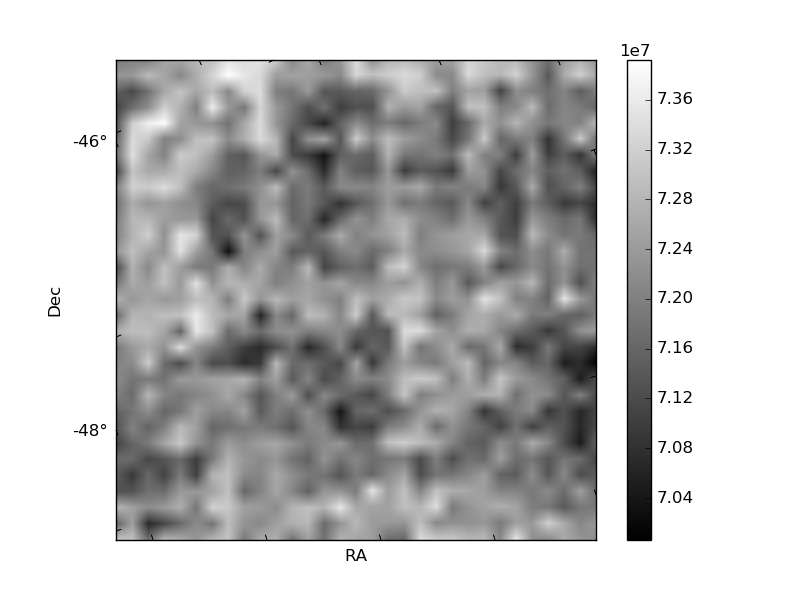
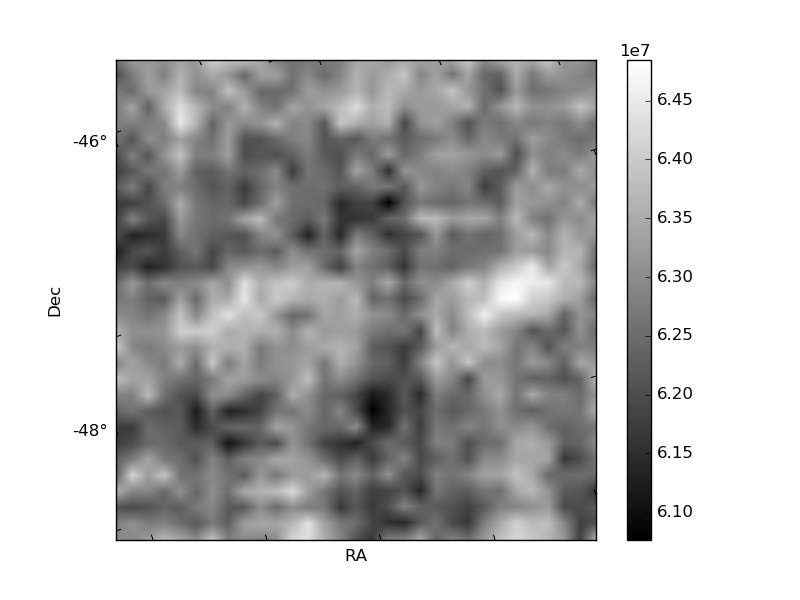
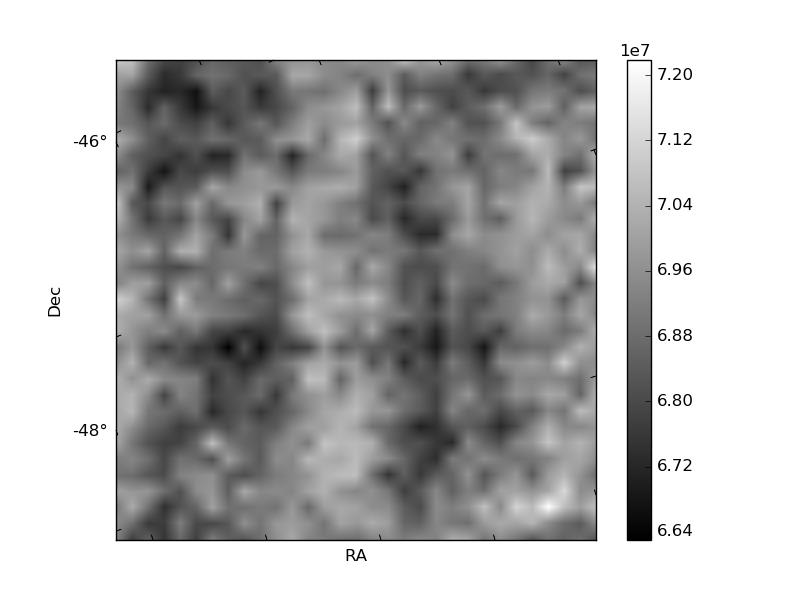
Histogram calculated using DETX and DETY for each event in the final _common_clean file
| Quadrant A | 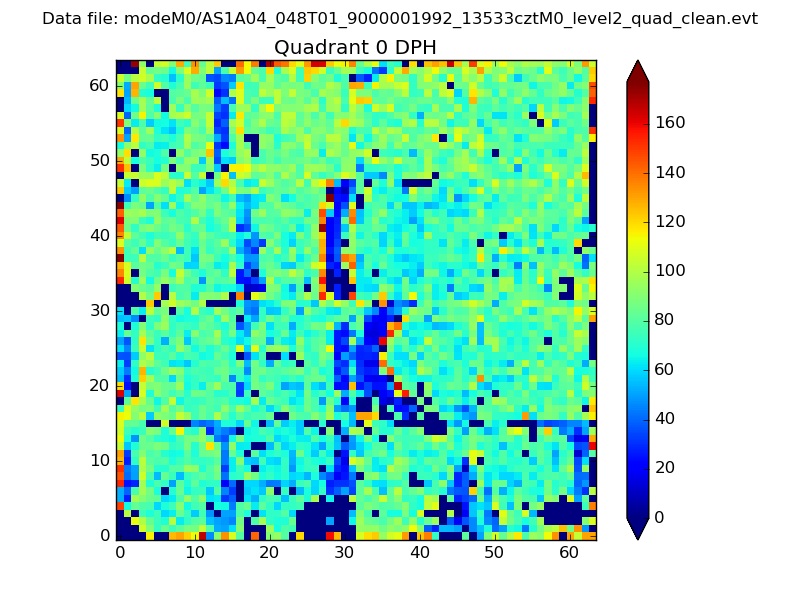 |
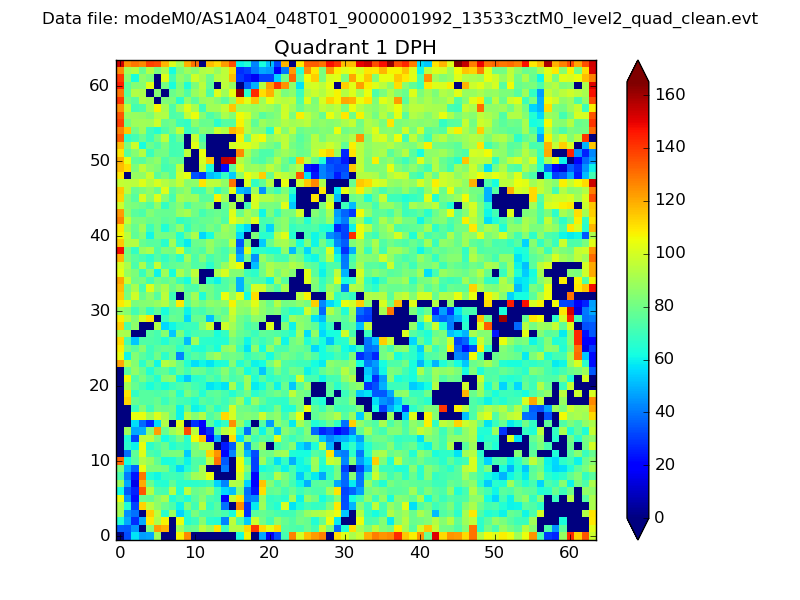 |
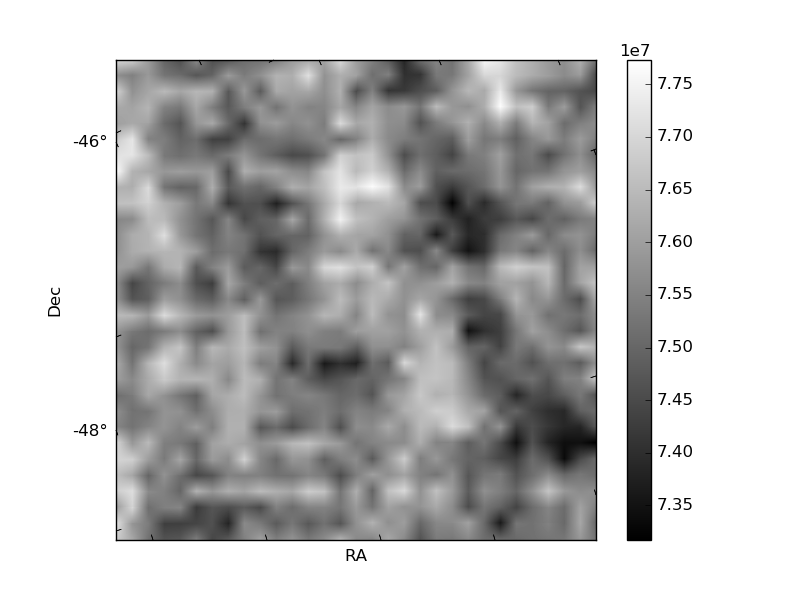
Quadrant B |
|---|---|---|---|
| Quadrant D | 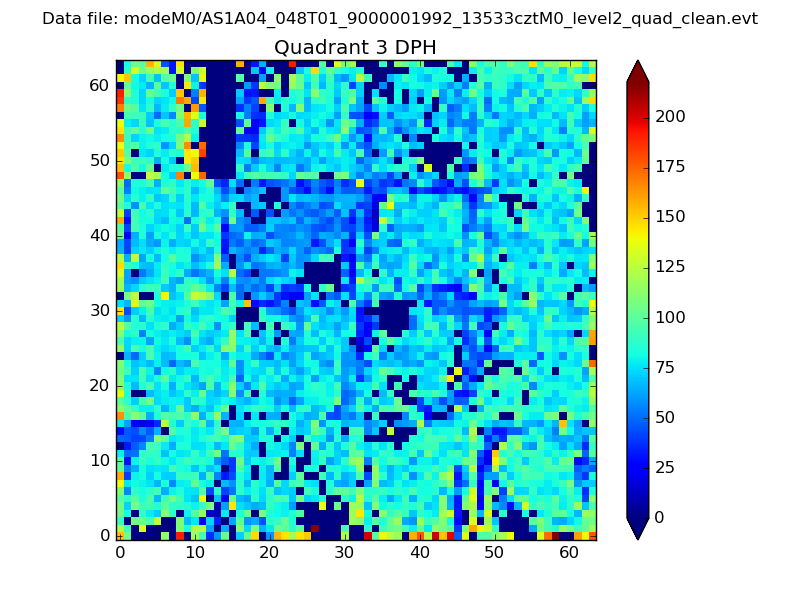 |
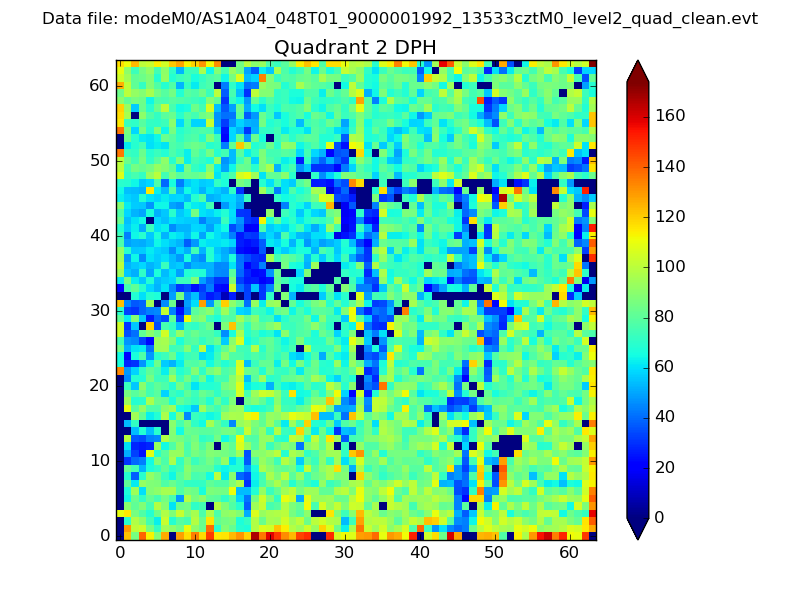 |
Quadrant C |
| Plot type | Count rate plots | Images |
|---|---|---|
| Comparison with Poisson distribution Blue bars denote a histogram of data divided into 1 sec bins. Red curve is a Poisson curve with rate = median count rate of data. |
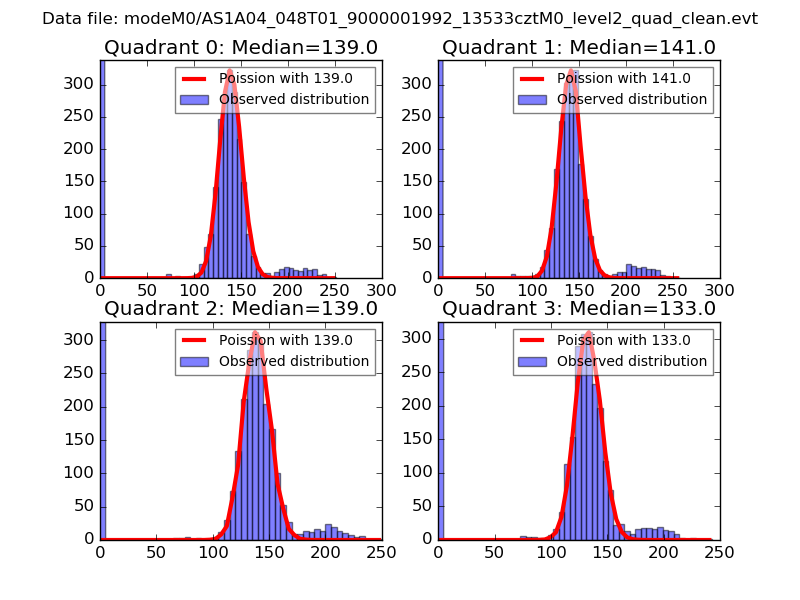 |
 |
| Quadrant-wise count rates Data is divided into 100 sec bins |
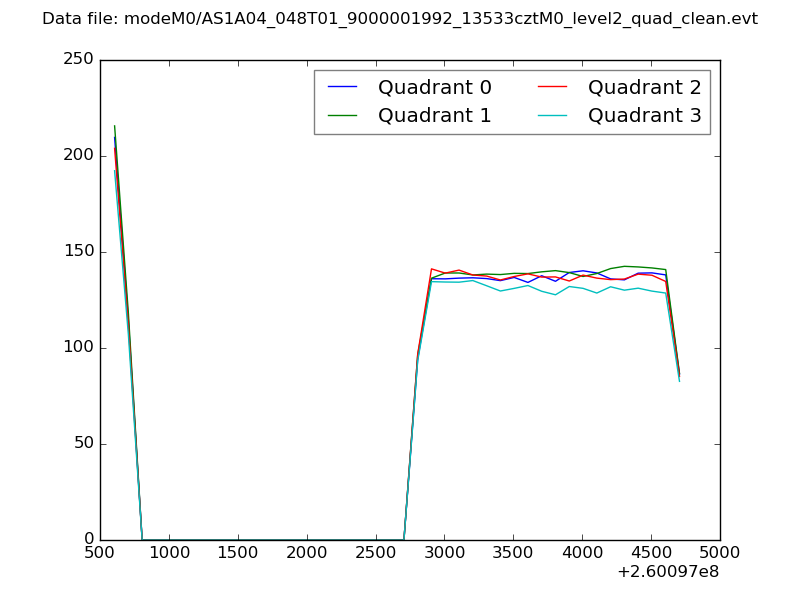 |
|
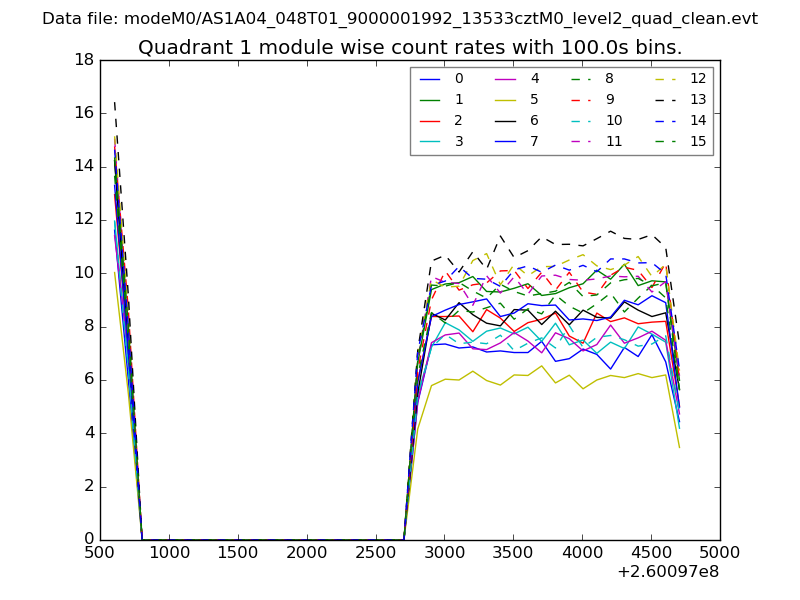
| Module-wise count rates for Quadrant A Data is divided into 100 sec bins |
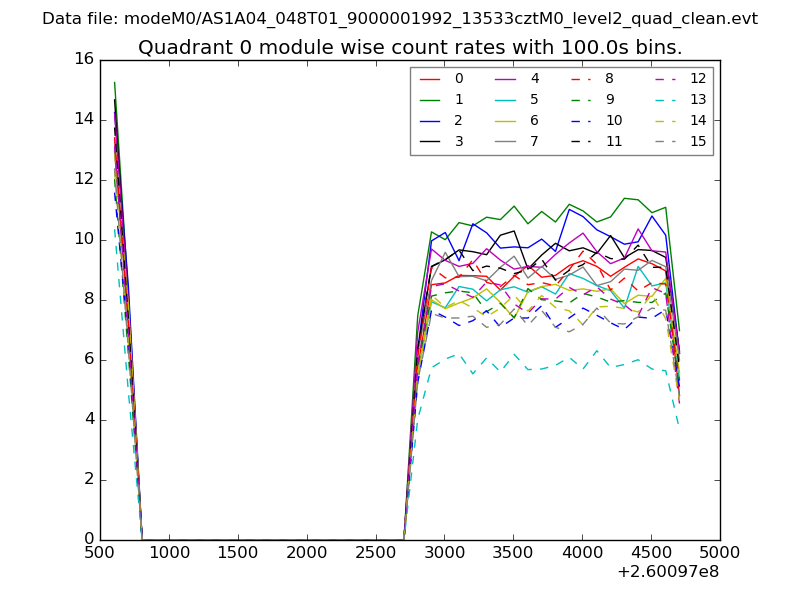 |
 |
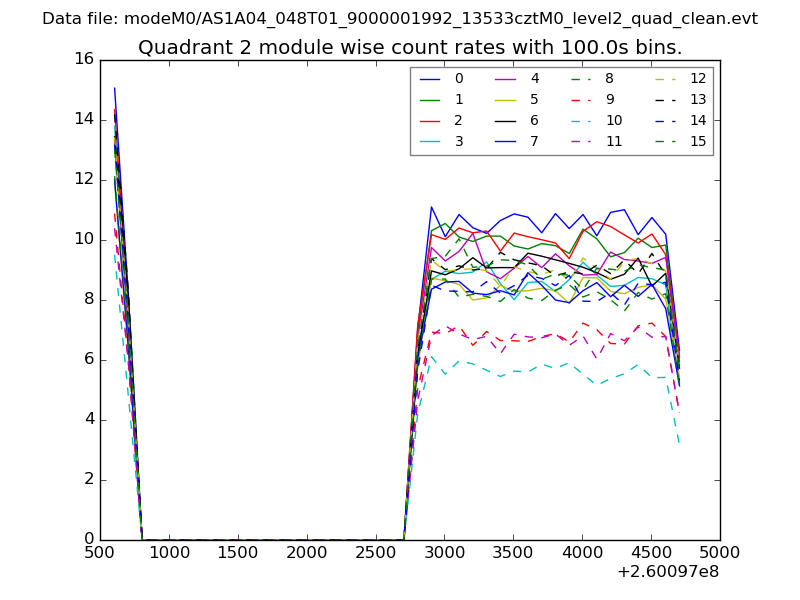
| Module-wise count rates for Quadrant B Data is divided into 100 sec bins |
 |
 |
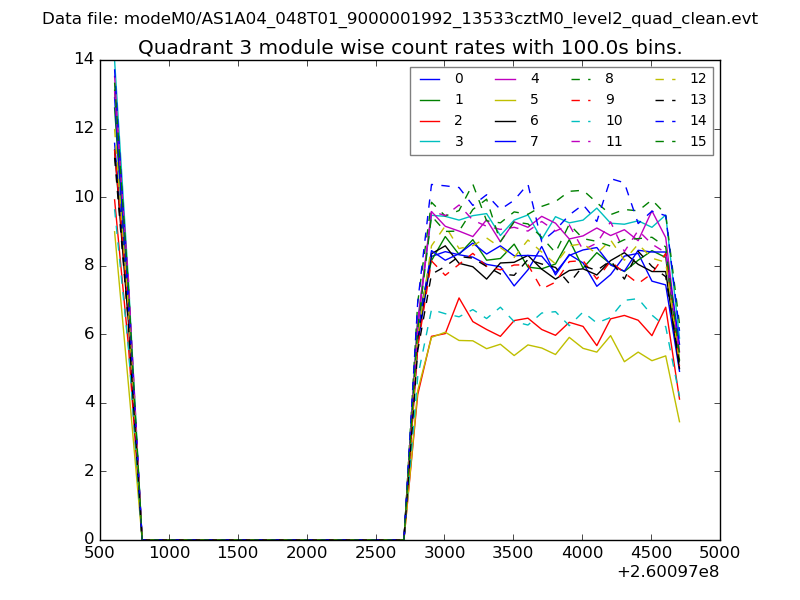
| Module-wise count rates for Quadrant C Data is divided into 100 sec bins |
 |
 |
| Module-wise count rates for Quadrant D Data is divided into 100 sec bins |
 |
 |
| Parameter | Plot |
|---|---|
| CZT HV Monitor | 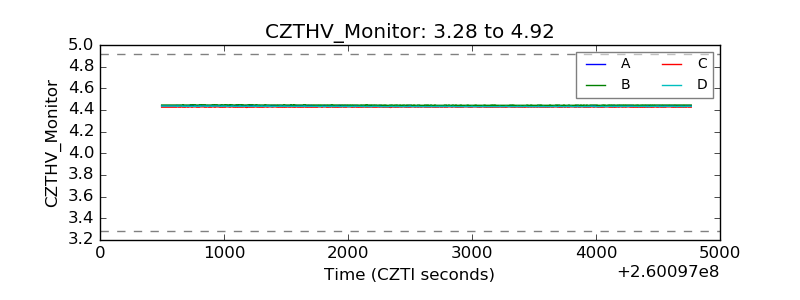 |
| D_VDD | 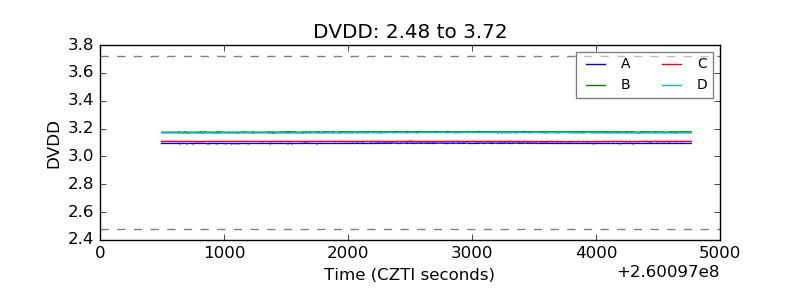 |
| Temperature 1 | 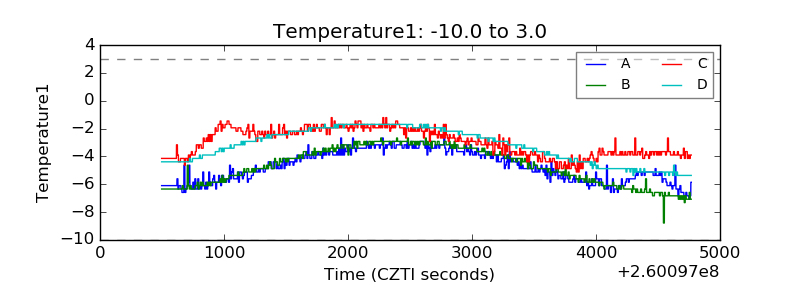 |
| Veto HV Monitor | 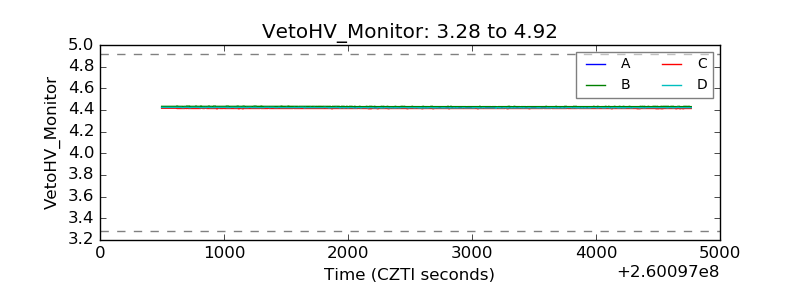 |
| Veto LLD | 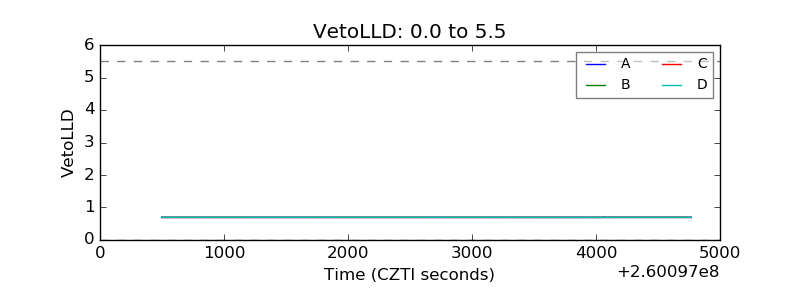 |
| Alpha Counter | 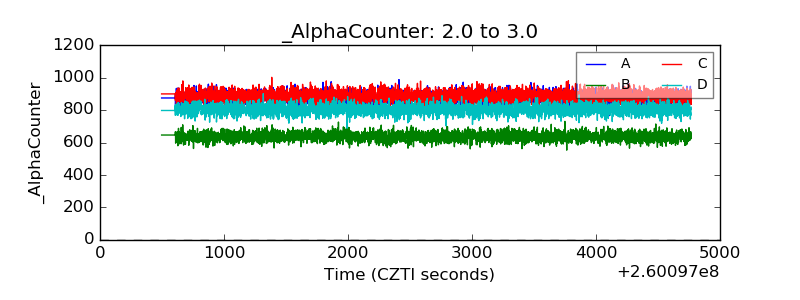 |
| _CPM_Rate | 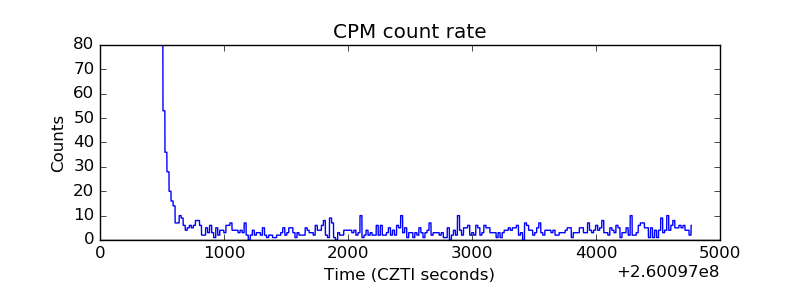 |
| CZT Counter | 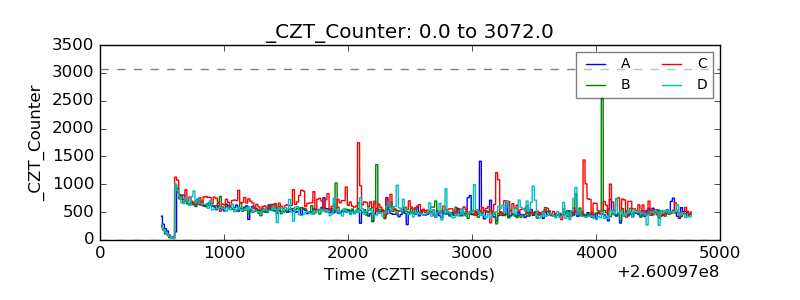 |
| +2.5 Volts monitor |  |
| +5 Volts monitor |  |
| _ROLL_ROT | 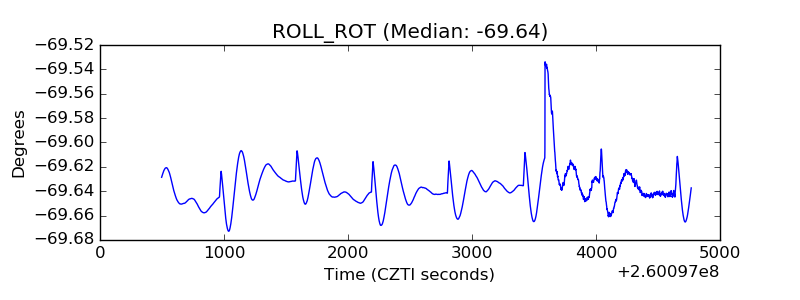 |
| _Roll_DEC | 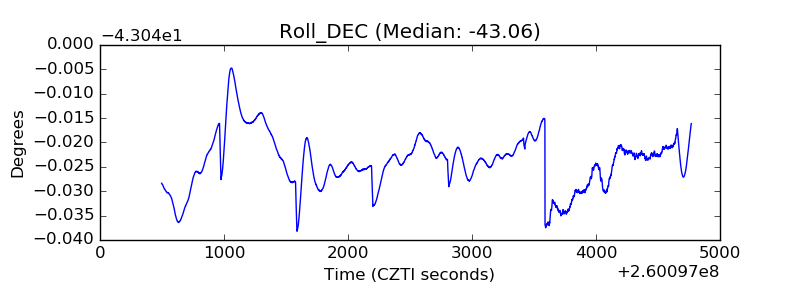 |
| _Roll_RA | 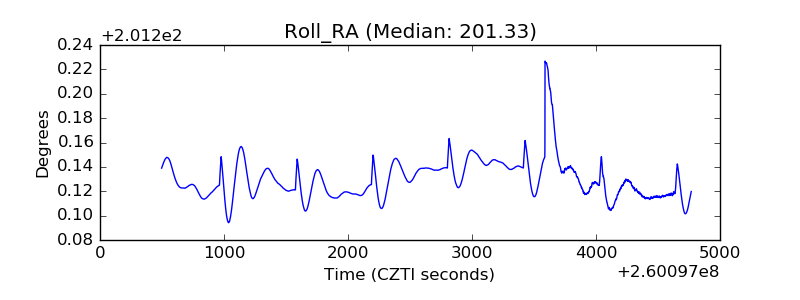 |
| Veto Counter | 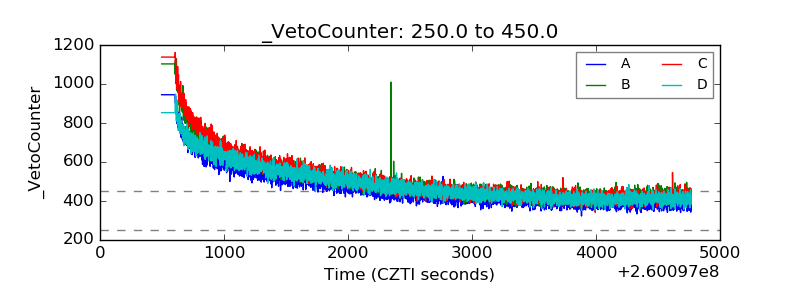 |