| Param | Original file | Final file |
|---|---|---|
| Filename | modeM0/AS1T02_038T01_9000001994_13533cztM0_level2.evt | modeM0/AS1T02_038T01_9000001994_13533cztM0_level2_quad_clean.evt |
| Size (bytes) | 117,639,360 | 27,348,480 |
| Size | 112.2 MB | 26.1 MB |
| Events in quadrant A | 833,822 | 184,941 |
| Events in quadrant B | 826,084 | 185,963 |
| Events in quadrant C | 971,467 | 183,129 |
| Events in quadrant D | 837,978 | 173,776 |
| Mode M0 | |||
|---|---|---|---|
| Quadrant | BADHDUFLAG | Total packets | Discarded packets |
| A | 0 | 3458 | 2 |
| B | 0 | 3446 | 1 |
| C | 0 | 3952 | 1 |
| D | 0 | 3500 | 1 |
| Mode SS | |||
|---|---|---|---|
| Quadrant | BADHDUFLAG | Total packets | Discarded packets |
| A | 0 | 26 | 0 |
| B | 0 | 26 | 0 |
| C | 0 | 26 | 0 |
| D | 0 | 26 | 0 |
| Mode M9 | |||
|---|---|---|---|
| Quadrant | BADHDUFLAG | Total packets | Discarded packets |
| A | 0 | 11 | 0 |
| B | 0 | 11 | 0 |
| C | 0 | 11 | 0 |
| D | 0 | 11 | 0 |
| Quadrant | Total seconds | Saturated seconds | Saturation percentage |
|---|---|---|---|
| A | 1337 | 8 | 0.598355% |
| B | 1337 | 9 | 0.673149% |
| C | 1337 | 15 | 1.121915% |
| D | 1337 | 2 | 0.149589% |
Noise dominated data is calculated using 1-second bins in cleaned event files. If a bin has >2000 counts, and if more than 50% of those come from <1% of pixels, then it is considered to be noise-dominated and hence unusable.
| Quadrant | # 1 sec bins | Bins with >0 counts | Bins with >2000 counts | High rate bins dominated by noise | Noise dominated (total time) | Noise dominated (detector-on time) | Marked lightcurve |
|---|---|---|---|---|---|---|---|
| A | 1338 | 1338 | 0 | 0 | 0.00% | 0.00% | 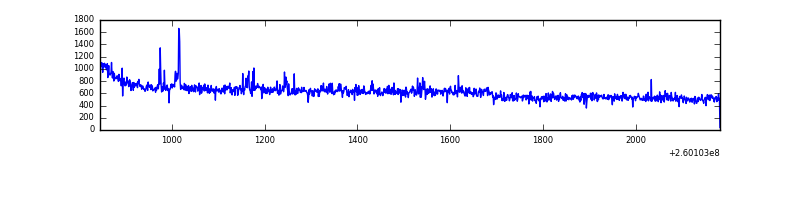 |
| B | 1338 | 1338 | 3 | 3 | 0.22% | 0.22% | 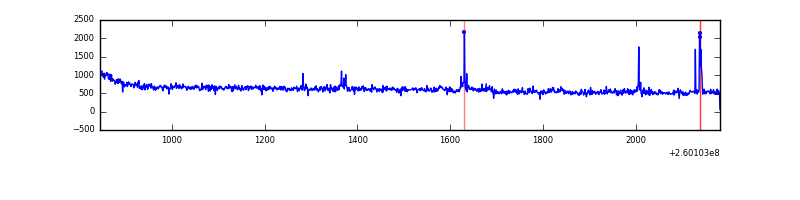 |
| C | 1338 | 1338 | 6 | 6 | 0.45% | 0.45% | 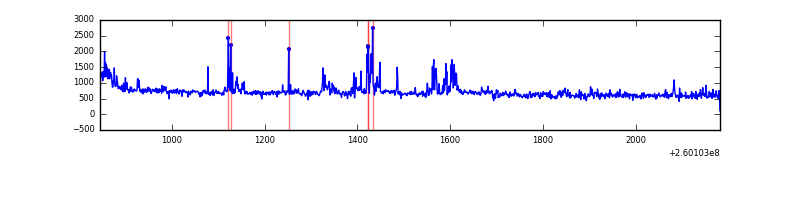 |
| D | 1338 | 1338 | 1 | 1 | 0.07% | 0.07% | 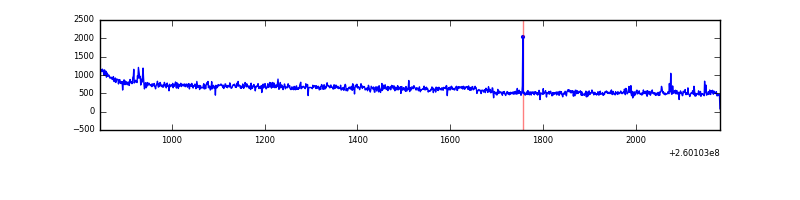 |
Top three noisy pixels from each quadrant. If the there are fewer than three noisy pixels in the level2.evt file, extra rows are filled as -1
| Pixel properties | Quadrant properties | ||||||
|---|---|---|---|---|---|---|---|
| Quadrant | DetID | PixID | Counts | Sigma | Mean | Median | Sigma |
| A | 1 | 162 | 7476 | 159.22 | 212 | 210 | 45.6 |
| A | 14 | 238 | 3973 | 82.46 | 212 | 210 | 45.6 |
| A | 1 | 178 | 2532 | 50.88 | 212 | 210 | 45.6 |
| B | 4 | 142 | 7946 | 186.31 | 206 | 203 | 41.6 |
| B | 0 | 230 | 7175 | 167.76 | 206 | 203 | 41.6 |
| B | 12 | 111 | 4074 | 93.14 | 206 | 203 | 41.6 |
| C | 3 | 233 | 188462 | 3884.73 | 200 | 203 | 48.5 |
| C | 13 | 61 | 1429 | 25.3 | 200 | 203 | 48.5 |
| C | 7 | 238 | 481 | 5.74 | 200 | 203 | 48.5 |
| D | 8 | 195 | 55944 | 1093.23 | 203 | 198 | 51.0 |
| D | 13 | 104 | 8985 | 172.32 | 203 | 198 | 51.0 |
| D | 2 | 14 | 4544 | 85.23 | 203 | 198 | 51.0 |
Histogram calculated using DETX and DETY for each event in the final _common_clean file
| Quadrant A | 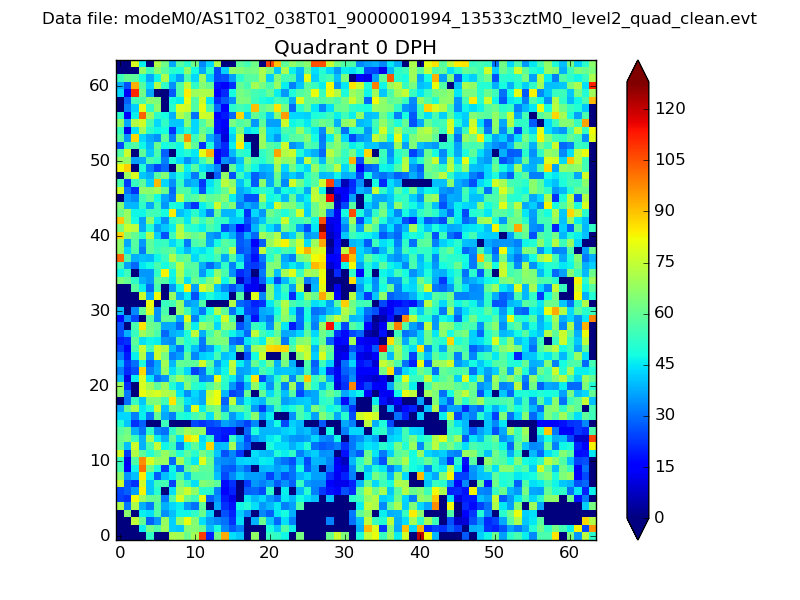 |
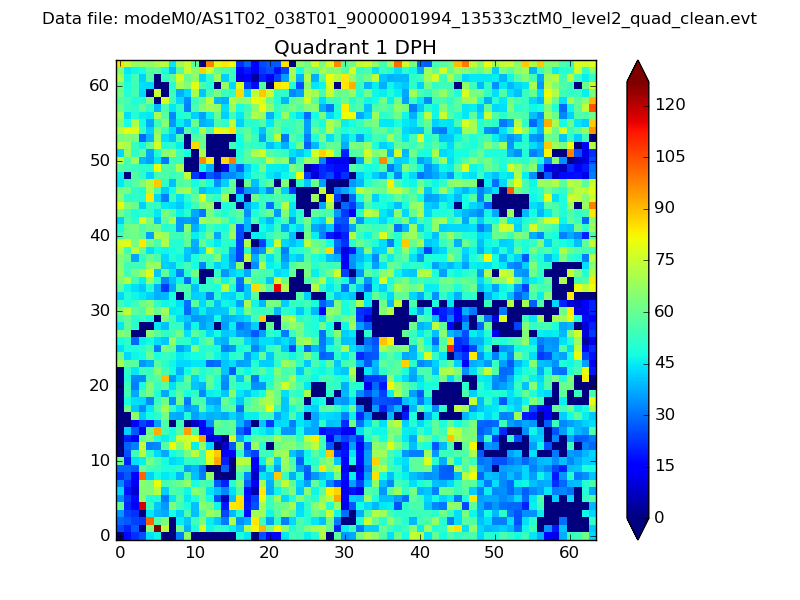 |
Quadrant B |
|---|---|---|---|
| Quadrant D | 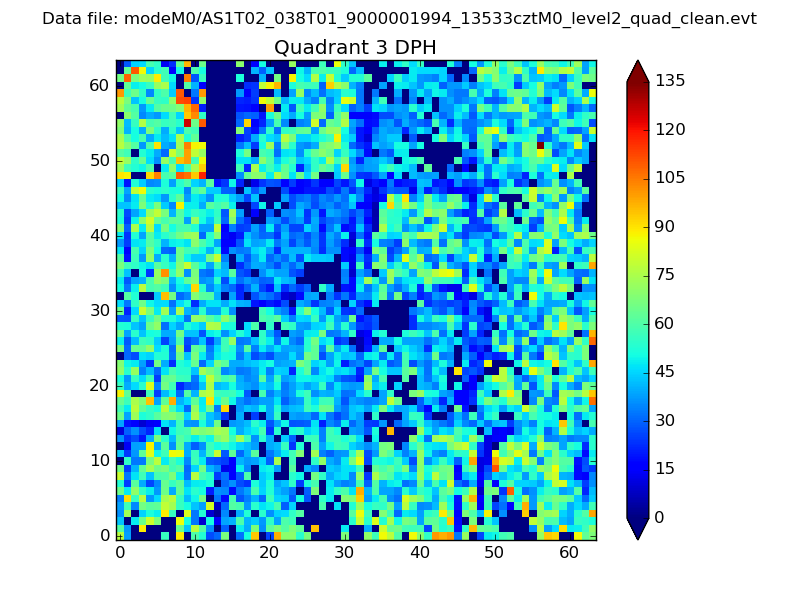 |
 |
Quadrant C |
| Plot type | Count rate plots | Images |
|---|---|---|
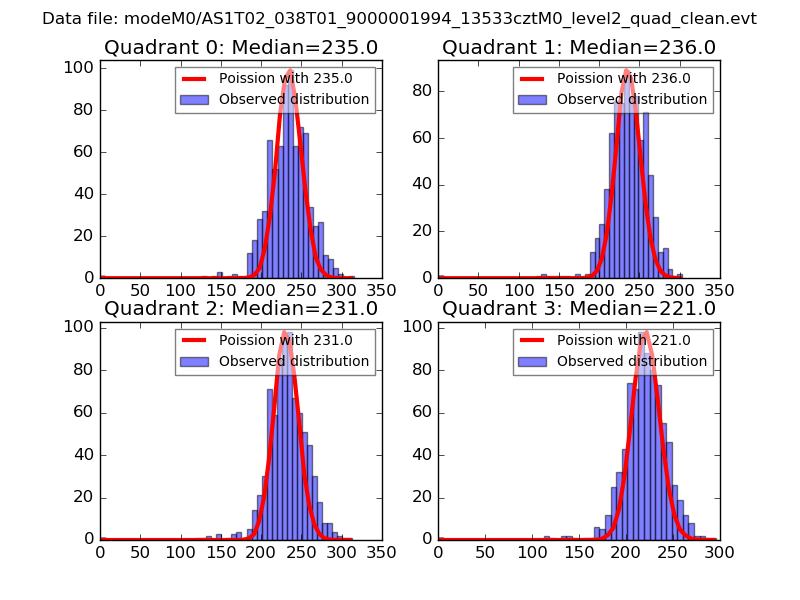
| Comparison with Poisson distribution Blue bars denote a histogram of data divided into 1 sec bins. Red curve is a Poisson curve with rate = median count rate of data. |
 |
 |
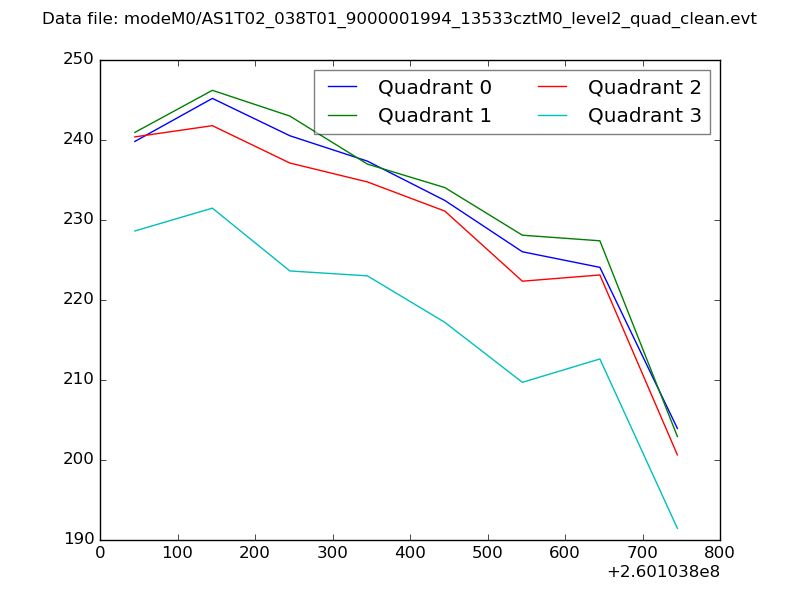
| Quadrant-wise count rates Data is divided into 100 sec bins |
 |
|
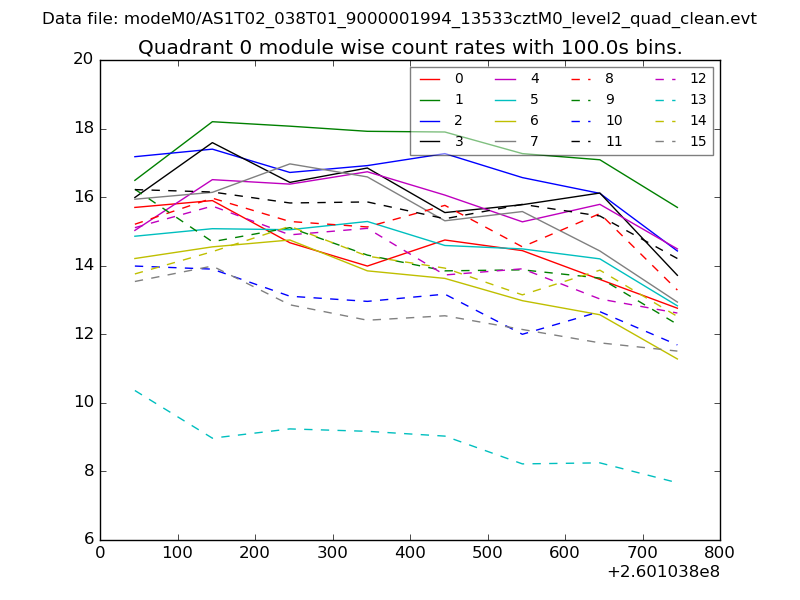
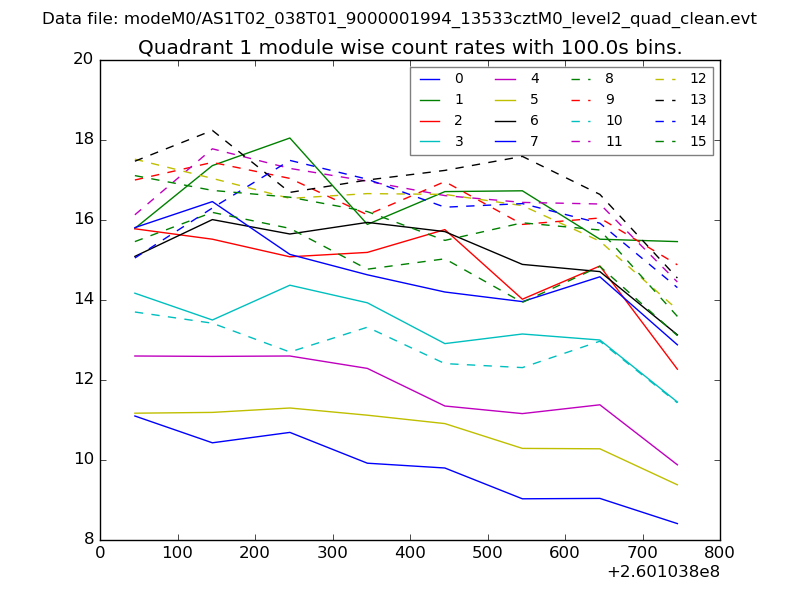
| Module-wise count rates for Quadrant A Data is divided into 100 sec bins |
 |
 |
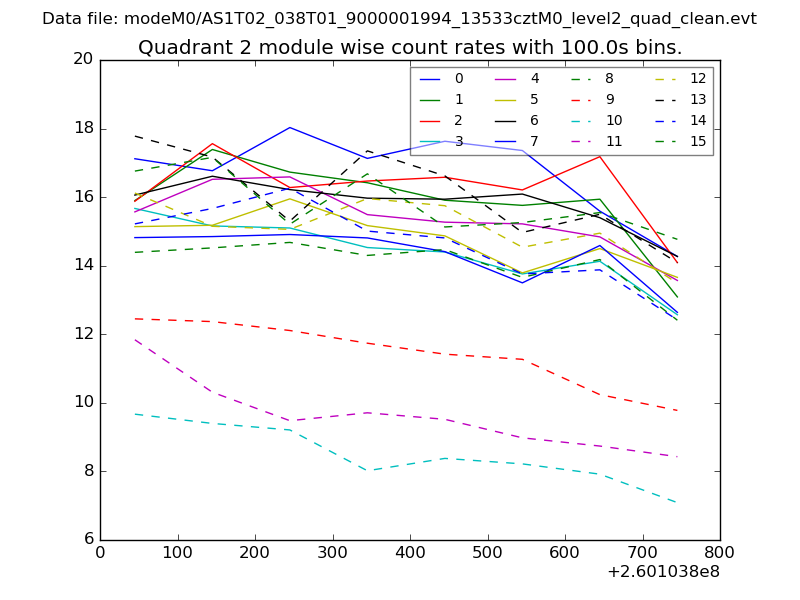
| Module-wise count rates for Quadrant B Data is divided into 100 sec bins |
 |
 |
| Module-wise count rates for Quadrant C Data is divided into 100 sec bins |
 |
 |
| Module-wise count rates for Quadrant D Data is divided into 100 sec bins |
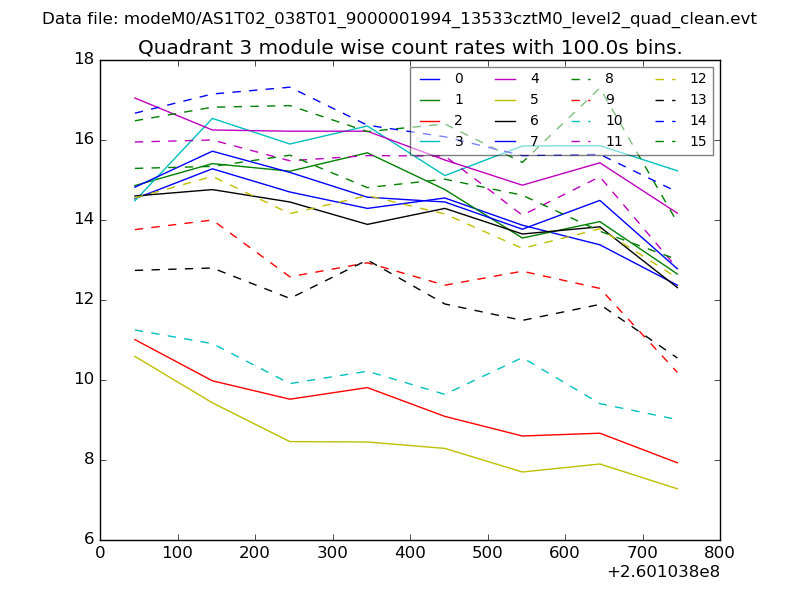 |
 |
| Parameter | Plot |
|---|---|
| CZT HV Monitor | 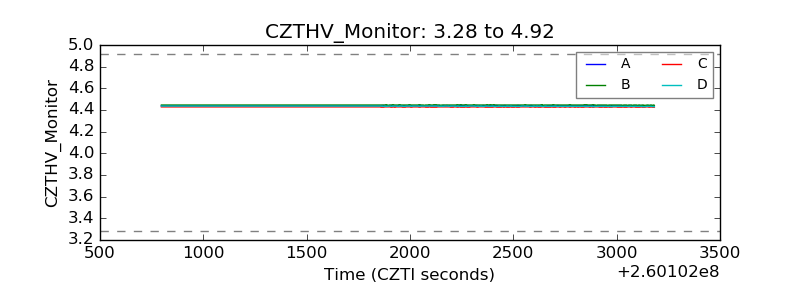 |
| D_VDD |  |
| Temperature 1 | 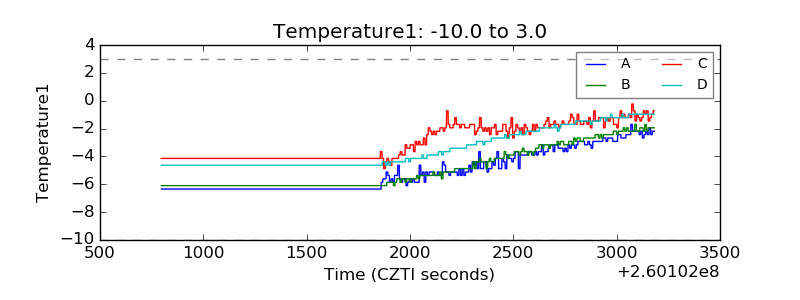 |
| Veto HV Monitor | 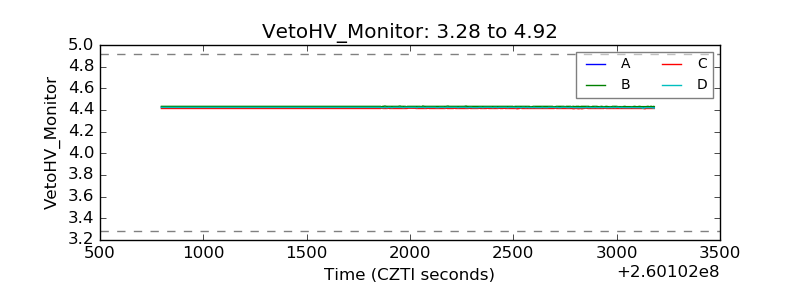 |
| Veto LLD | 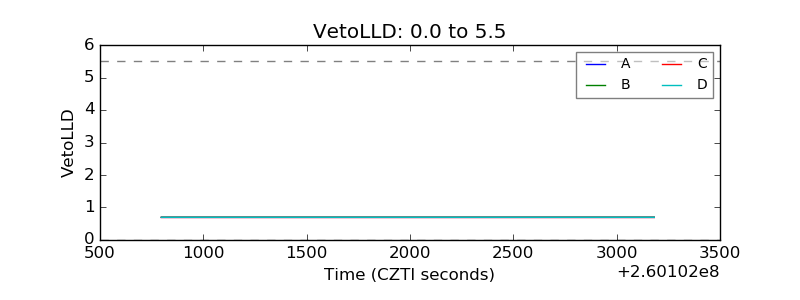 |
| Alpha Counter | 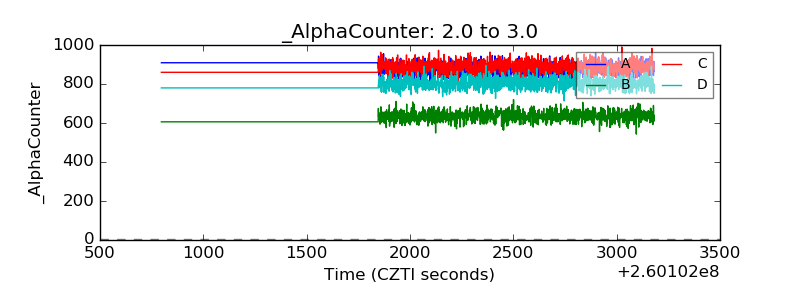 |
| _CPM_Rate | 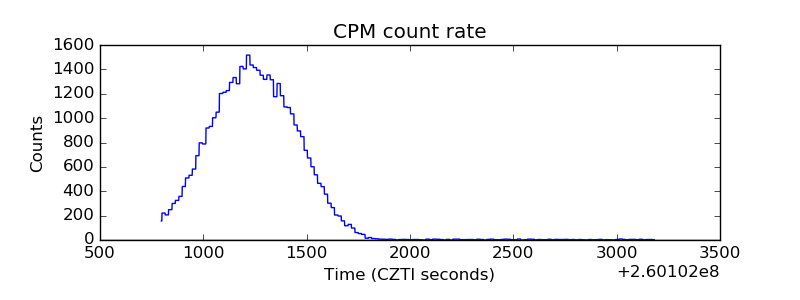 |
| CZT Counter |  |
| +2.5 Volts monitor |  |
| +5 Volts monitor |  |
| _ROLL_ROT |  |
| _Roll_DEC | 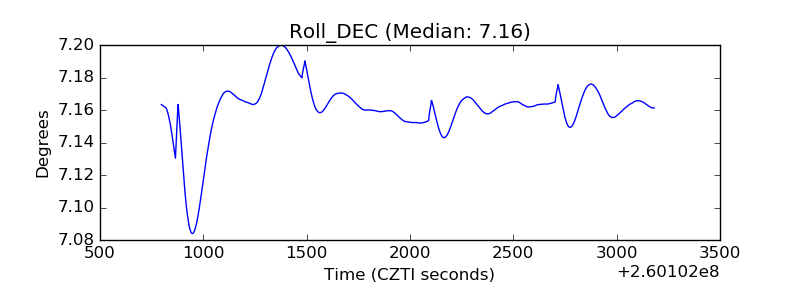 |
| _Roll_RA |  |
| Veto Counter |  |