| Param | Original file | Final file |
|---|---|---|
| Filename | modeM0/AS1T02_038T01_9000001994_13535cztM0_level2.evt | modeM0/AS1T02_038T01_9000001994_13535cztM0_level2_quad_clean.evt |
| Size (bytes) | 542,056,320 | 94,608,000 |
| Size | 516.9 MB | 90.2 MB |
| Events in quadrant A | 4,300,115 | 607,136 |
| Events in quadrant B | 3,822,402 | 608,992 |
| Events in quadrant C | 4,049,382 | 606,347 |
| Events in quadrant D | 3,785,208 | 570,591 |
| Mode M0 | |||
|---|---|---|---|
| Quadrant | BADHDUFLAG | Total packets | Discarded packets |
| A | 0 | 17050 | 3 |
| B | 0 | 15308 | 2 |
| C | 0 | 16232 | 2 |
| D | 0 | 15287 | 2 |
| Mode SS | |||
|---|---|---|---|
| Quadrant | BADHDUFLAG | Total packets | Discarded packets |
| A | 0 | 138 | 0 |
| B | 0 | 138 | 0 |
| C | 0 | 138 | 0 |
| D | 0 | 138 | 0 |
| Mode M9 | |||
|---|---|---|---|
| Quadrant | BADHDUFLAG | Total packets | Discarded packets |
| A | 0 | 13 | 0 |
| B | 0 | 13 | 0 |
| C | 0 | 13 | 0 |
| D | 0 | 14 | 0 |
| Quadrant | Total seconds | Saturated seconds | Saturation percentage |
|---|---|---|---|
| A | 6769 | 200 | 2.954646% |
| B | 6769 | 162 | 2.393263% |
| C | 6769 | 130 | 1.920520% |
| D | 6769 | 134 | 1.979613% |
Noise dominated data is calculated using 1-second bins in cleaned event files. If a bin has >2000 counts, and if more than 50% of those come from <1% of pixels, then it is considered to be noise-dominated and hence unusable.
| Quadrant | # 1 sec bins | Bins with >0 counts | Bins with >2000 counts | High rate bins dominated by noise | Noise dominated (total time) | Noise dominated (detector-on time) | Marked lightcurve |
|---|---|---|---|---|---|---|---|
| A | 7790 | 6770 | 6 | 6 | 0.08% | 0.09% | 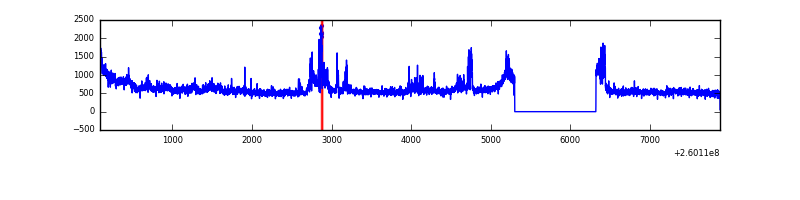 |
| B | 7790 | 6770 | 3 | 3 | 0.04% | 0.04% | 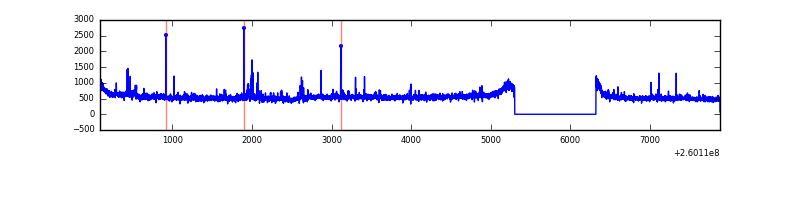 |
| C | 7790 | 6770 | 6 | 6 | 0.08% | 0.09% | 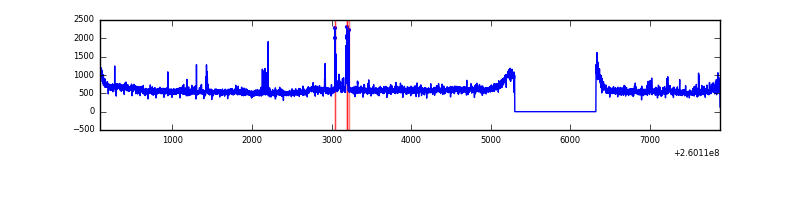 |
| D | 7790 | 6770 | 25 | 25 | 0.32% | 0.37% | 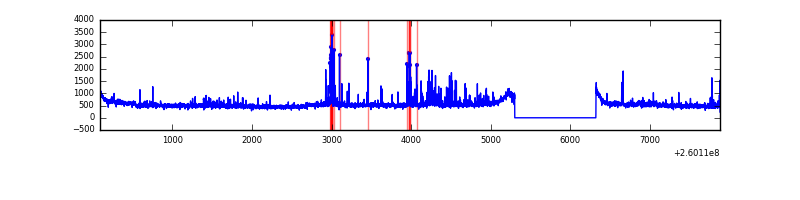 |
Top three noisy pixels from each quadrant. If the there are fewer than three noisy pixels in the level2.evt file, extra rows are filled as -1
| Pixel properties | Quadrant properties | ||||||
|---|---|---|---|---|---|---|---|
| Quadrant | DetID | PixID | Counts | Sigma | Mean | Median | Sigma |
| A | 14 | 238 | 641573 | 3234.7 | 947 | 932 | 198.1 |
| A | 1 | 162 | 12964 | 60.75 | 947 | 932 | 198.1 |
| A | 0 | 226 | 8416 | 37.79 | 947 | 932 | 198.1 |
| B | 3 | 64 | 30999 | 163.08 | 940 | 920 | 184.4 |
| B | 0 | 189 | 28203 | 147.92 | 940 | 920 | 184.4 |
| B | 0 | 197 | 27618 | 144.75 | 940 | 920 | 184.4 |
| C | 3 | 233 | 411988 | 1912.21 | 920 | 932 | 215.0 |
| C | 12 | 4 | 52080 | 237.94 | 920 | 932 | 215.0 |
| C | 13 | 61 | 6580 | 26.27 | 920 | 932 | 215.0 |
| D | 13 | 104 | 108811 | 478.51 | 919 | 899 | 225.5 |
| D | 8 | 195 | 76592 | 335.65 | 919 | 899 | 225.5 |
| D | 2 | 14 | 64563 | 282.31 | 919 | 899 | 225.5 |
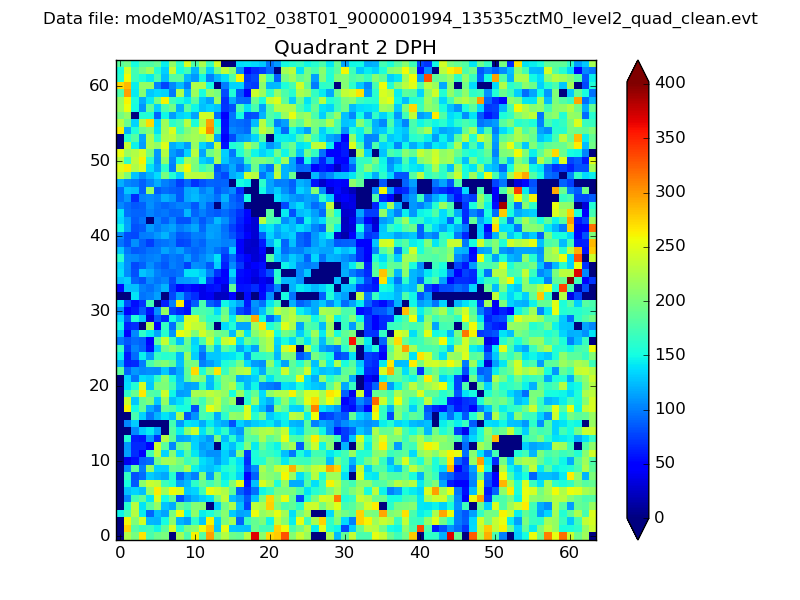
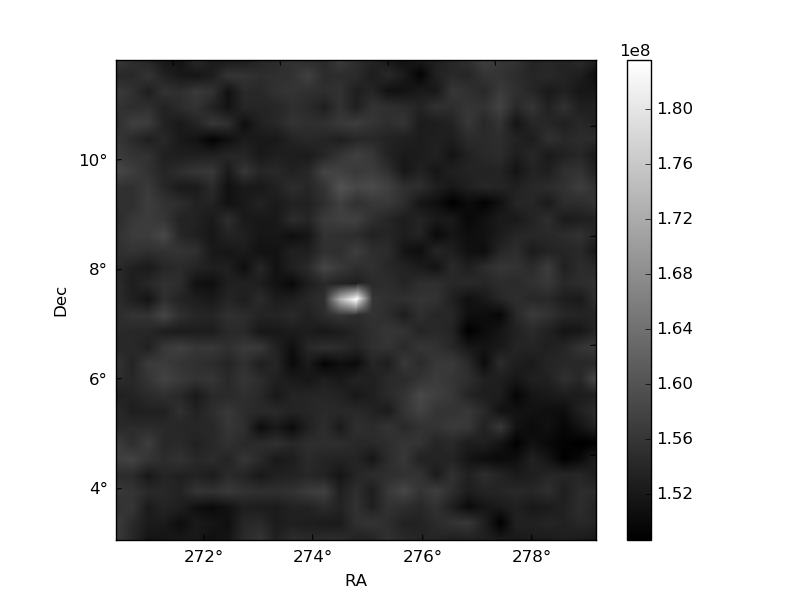
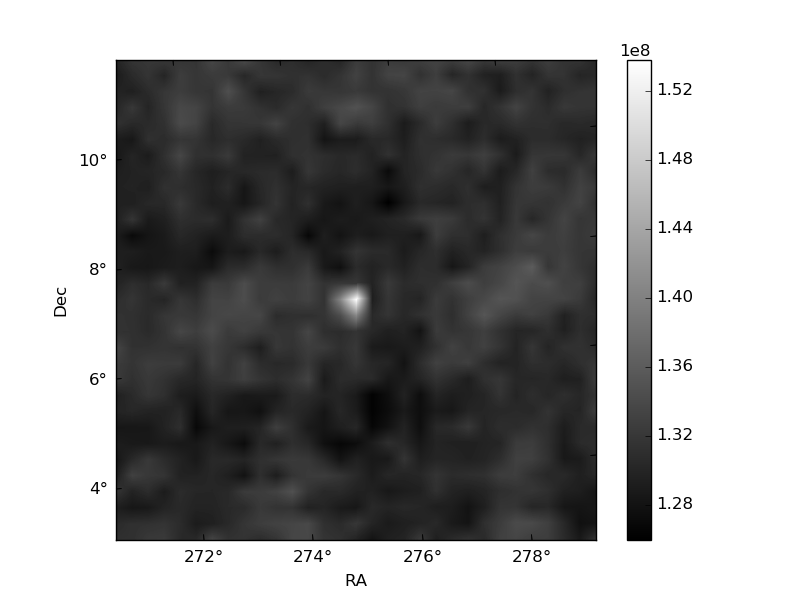
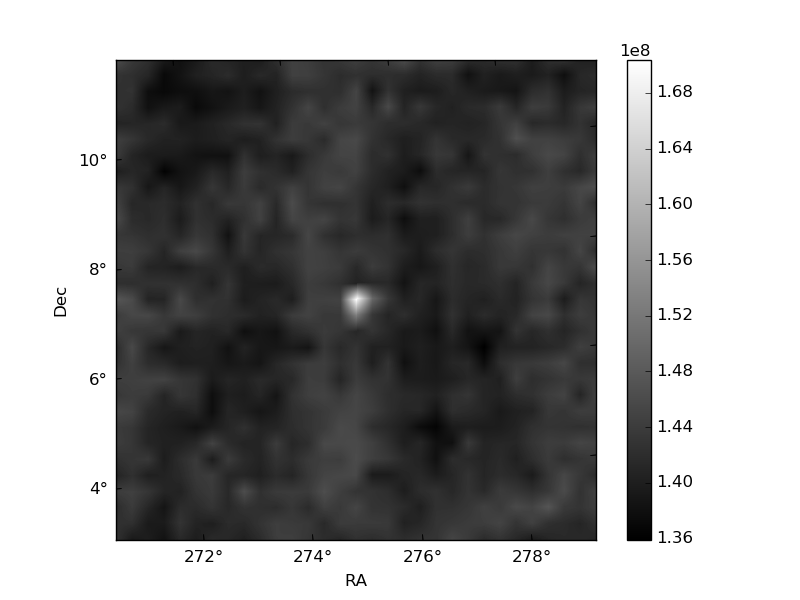
Histogram calculated using DETX and DETY for each event in the final _common_clean file
| Quadrant A | 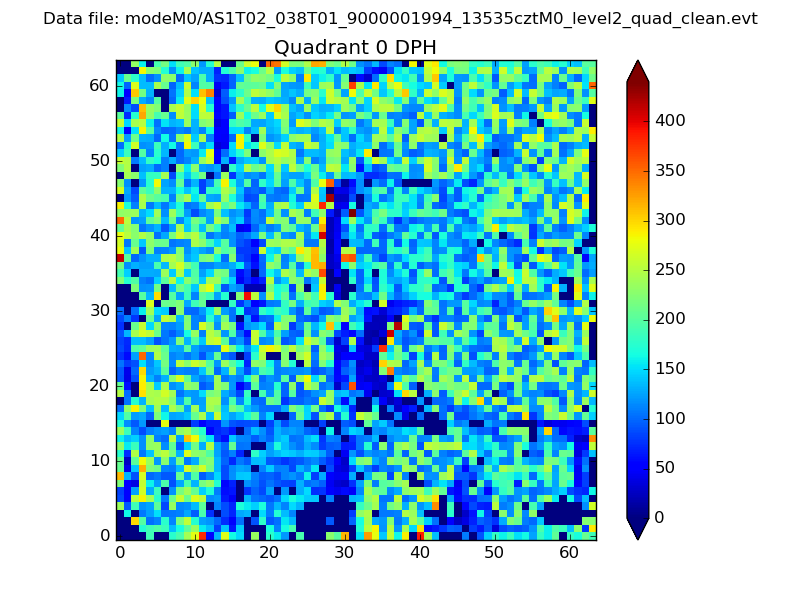 |
 |
Quadrant B |
|---|---|---|---|
| Quadrant D | 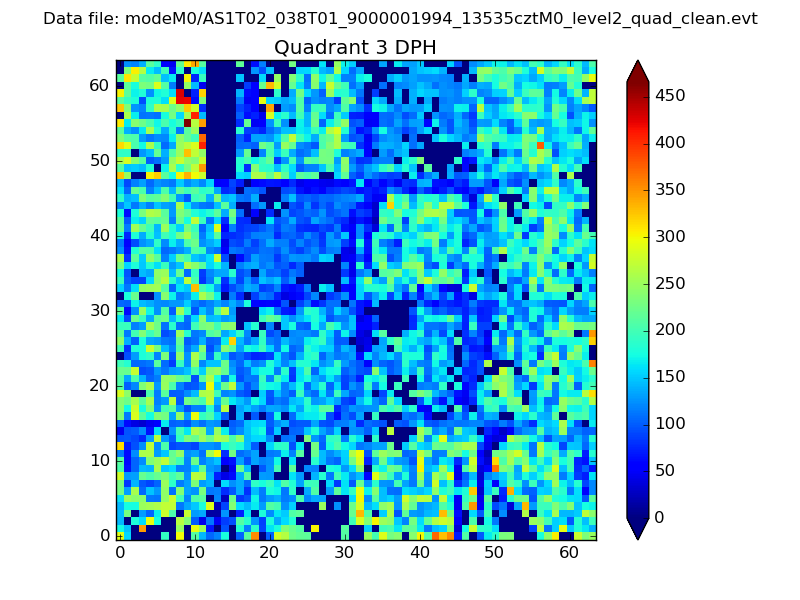 |
 |
Quadrant C |
| Plot type | Count rate plots | Images |
|---|---|---|
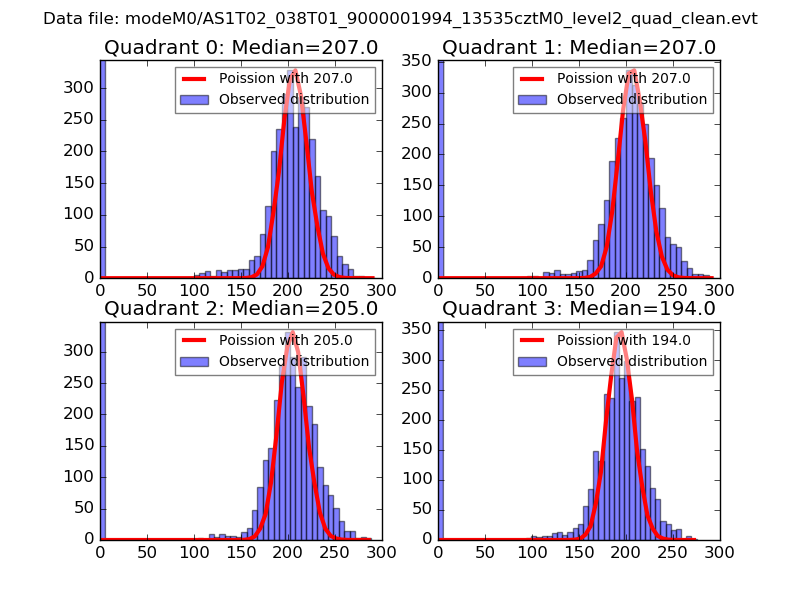
| Comparison with Poisson distribution Blue bars denote a histogram of data divided into 1 sec bins. Red curve is a Poisson curve with rate = median count rate of data. |
 |
 |
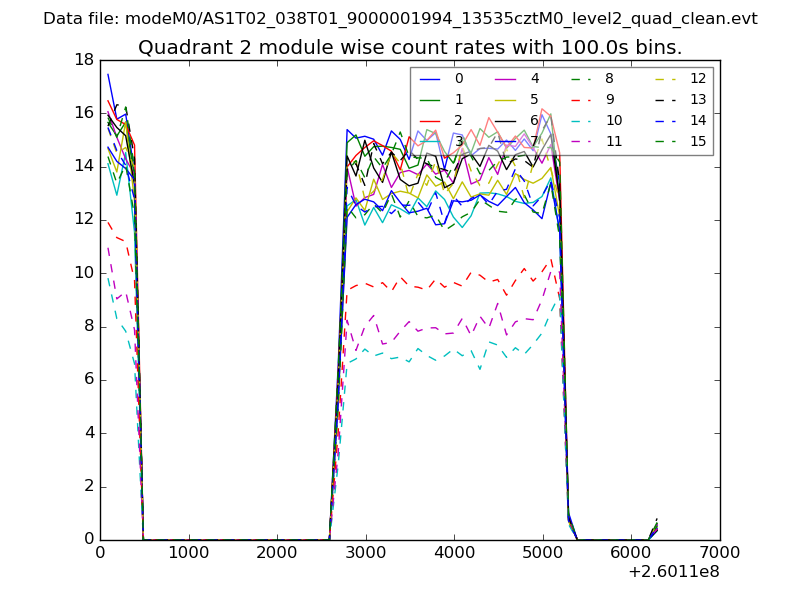
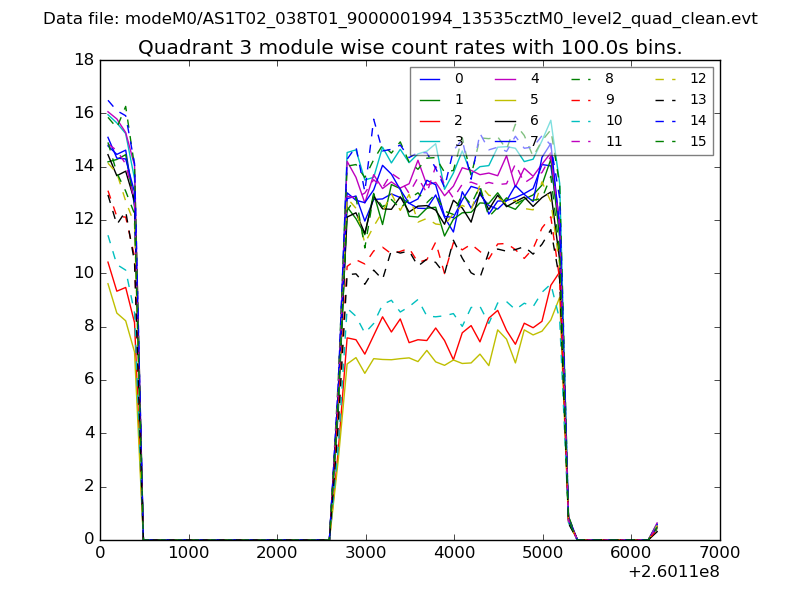
| Quadrant-wise count rates Data is divided into 100 sec bins |
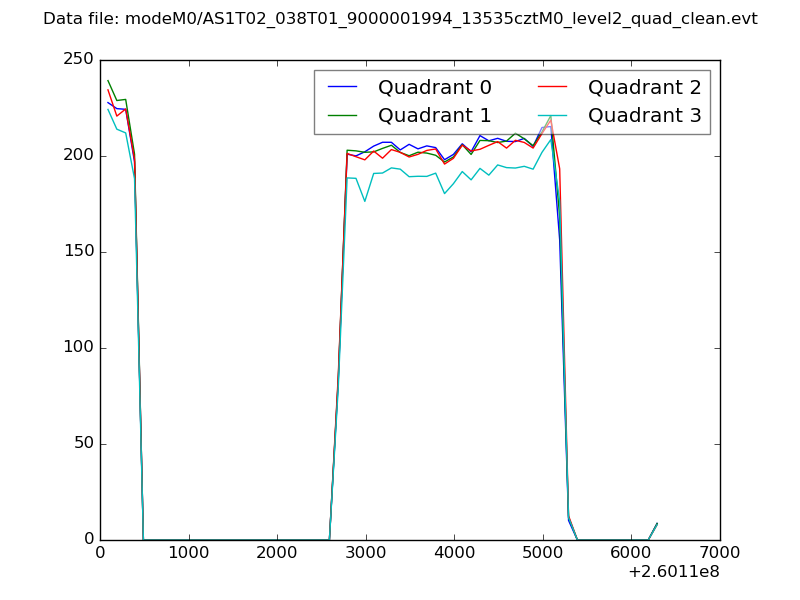 |
|
| Module-wise count rates for Quadrant A Data is divided into 100 sec bins |
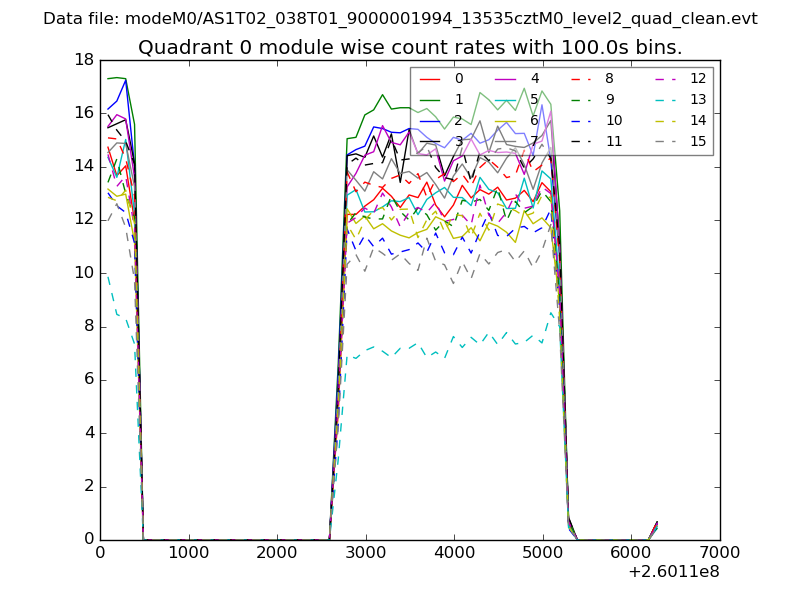 |
 |
| Module-wise count rates for Quadrant B Data is divided into 100 sec bins |
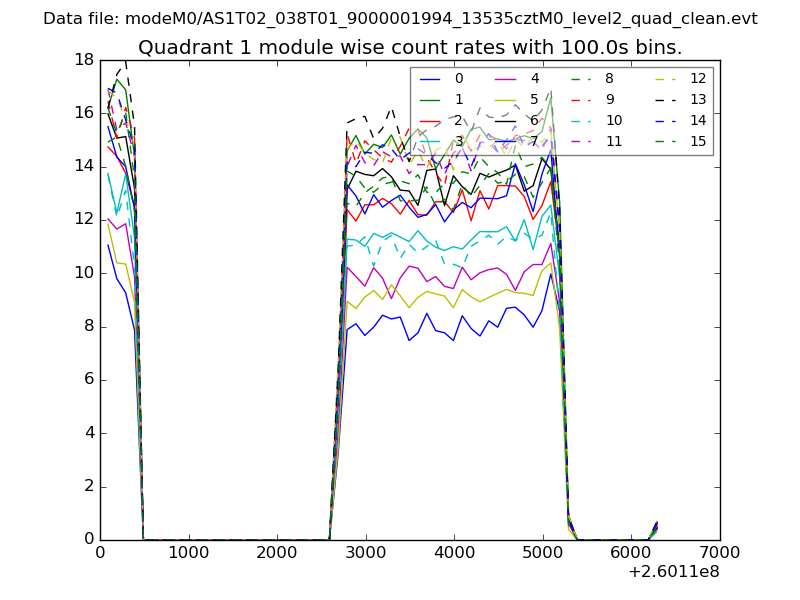 |
 |
| Module-wise count rates for Quadrant C Data is divided into 100 sec bins |
 |
 |
| Module-wise count rates for Quadrant D Data is divided into 100 sec bins |
 |
 |
| Parameter | Plot |
|---|---|
| CZT HV Monitor | 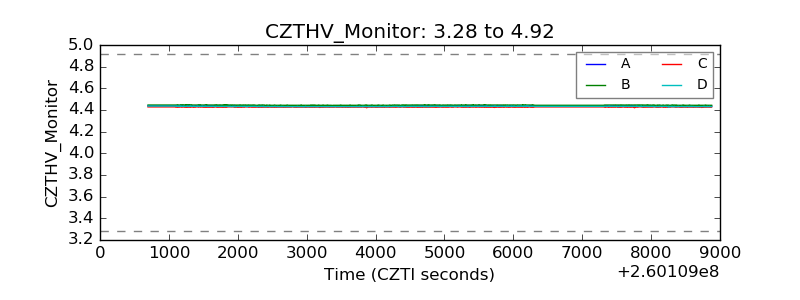 |
| D_VDD | 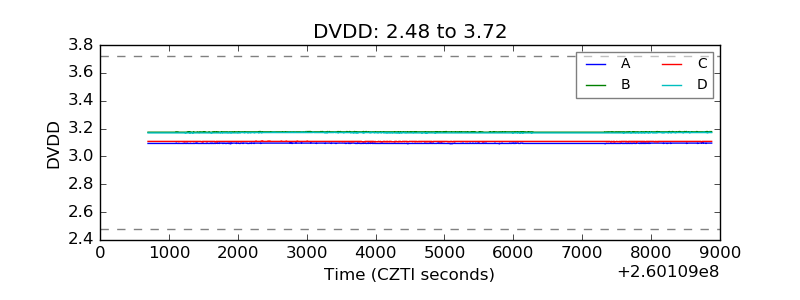 |
| Temperature 1 | 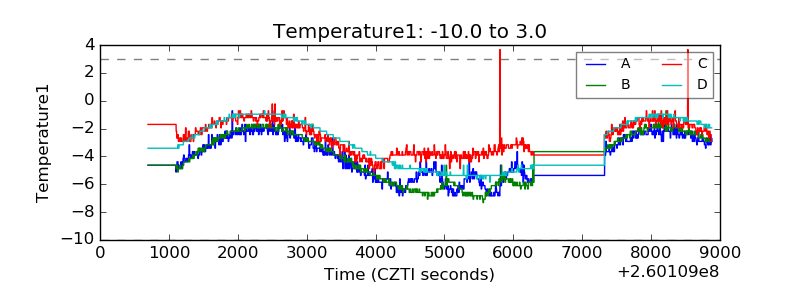 |
| Veto HV Monitor | 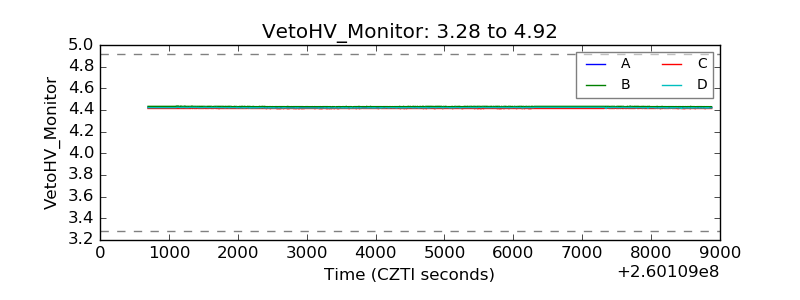 |
| Veto LLD | 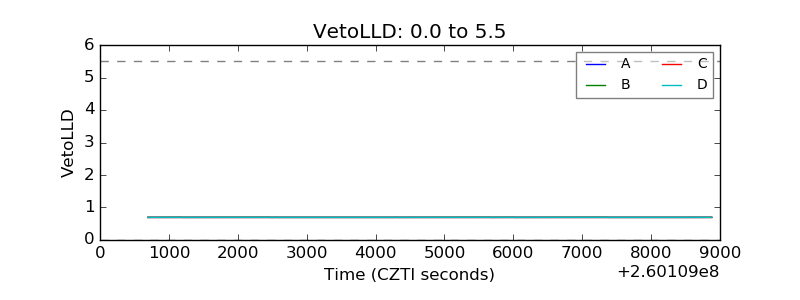 |
| Alpha Counter |  |
| _CPM_Rate | 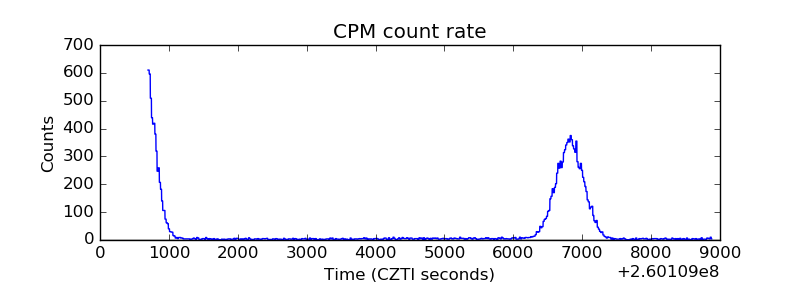 |
| CZT Counter | 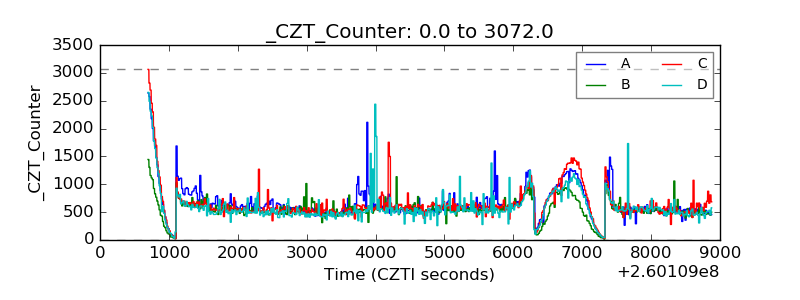 |
| +2.5 Volts monitor |  |
| +5 Volts monitor |  |
| _ROLL_ROT | 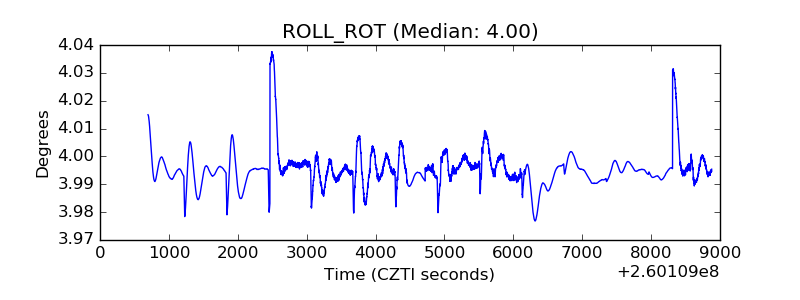 |
| _Roll_DEC | 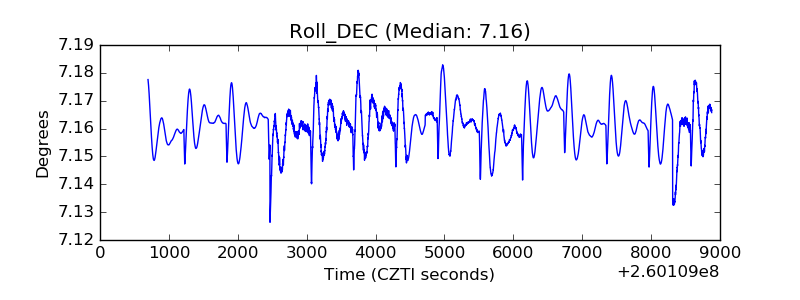 |
| _Roll_RA | 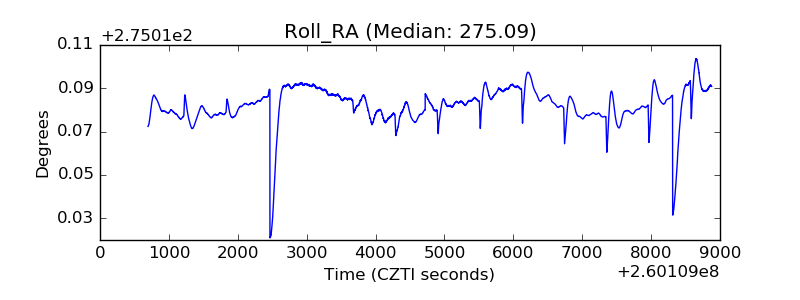 |
| Veto Counter | 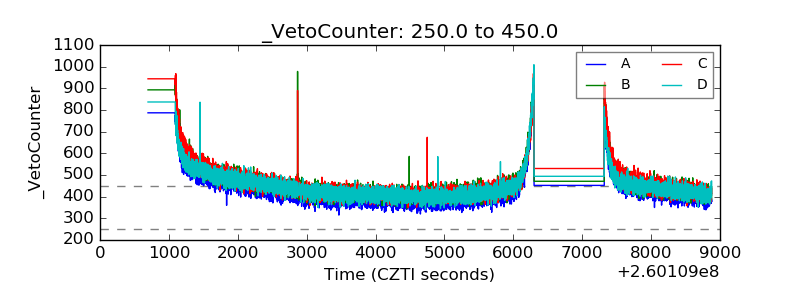 |