| Param | Original file | Final file |
|---|---|---|
| Filename | modeM0/AS1T02_038T01_9000001994_13536cztM0_level2.evt | modeM0/AS1T02_038T01_9000001994_13536cztM0_level2_quad_clean.evt |
| Size (bytes) | 548,159,040 | 100,886,400 |
| Size | 522.8 MB | 96.2 MB |
| Events in quadrant A | 3,968,495 | 653,508 |
| Events in quadrant B | 4,134,083 | 649,432 |
| Events in quadrant C | 4,190,823 | 647,697 |
| Events in quadrant D | 3,828,029 | 611,851 |
| Mode M0 | |||
|---|---|---|---|
| Quadrant | BADHDUFLAG | Total packets | Discarded packets |
| A | 0 | 15850 | 3 |
| B | 0 | 16401 | 2 |
| C | 0 | 16764 | 2 |
| D | 0 | 15561 | 2 |
| Mode SS | |||
|---|---|---|---|
| Quadrant | BADHDUFLAG | Total packets | Discarded packets |
| A | 0 | 144 | 0 |
| B | 0 | 144 | 0 |
| C | 0 | 144 | 0 |
| D | 0 | 144 | 0 |
| Mode M9 | |||
|---|---|---|---|
| Quadrant | BADHDUFLAG | Total packets | Discarded packets |
| A | 0 | 10 | 0 |
| B | 0 | 10 | 0 |
| C | 0 | 10 | 0 |
| D | 0 | 11 | 0 |
| Quadrant | Total seconds | Saturated seconds | Saturation percentage |
|---|---|---|---|
| A | 7075 | 135 | 1.908127% |
| B | 7075 | 178 | 2.515901% |
| C | 7075 | 107 | 1.512367% |
| D | 7075 | 104 | 1.469965% |
Noise dominated data is calculated using 1-second bins in cleaned event files. If a bin has >2000 counts, and if more than 50% of those come from <1% of pixels, then it is considered to be noise-dominated and hence unusable.
| Quadrant | # 1 sec bins | Bins with >0 counts | Bins with >2000 counts | High rate bins dominated by noise | Noise dominated (total time) | Noise dominated (detector-on time) | Marked lightcurve |
|---|---|---|---|---|---|---|---|
| A | 7806 | 7076 | 0 | 0 | 0.00% | 0.00% | 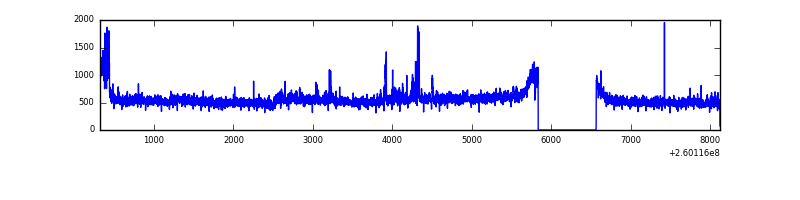 |
| B | 7806 | 7076 | 24 | 24 | 0.31% | 0.34% | 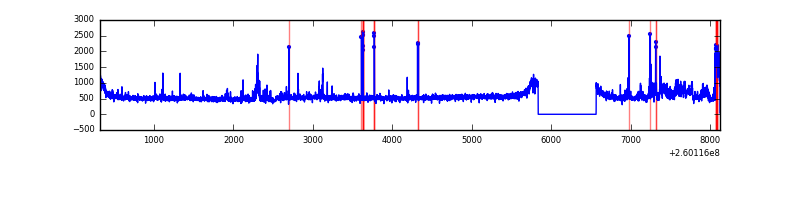 |
| C | 7806 | 7076 | 0 | 0 | 0.00% | 0.00% | 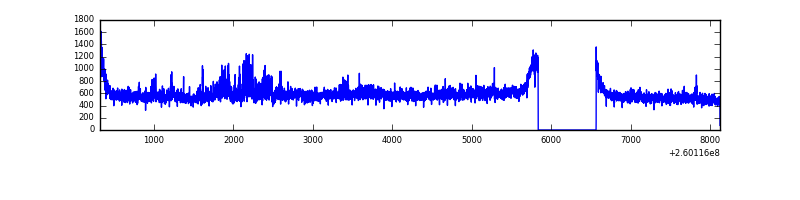 |
| D | 7806 | 7076 | 8 | 8 | 0.10% | 0.11% | 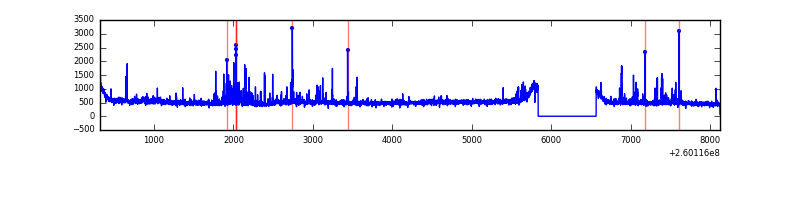 |
Top three noisy pixels from each quadrant. If the there are fewer than three noisy pixels in the level2.evt file, extra rows are filled as -1
| Pixel properties | Quadrant properties | ||||||
|---|---|---|---|---|---|---|---|
| Quadrant | DetID | PixID | Counts | Sigma | Mean | Median | Sigma |
| A | 14 | 238 | 191659 | 936.04 | 967 | 952 | 203.7 |
| A | 1 | 162 | 25269 | 119.35 | 967 | 952 | 203.7 |
| A | 10 | 229 | 20760 | 97.22 | 967 | 952 | 203.7 |
| B | 3 | 64 | 262902 | 1387.33 | 957 | 939 | 188.8 |
| B | 0 | 189 | 72730 | 380.2 | 957 | 939 | 188.8 |
| B | 4 | 173 | 21754 | 110.23 | 957 | 939 | 188.8 |
| C | 3 | 233 | 543372 | 2443.03 | 936 | 948 | 222.0 |
| C | 13 | 61 | 6585 | 25.39 | 936 | 948 | 222.0 |
| C | 3 | 202 | 2170 | 5.5 | 936 | 948 | 222.0 |
| D | 13 | 104 | 113482 | 487.56 | 934 | 913 | 230.9 |
| D | 12 | 110 | 74570 | 319.02 | 934 | 913 | 230.9 |
| D | 8 | 195 | 56682 | 241.55 | 934 | 913 | 230.9 |
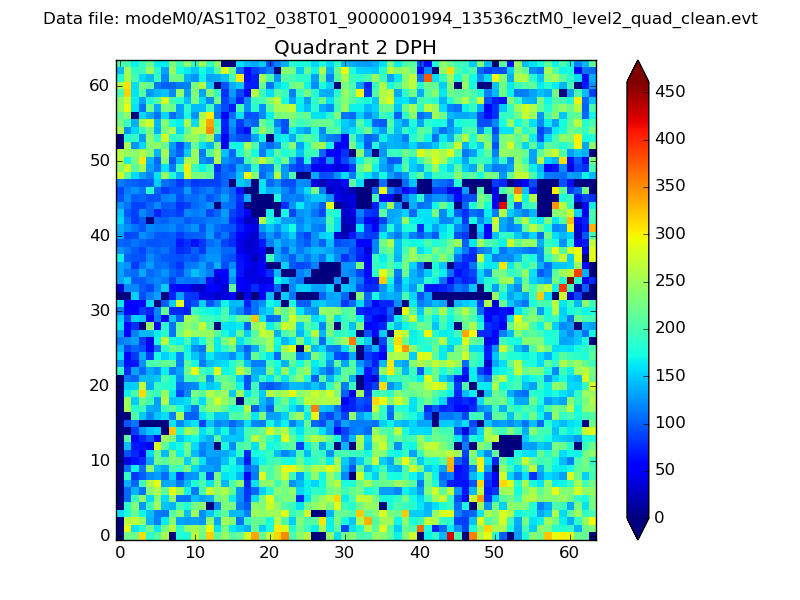
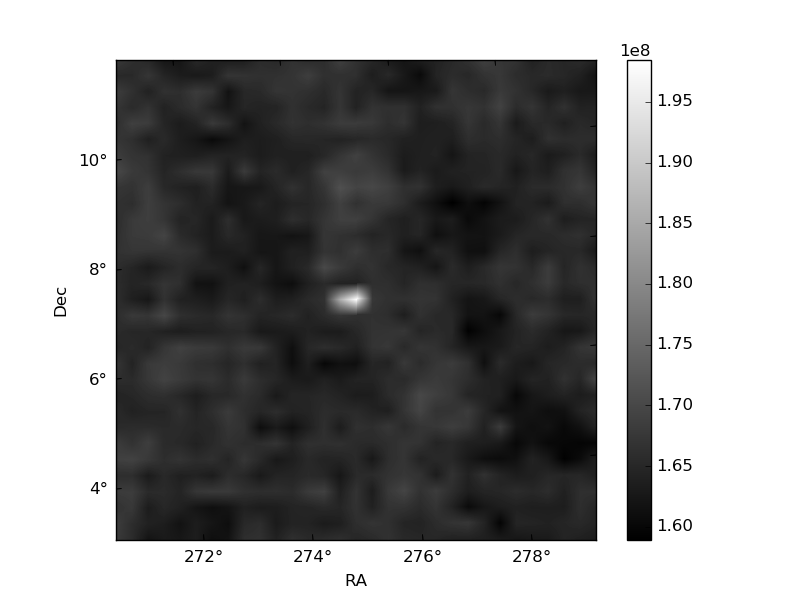
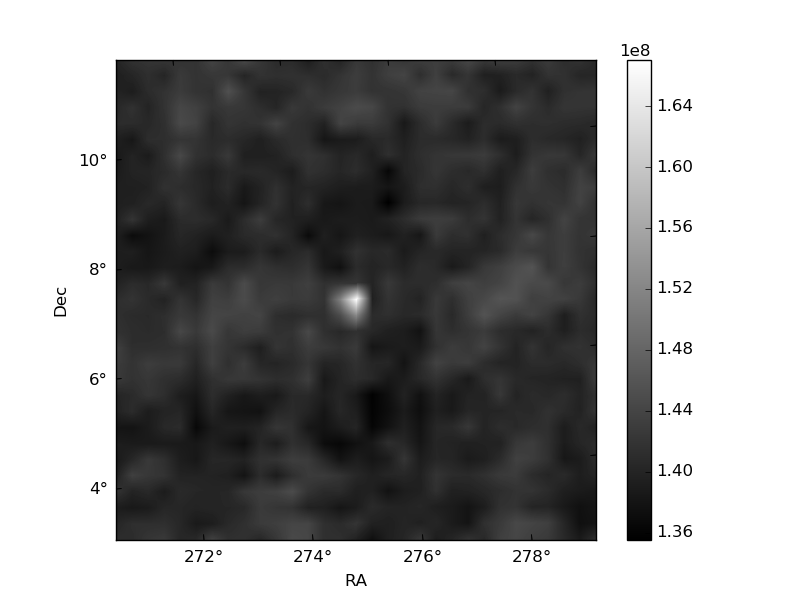
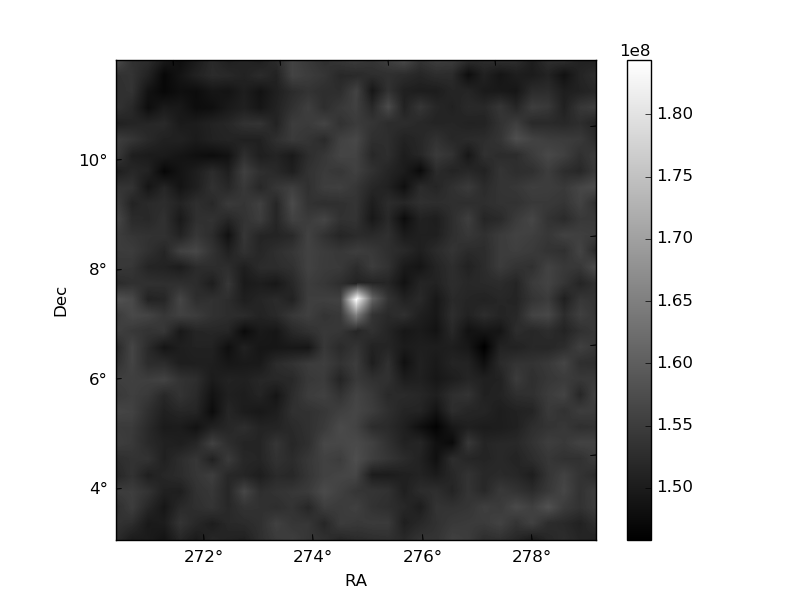
Histogram calculated using DETX and DETY for each event in the final _common_clean file
| Quadrant A | 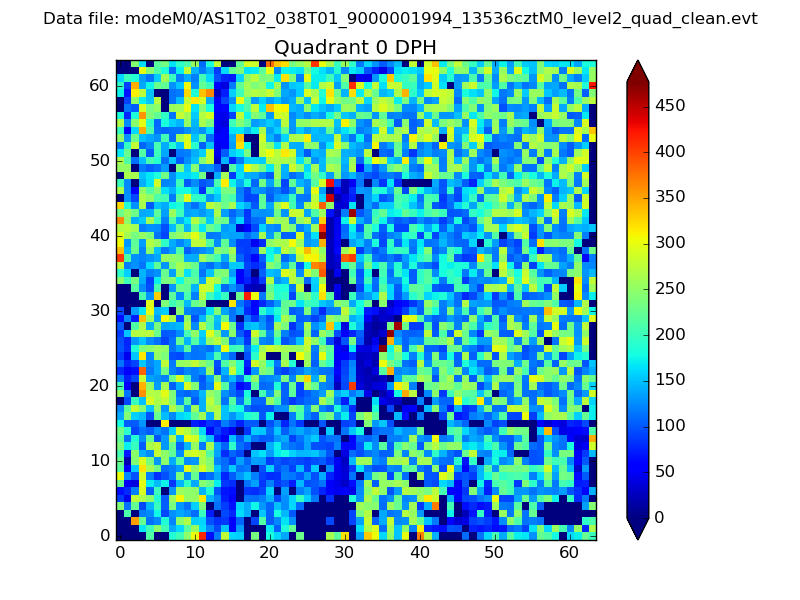 |
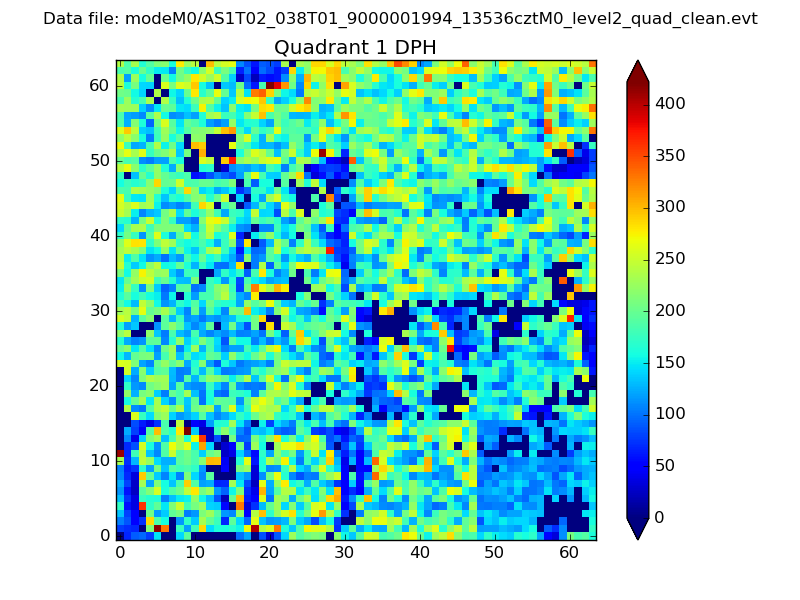 |
Quadrant B |
|---|---|---|---|
| Quadrant D | 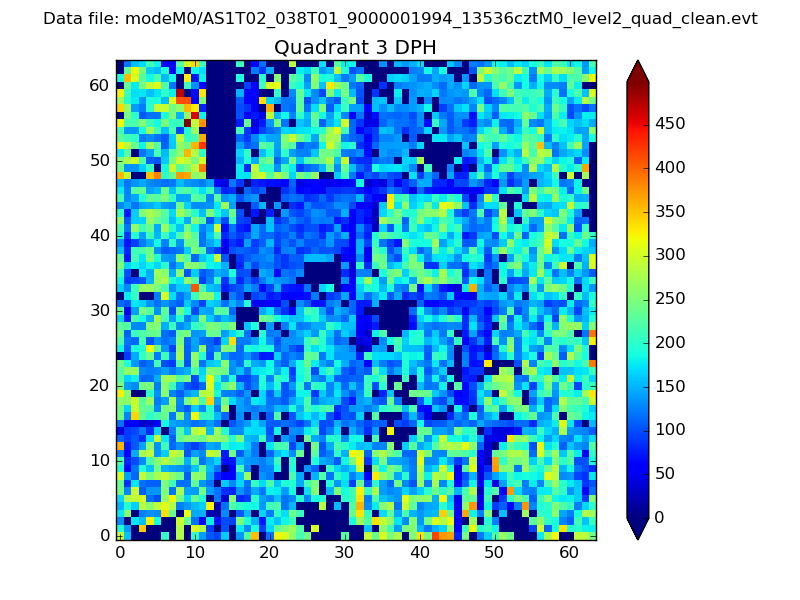 |
 |
Quadrant C |
| Plot type | Count rate plots | Images |
|---|---|---|
| Comparison with Poisson distribution Blue bars denote a histogram of data divided into 1 sec bins. Red curve is a Poisson curve with rate = median count rate of data. |
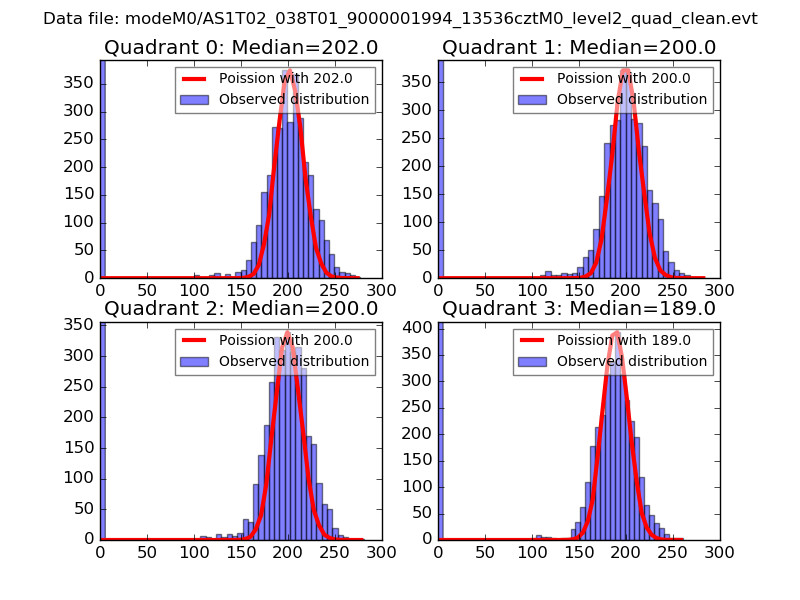 |
 |
| Quadrant-wise count rates Data is divided into 100 sec bins |
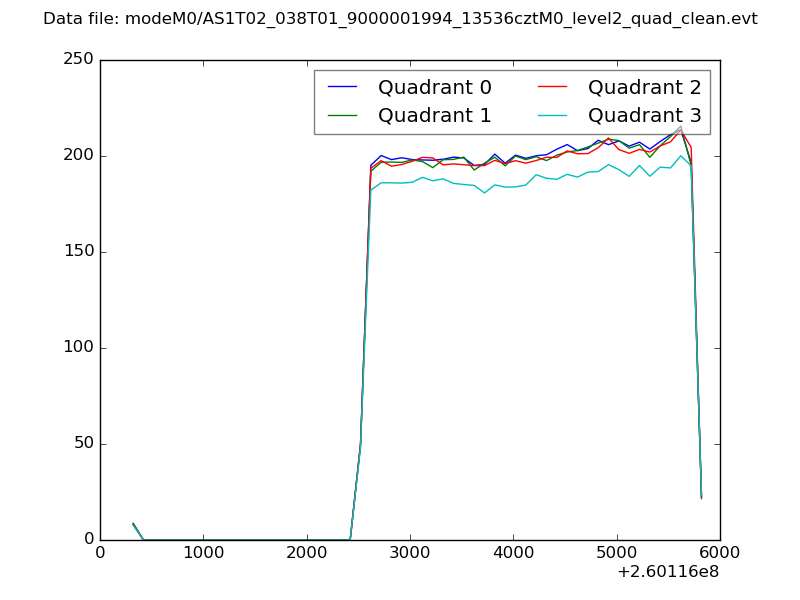 |
|
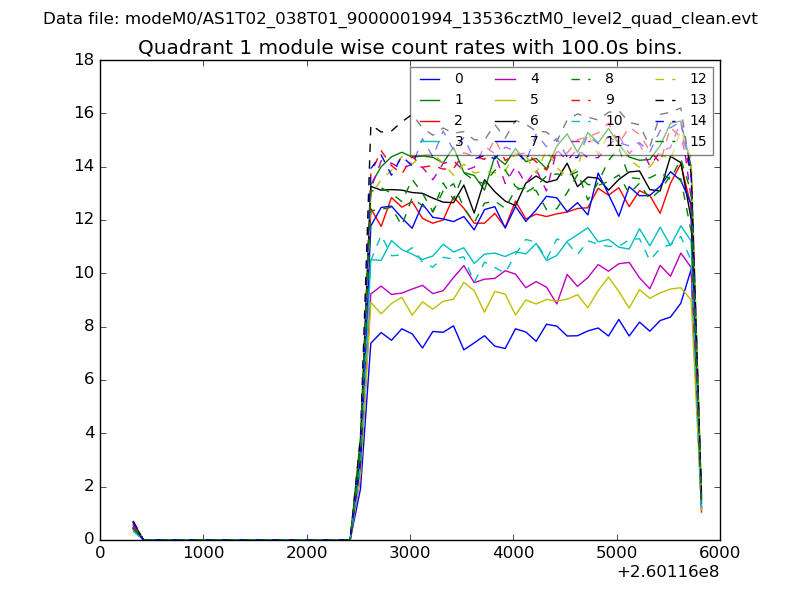
| Module-wise count rates for Quadrant A Data is divided into 100 sec bins |
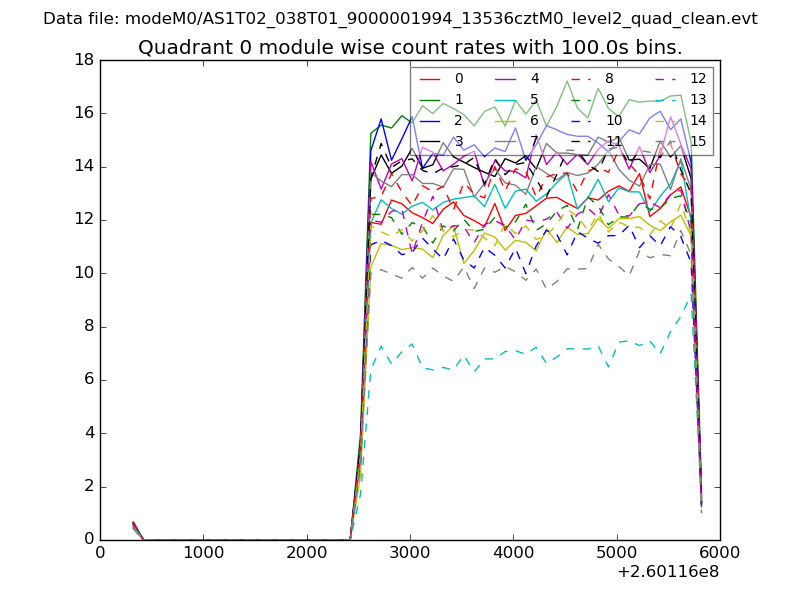 |
 |
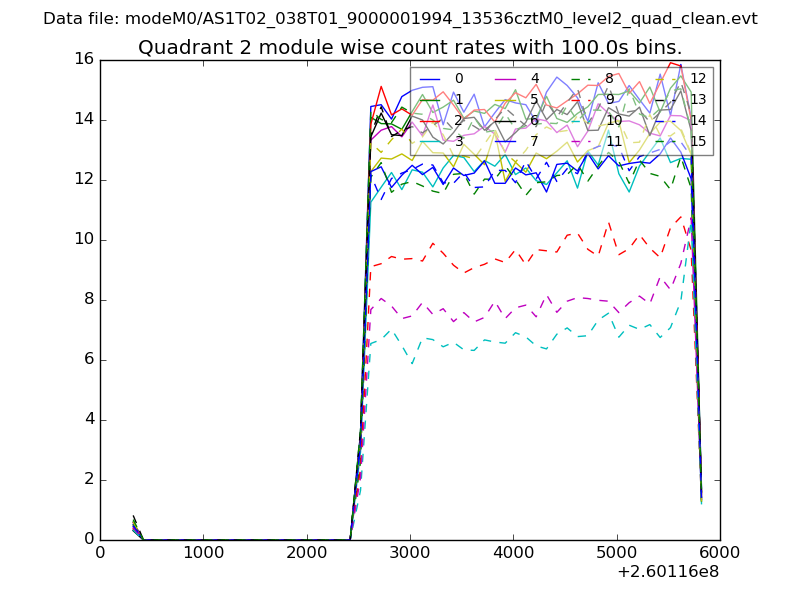
| Module-wise count rates for Quadrant B Data is divided into 100 sec bins |
 |
 |
| Module-wise count rates for Quadrant C Data is divided into 100 sec bins |
 |
 |
| Module-wise count rates for Quadrant D Data is divided into 100 sec bins |
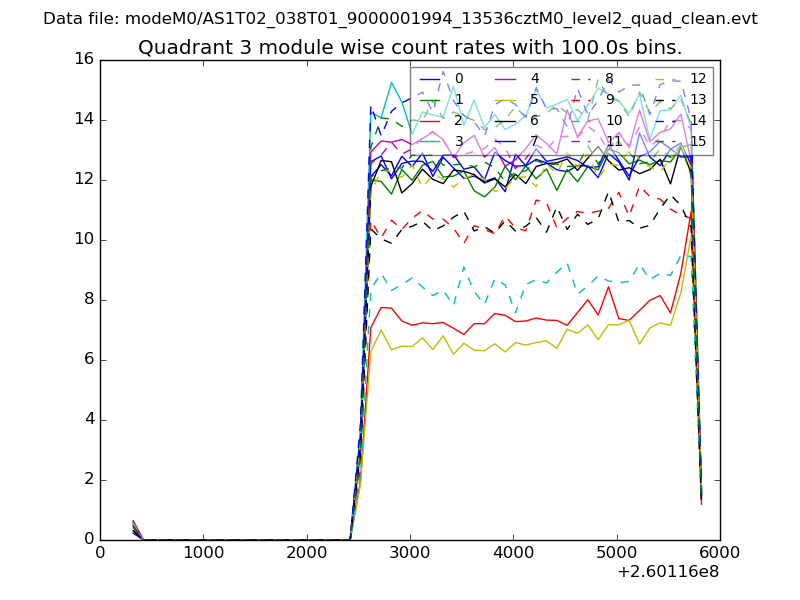 |
 |
| Parameter | Plot |
|---|---|
| CZT HV Monitor | 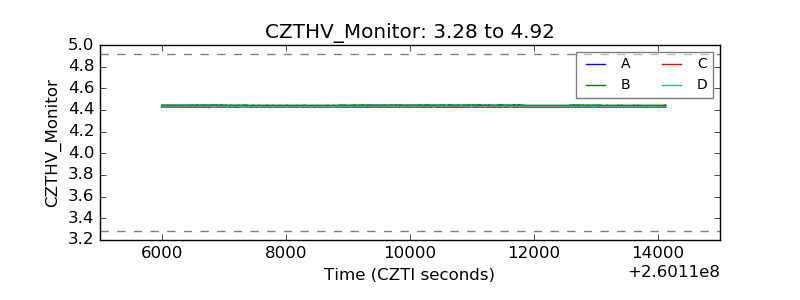 |
| D_VDD | 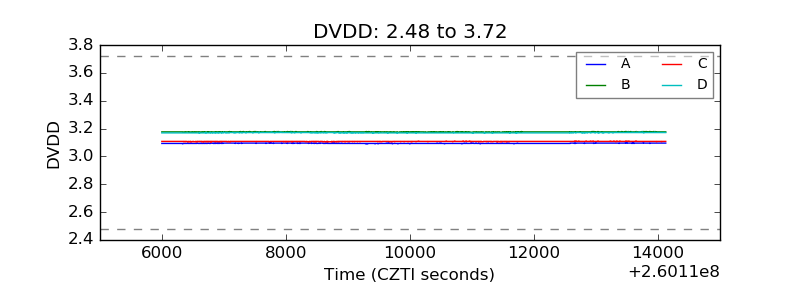 |
| Temperature 1 | 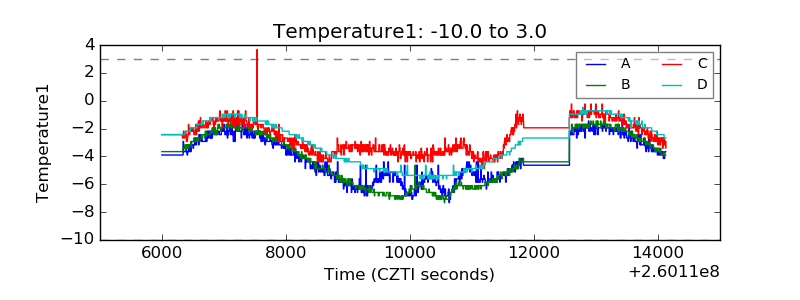 |
| Veto HV Monitor | 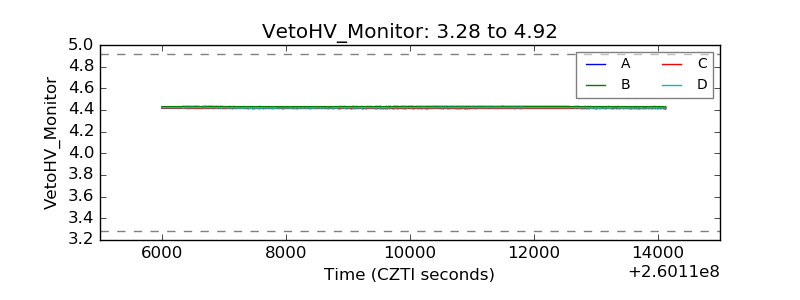 |
| Veto LLD | 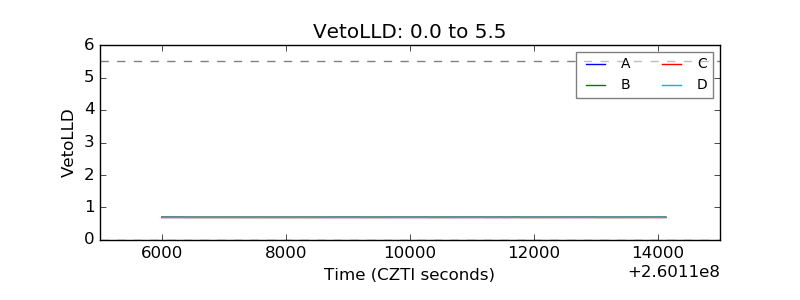 |
| Alpha Counter | 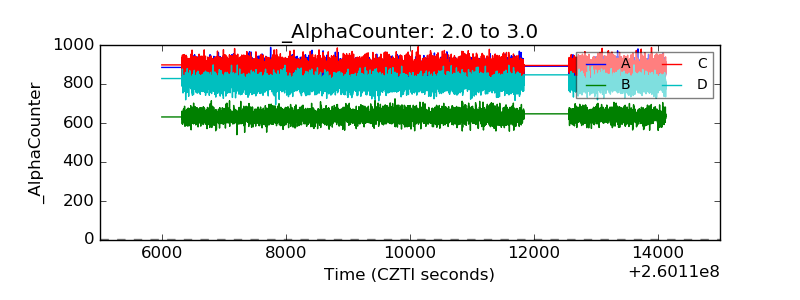 |
| _CPM_Rate | 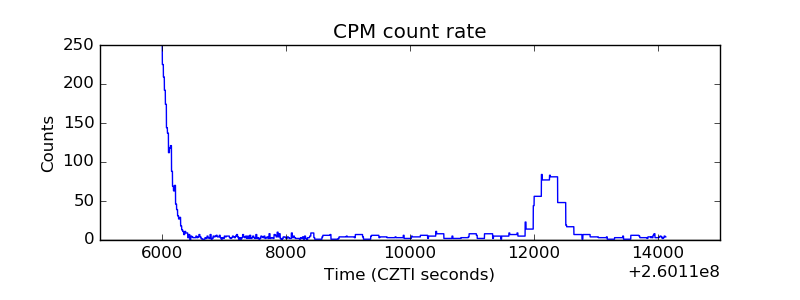 |
| CZT Counter | 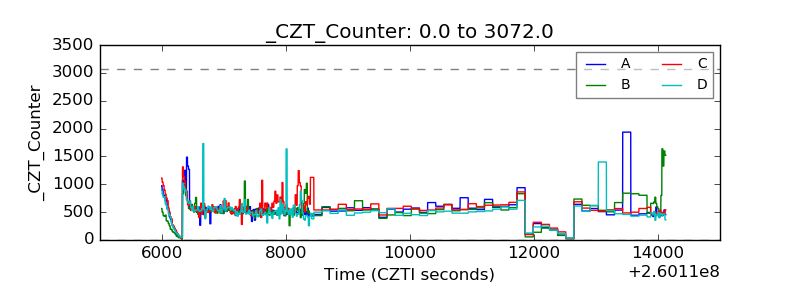 |
| +2.5 Volts monitor |  |
| +5 Volts monitor | 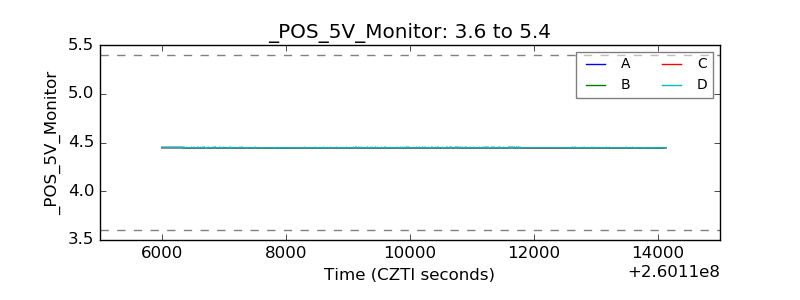 |
| _ROLL_ROT | 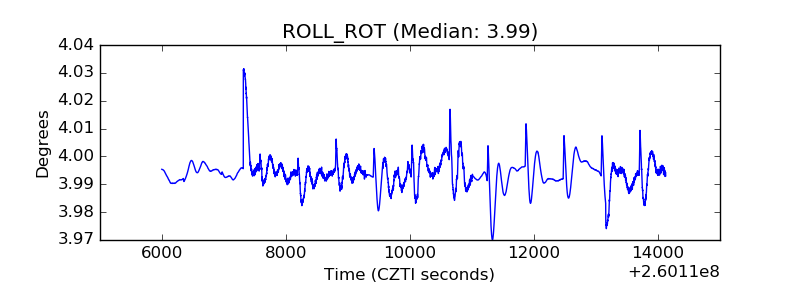 |
| _Roll_DEC |  |
| _Roll_RA | 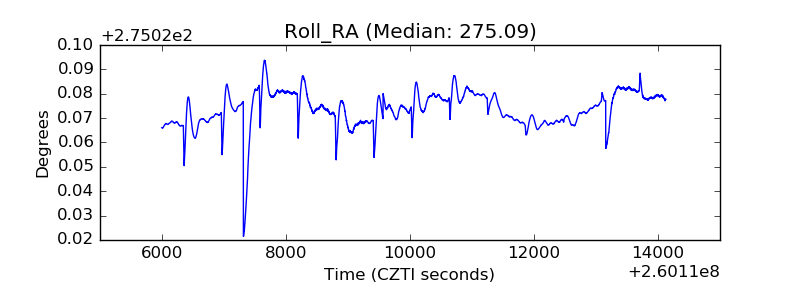 |
| Veto Counter | 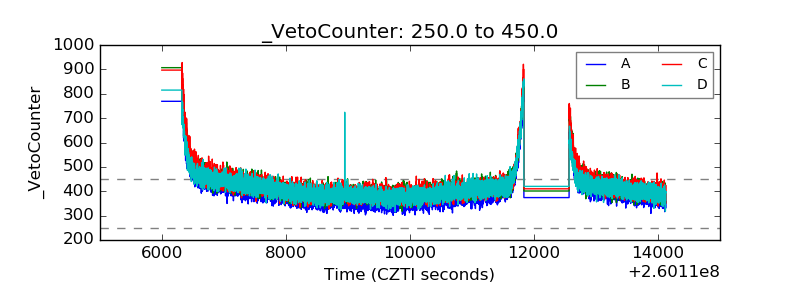 |