| Param | Original file | Final file |
|---|---|---|
| Filename | modeM0/AS1T02_038T01_9000001994_13538cztM0_level2.evt | modeM0/AS1T02_038T01_9000001994_13538cztM0_level2_quad_clean.evt |
| Size (bytes) | 698,296,320 | 114,304,320 |
| Size | 665.9 MB | 109.0 MB |
| Events in quadrant A | 3,732,339 | 789,457 |
| Events in quadrant B | 3,917,103 | 785,263 |
| Events in quadrant C | 4,218,137 | 780,093 |
| Events in quadrant D | 8,797,749 | 609,618 |
| Mode M0 | |||
|---|---|---|---|
| Quadrant | BADHDUFLAG | Total packets | Discarded packets |
| A | 0 | 15048 | 2 |
| B | 0 | 15693 | 1 |
| C | 0 | 17117 | 1 |
| D | 0 | 31084 | 1 |
| Mode SS | |||
|---|---|---|---|
| Quadrant | BADHDUFLAG | Total packets | Discarded packets |
| A | 0 | 146 | 0 |
| B | 0 | 146 | 0 |
| C | 0 | 146 | 0 |
| D | 0 | 146 | 0 |
| Mode M9 | |||
|---|---|---|---|
| Quadrant | BADHDUFLAG | Total packets | Discarded packets |
| A | 0 | 3 | 0 |
| B | 0 | 3 | 0 |
| C | 0 | 3 | 0 |
| D | 0 | 3 | 0 |
| Quadrant | Total seconds | Saturated seconds | Saturation percentage |
|---|---|---|---|
| A | 7131 | 48 | 0.673117% |
| B | 7131 | 84 | 1.177955% |
| C | 7131 | 25 | 0.350582% |
| D | 7131 | 1842 | 25.830879% |
Noise dominated data is calculated using 1-second bins in cleaned event files. If a bin has >2000 counts, and if more than 50% of those come from <1% of pixels, then it is considered to be noise-dominated and hence unusable.
| Quadrant | # 1 sec bins | Bins with >0 counts | Bins with >2000 counts | High rate bins dominated by noise | Noise dominated (total time) | Noise dominated (detector-on time) | Marked lightcurve |
|---|---|---|---|---|---|---|---|
| A | 7432 | 7133 | 1 | 1 | 0.01% | 0.01% | 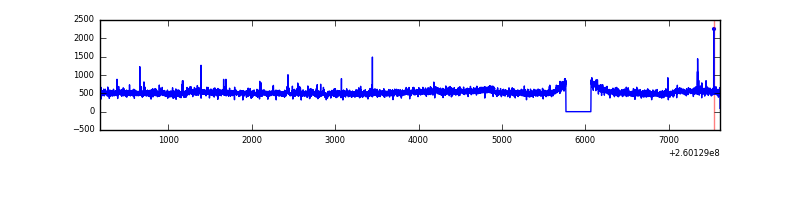 |
| B | 7432 | 7133 | 20 | 20 | 0.27% | 0.28% | 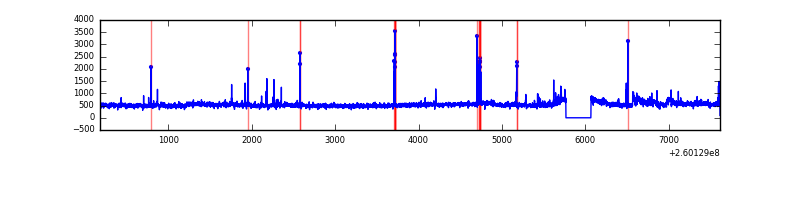 |
| C | 7432 | 7133 | 0 | 0 | 0.00% | 0.00% | 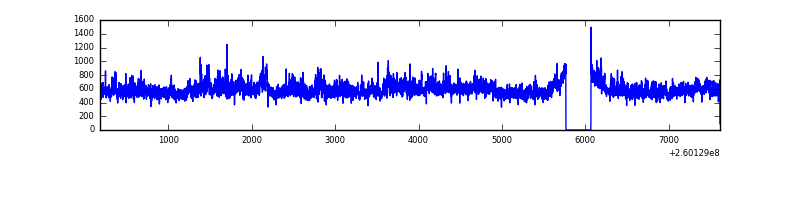 |
| D | 7432 | 7133 | 1578 | 1578 | 21.23% | 22.12% | 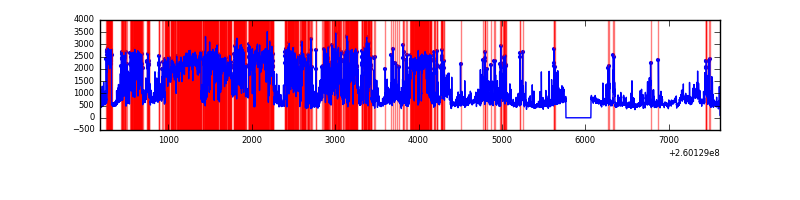 |
Top three noisy pixels from each quadrant. If the there are fewer than three noisy pixels in the level2.evt file, extra rows are filled as -1
| Pixel properties | Quadrant properties | ||||||
|---|---|---|---|---|---|---|---|
| Quadrant | DetID | PixID | Counts | Sigma | Mean | Median | Sigma |
| A | 1 | 162 | 32394 | 150.41 | 953 | 933 | 209.2 |
| A | 1 | 178 | 11108 | 48.64 | 953 | 933 | 209.2 |
| A | 15 | 69 | 11008 | 48.17 | 953 | 933 | 209.2 |
| B | 0 | 182 | 72313 | 378.35 | 947 | 928 | 188.7 |
| B | 3 | 64 | 43366 | 224.93 | 947 | 928 | 188.7 |
| B | 3 | 209 | 28993 | 148.75 | 947 | 928 | 188.7 |
| C | 3 | 233 | 612363 | 2773.24 | 922 | 935 | 220.5 |
| C | 8 | 128 | 6787 | 26.54 | 922 | 935 | 220.5 |
| C | 13 | 61 | 6465 | 25.08 | 922 | 935 | 220.5 |
| D | 13 | 122 | 5141306 | 25420.4 | 806 | 783 | 202.2 |
| D | 5 | 222 | 300552 | 1482.39 | 806 | 783 | 202.2 |
| D | 12 | 110 | 70168 | 343.12 | 806 | 783 | 202.2 |
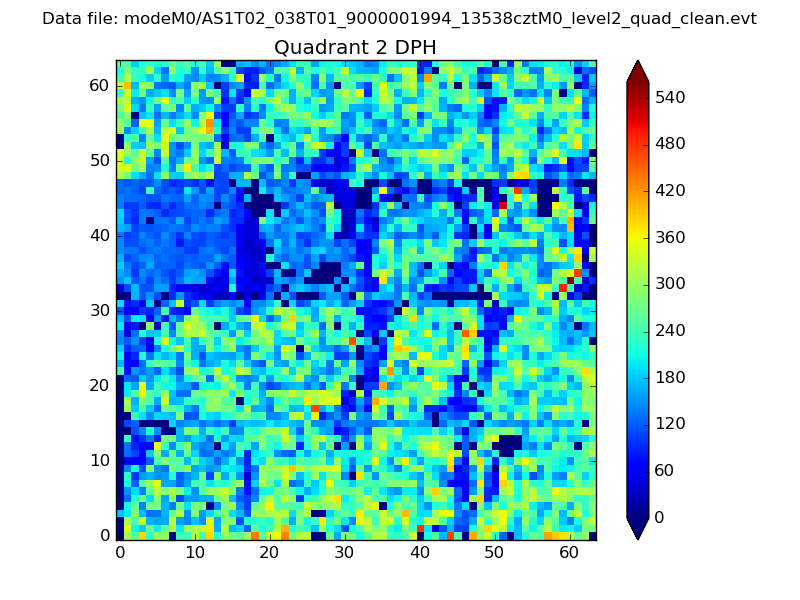
Histogram calculated using DETX and DETY for each event in the final _common_clean file
| Quadrant A | 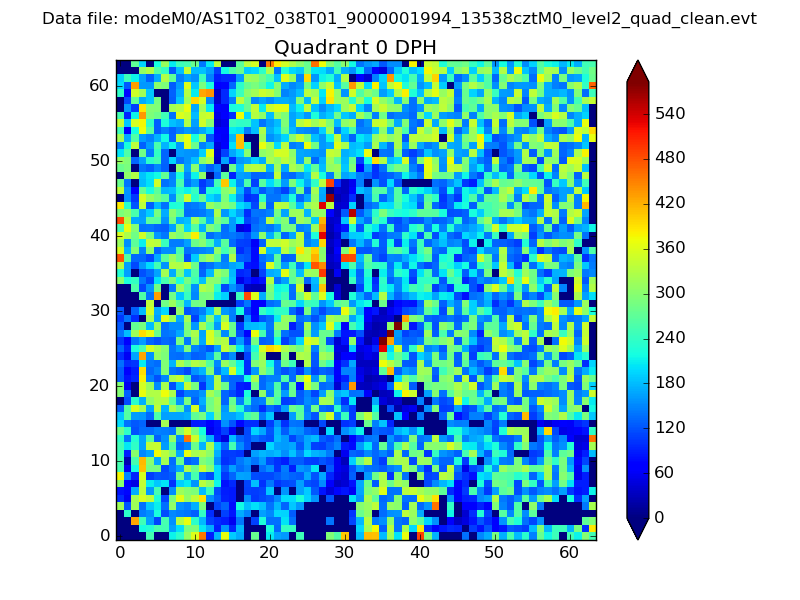 |
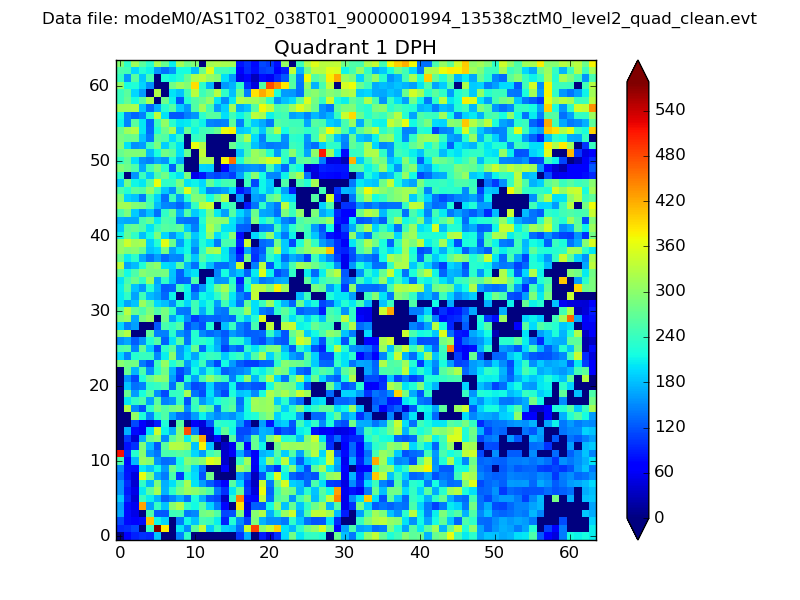 |
Quadrant B |
|---|---|---|---|
| Quadrant D | 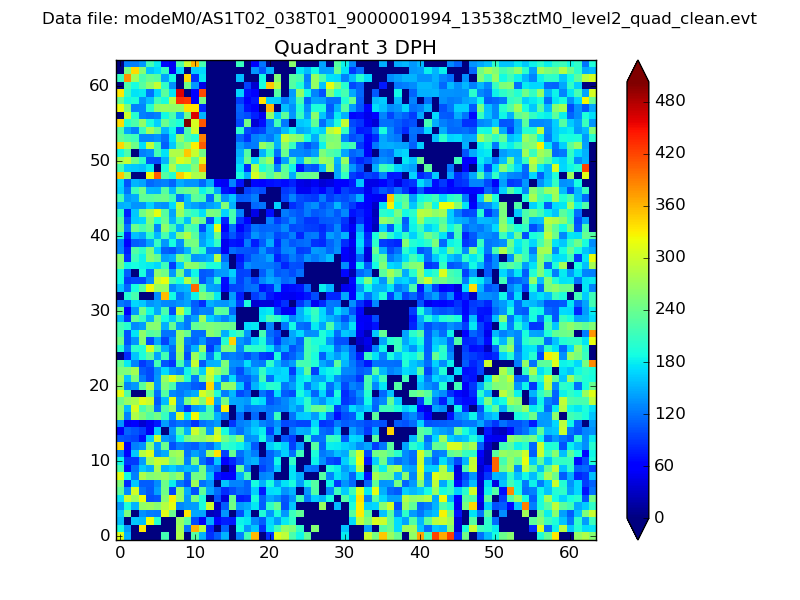 |
 |
Quadrant C |
| Plot type | Count rate plots | Images |
|---|---|---|
| Comparison with Poisson distribution Blue bars denote a histogram of data divided into 1 sec bins. Red curve is a Poisson curve with rate = median count rate of data. |
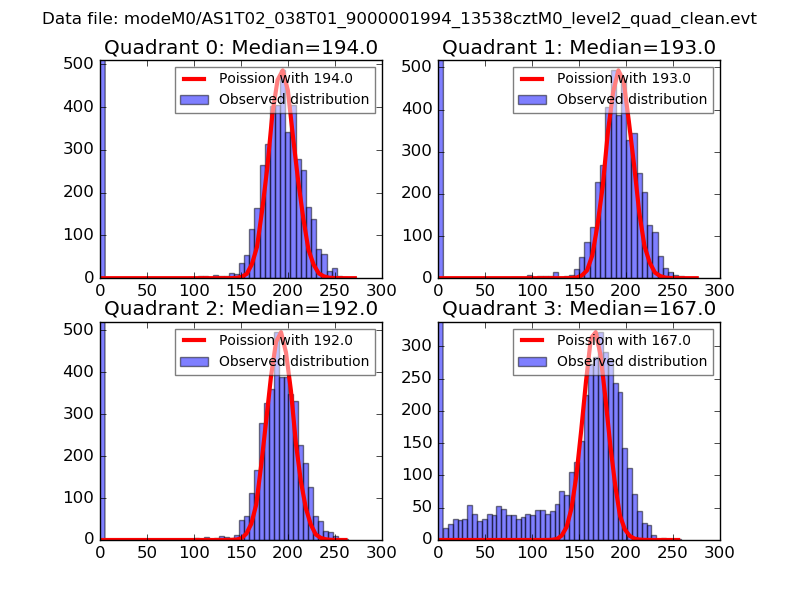 |
 |
| Quadrant-wise count rates Data is divided into 100 sec bins |
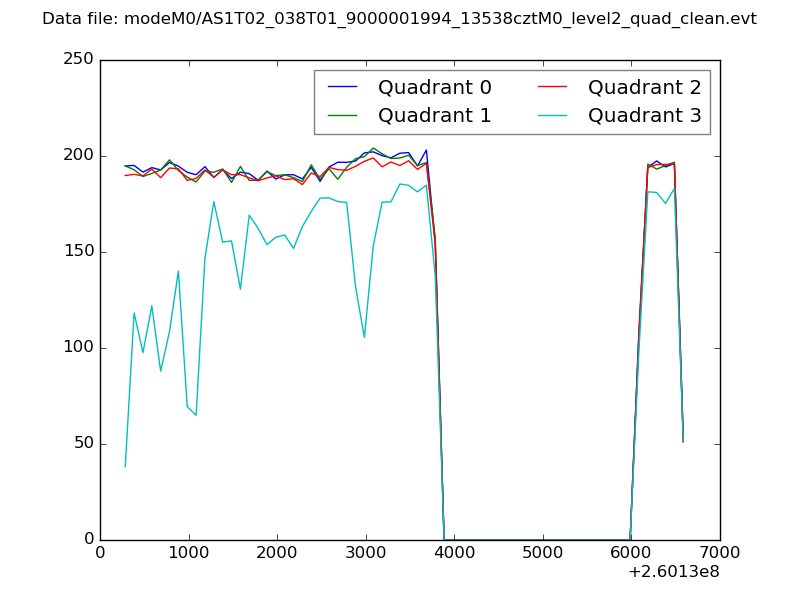 |
|
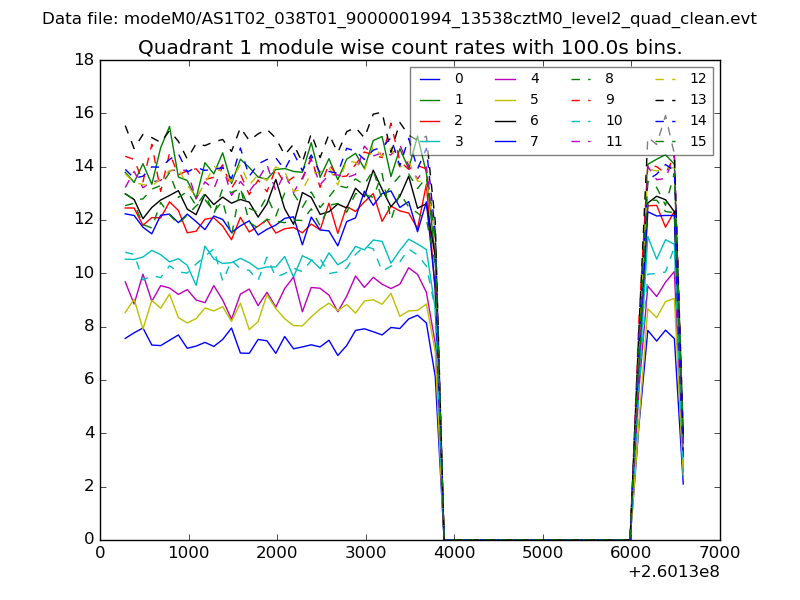
| Module-wise count rates for Quadrant A Data is divided into 100 sec bins |
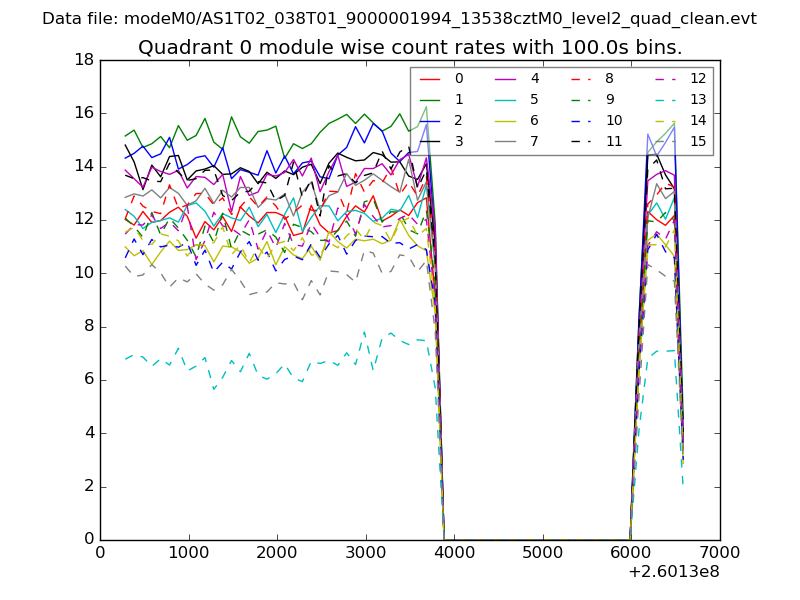 |
 |
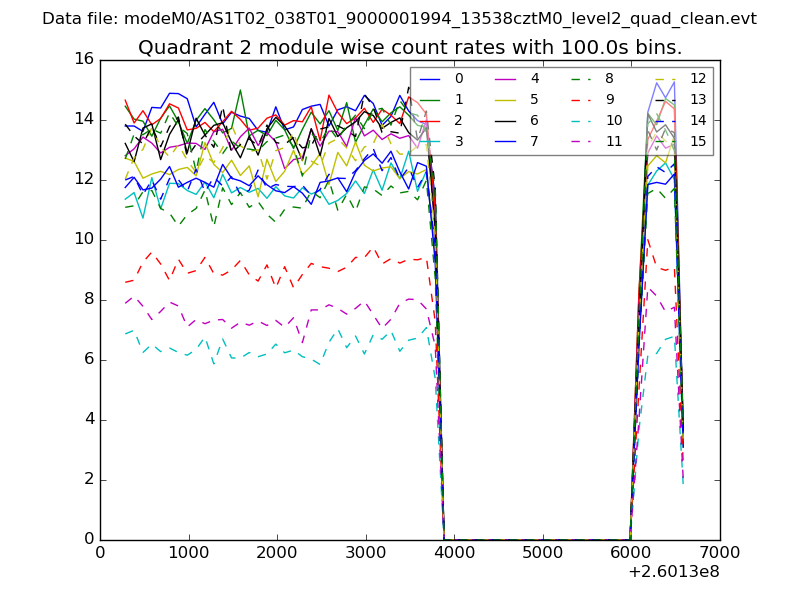
| Module-wise count rates for Quadrant B Data is divided into 100 sec bins |
 |
 |
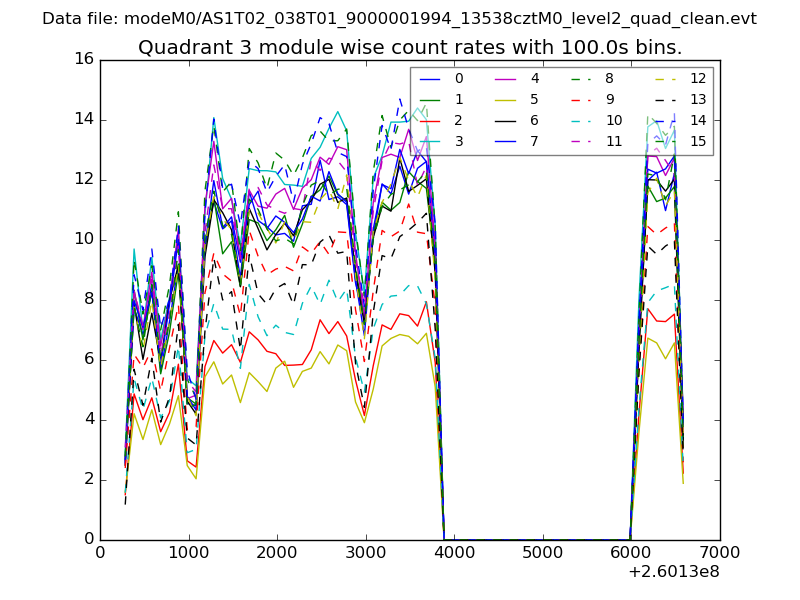
| Module-wise count rates for Quadrant C Data is divided into 100 sec bins |
 |
 |
| Module-wise count rates for Quadrant D Data is divided into 100 sec bins |
 |
 |
| Parameter | Plot |
|---|---|
| CZT HV Monitor | 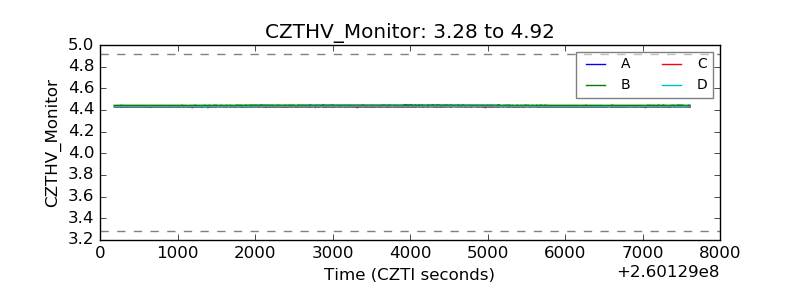 |
| D_VDD | 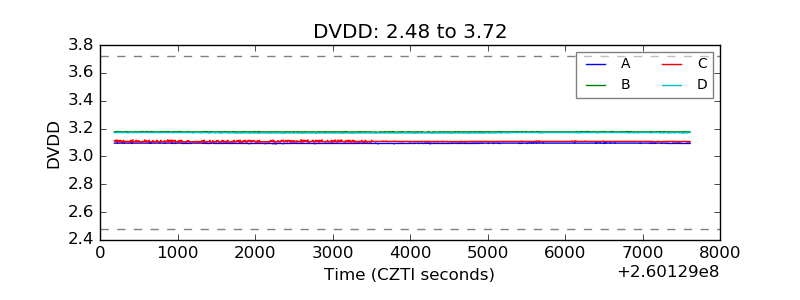 |
| Temperature 1 | 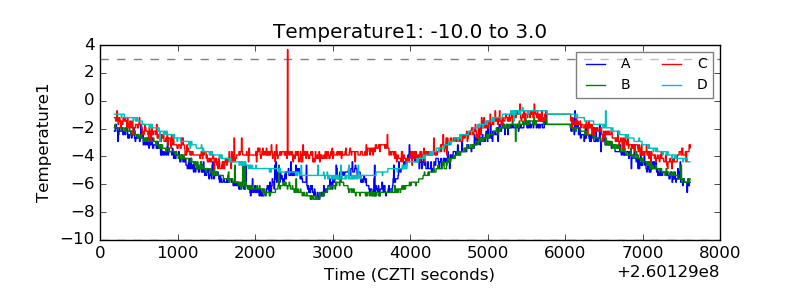 |
| Veto HV Monitor | 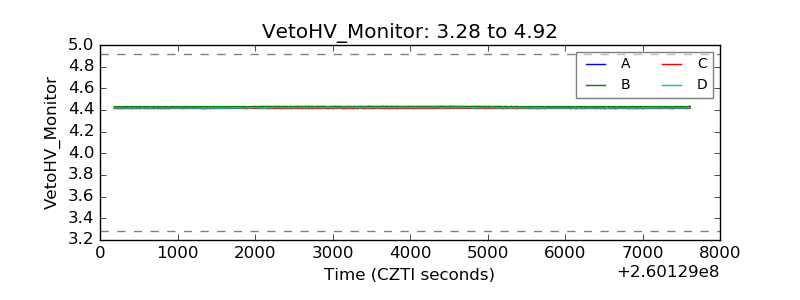 |
| Veto LLD | 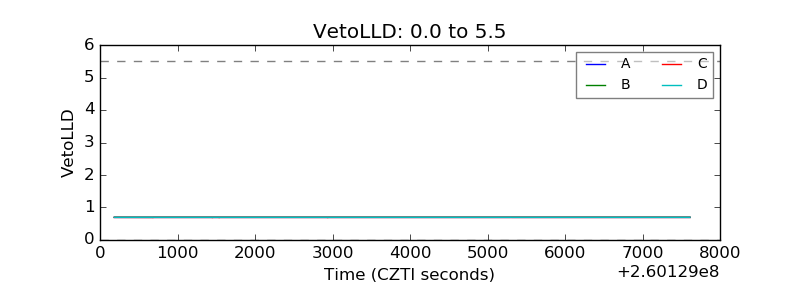 |
| Alpha Counter | 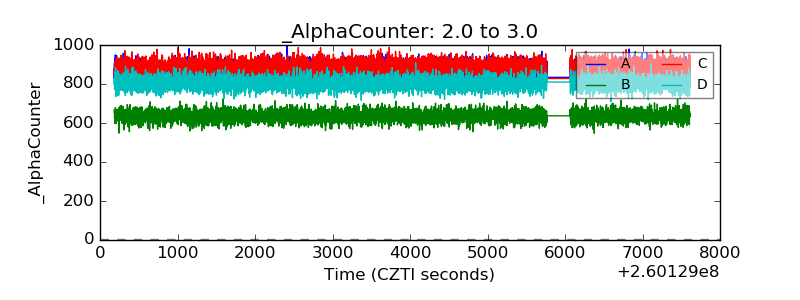 |
| _CPM_Rate | 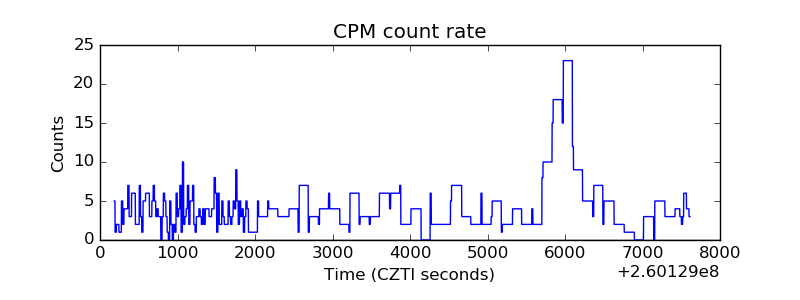 |
| CZT Counter | 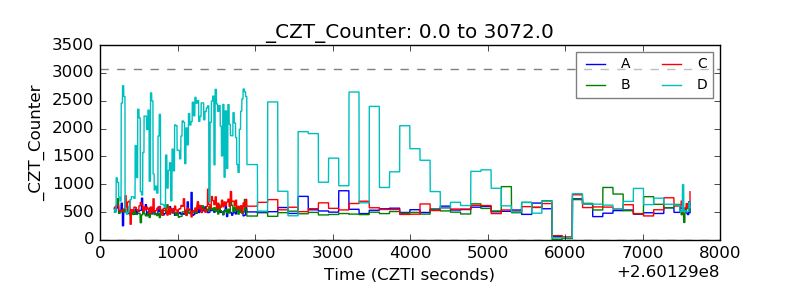 |
| +2.5 Volts monitor |  |
| +5 Volts monitor |  |
| _ROLL_ROT | 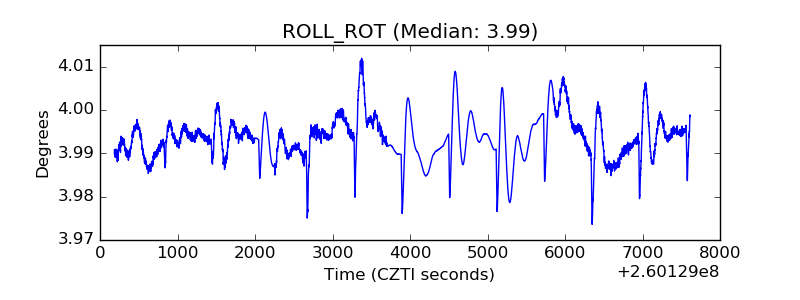 |
| _Roll_DEC | 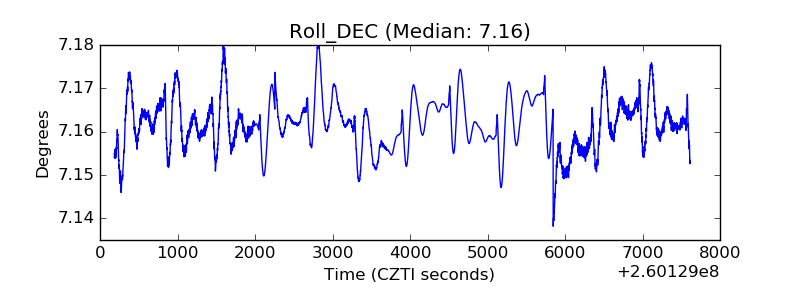 |
| _Roll_RA | 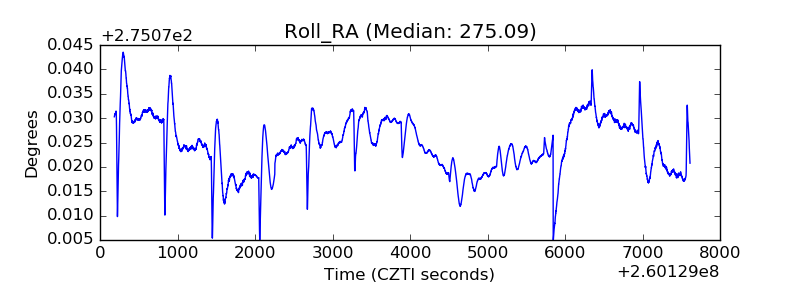 |
| Veto Counter | 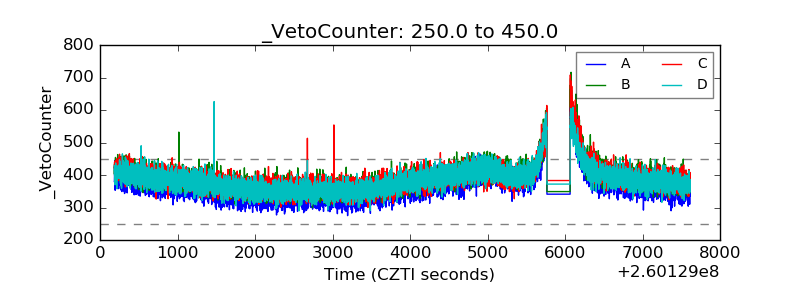 |