| Param | Original file | Final file |
|---|---|---|
| Filename | modeM0/AS1T02_038T01_9000001994_13542cztM0_level2.evt | modeM0/AS1T02_038T01_9000001994_13542cztM0_level2_quad_clean.evt |
| Size (bytes) | 339,266,880 | 97,436,160 |
| Size | 323.6 MB | 92.9 MB |
| Events in quadrant A | 2,230,482 | 677,796 |
| Events in quadrant B | 2,391,842 | 668,975 |
| Events in quadrant C | 2,535,379 | 668,698 |
| Events in quadrant D | 2,815,460 | 624,180 |
| Mode M0 | |||
|---|---|---|---|
| Quadrant | BADHDUFLAG | Total packets | Discarded packets |
| A | 0 | 9087 | 1 |
| B | 0 | 9589 | 0 |
| C | 0 | 10201 | 0 |
| D | 0 | 11074 | 0 |
| Mode SS | |||
|---|---|---|---|
| Quadrant | BADHDUFLAG | Total packets | Discarded packets |
| A | 0 | 88 | 0 |
| B | 0 | 88 | 0 |
| C | 0 | 88 | 0 |
| D | 0 | 88 | 0 |
| Quadrant | Total seconds | Saturated seconds | Saturation percentage |
|---|---|---|---|
| A | 4428 | 2 | 0.045167% |
| B | 4428 | 52 | 1.174345% |
| C | 4428 | 2 | 0.045167% |
| D | 4428 | 164 | 3.703704% |
Noise dominated data is calculated using 1-second bins in cleaned event files. If a bin has >2000 counts, and if more than 50% of those come from <1% of pixels, then it is considered to be noise-dominated and hence unusable.
| Quadrant | # 1 sec bins | Bins with >0 counts | Bins with >2000 counts | High rate bins dominated by noise | Noise dominated (total time) | Noise dominated (detector-on time) | Marked lightcurve |
|---|---|---|---|---|---|---|---|
| A | 4429 | 4429 | 0 | 0 | 0.00% | 0.00% | 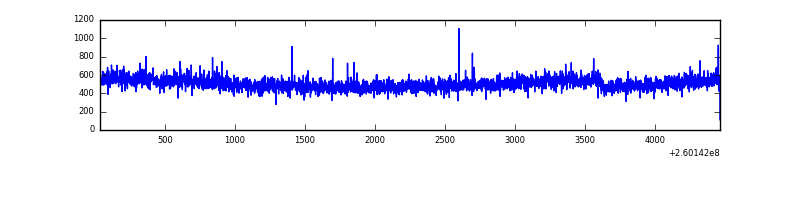 |
| B | 4429 | 4429 | 34 | 34 | 0.77% | 0.77% | 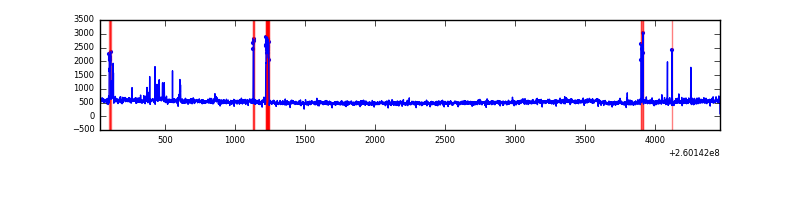 |
| C | 4429 | 4429 | 0 | 0 | 0.00% | 0.00% | 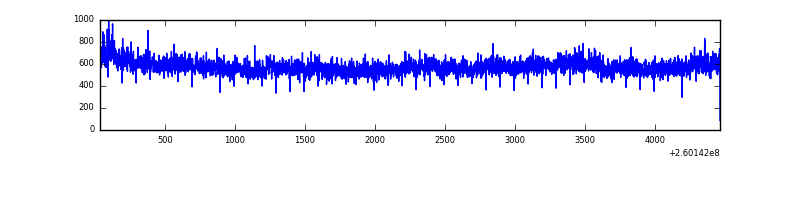 |
| D | 4429 | 4429 | 131 | 131 | 2.96% | 2.96% | 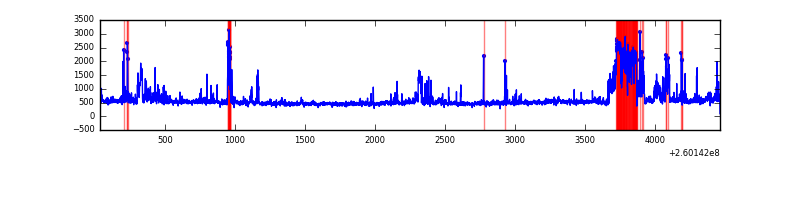 |
Top three noisy pixels from each quadrant. If the there are fewer than three noisy pixels in the level2.evt file, extra rows are filled as -1
| Pixel properties | Quadrant properties | ||||||
|---|---|---|---|---|---|---|---|
| Quadrant | DetID | PixID | Counts | Sigma | Mean | Median | Sigma |
| A | 1 | 162 | 6983 | 47.62 | 578 | 564 | 134.8 |
| A | 0 | 226 | 4925 | 32.35 | 578 | 564 | 134.8 |
| A | 12 | 194 | 4216 | 27.09 | 578 | 564 | 134.8 |
| B | 3 | 64 | 75232 | 615.19 | 572 | 561 | 121.4 |
| B | 4 | 142 | 36456 | 295.73 | 572 | 561 | 121.4 |
| B | 4 | 173 | 20311 | 162.71 | 572 | 561 | 121.4 |
| C | 3 | 233 | 344457 | 2455.59 | 562 | 568 | 140.0 |
| C | 13 | 61 | 4054 | 24.89 | 562 | 568 | 140.0 |
| C | 14 | 220 | 1613 | 7.46 | 562 | 568 | 140.0 |
| D | 13 | 122 | 543047 | 3755.48 | 546 | 529 | 144.5 |
| D | 2 | 14 | 61306 | 420.72 | 546 | 529 | 144.5 |
| D | 5 | 222 | 44030 | 301.13 | 546 | 529 | 144.5 |
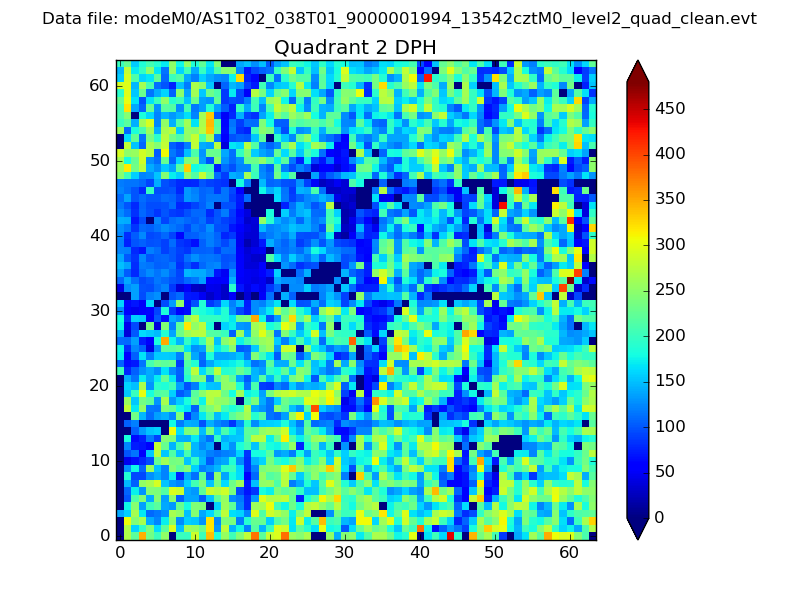
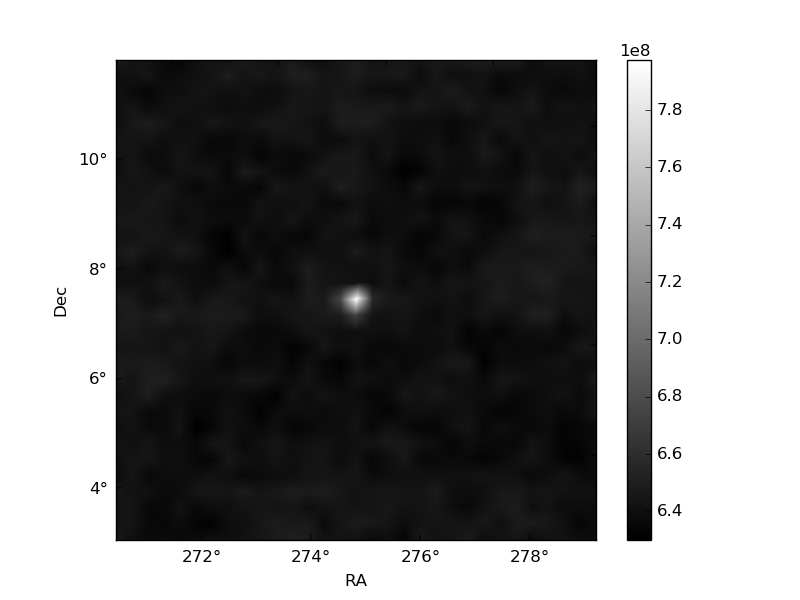
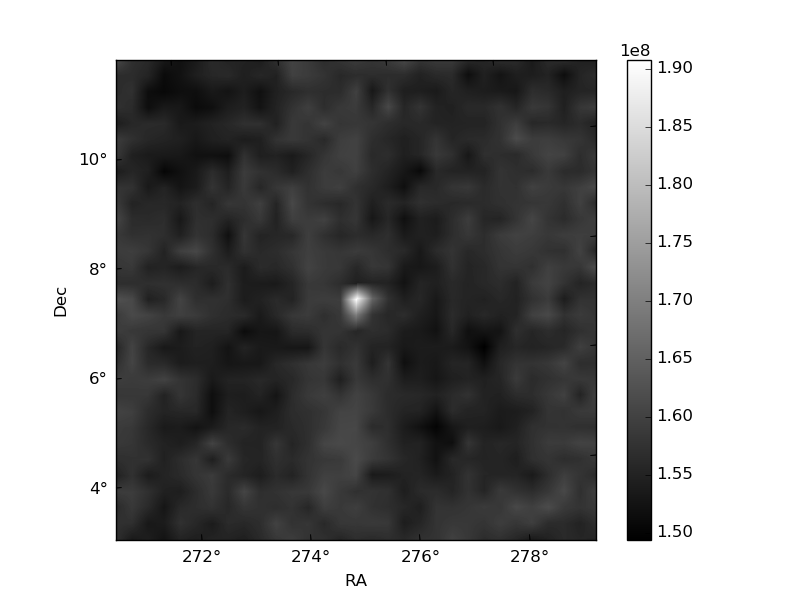
Histogram calculated using DETX and DETY for each event in the final _common_clean file
| Quadrant A | 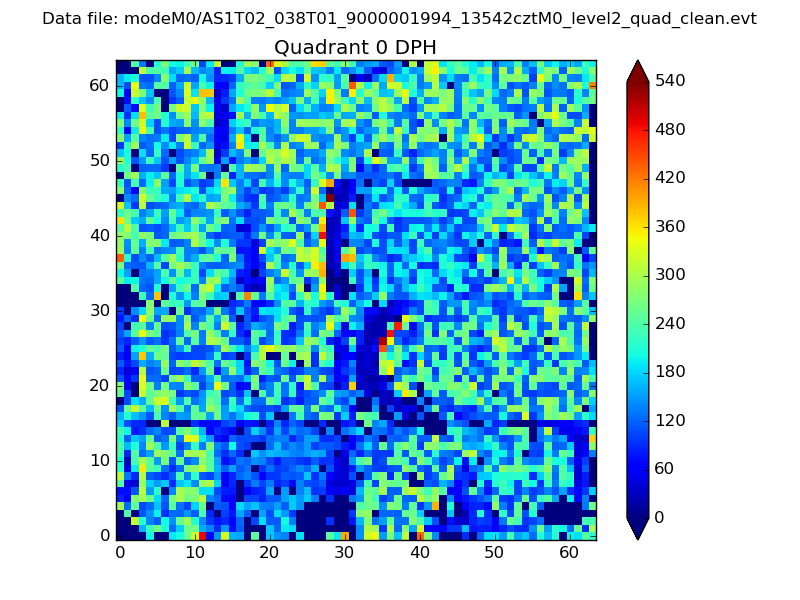 |
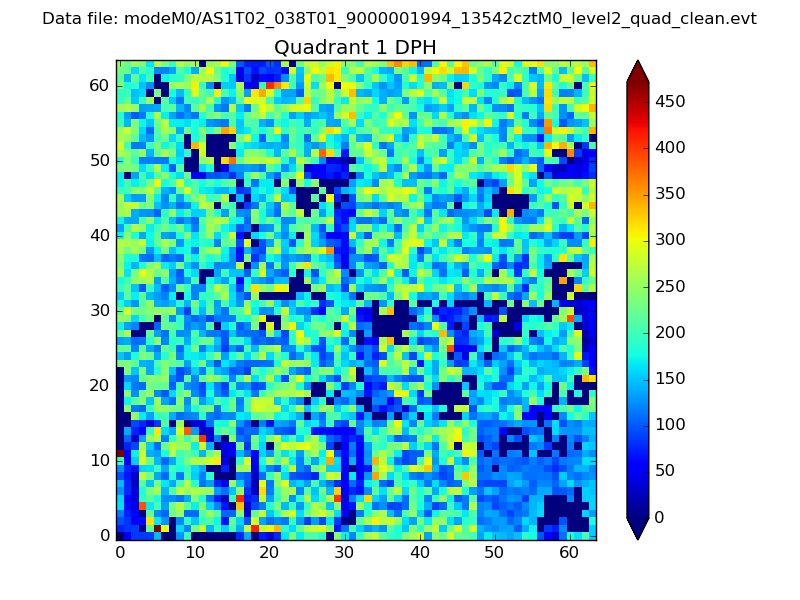 |
Quadrant B |
|---|---|---|---|
| Quadrant D | 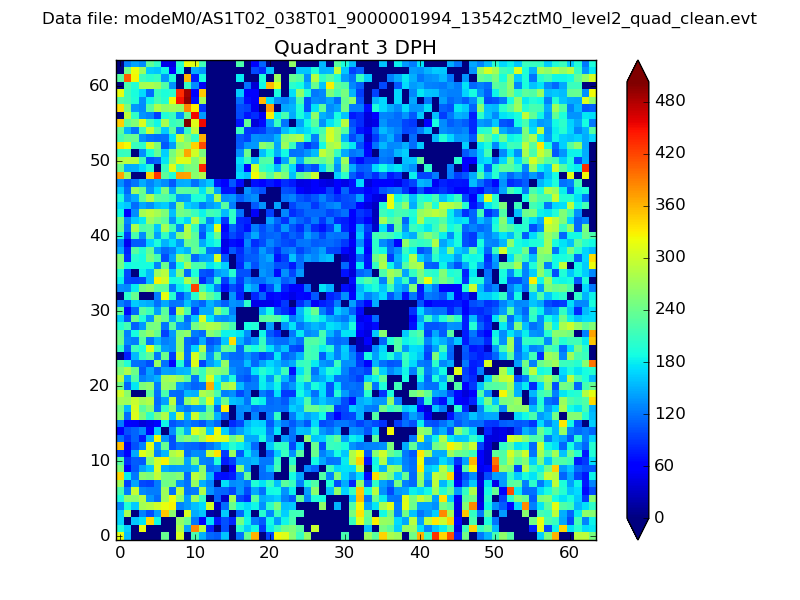 |
 |
Quadrant C |
| Plot type | Count rate plots | Images |
|---|---|---|
| Comparison with Poisson distribution Blue bars denote a histogram of data divided into 1 sec bins. Red curve is a Poisson curve with rate = median count rate of data. |
 |
 |
| Quadrant-wise count rates Data is divided into 100 sec bins |
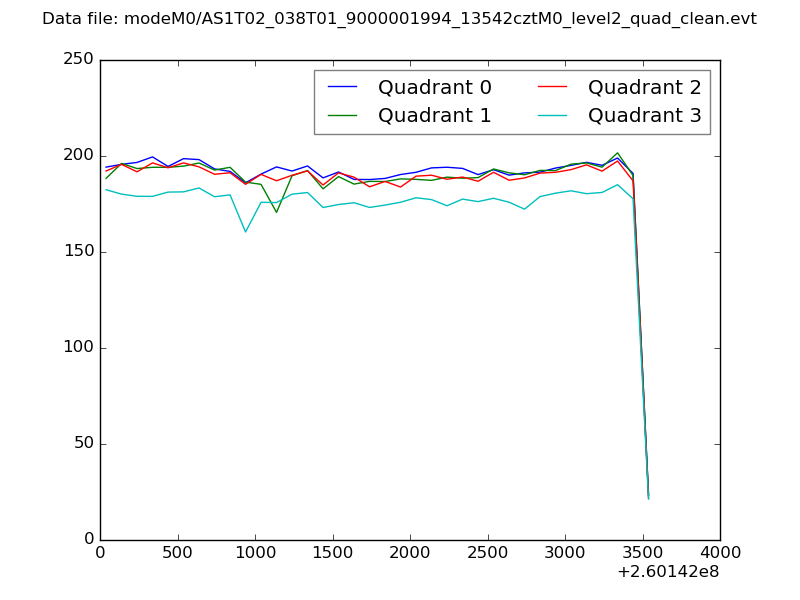 |
|
| Module-wise count rates for Quadrant A Data is divided into 100 sec bins |
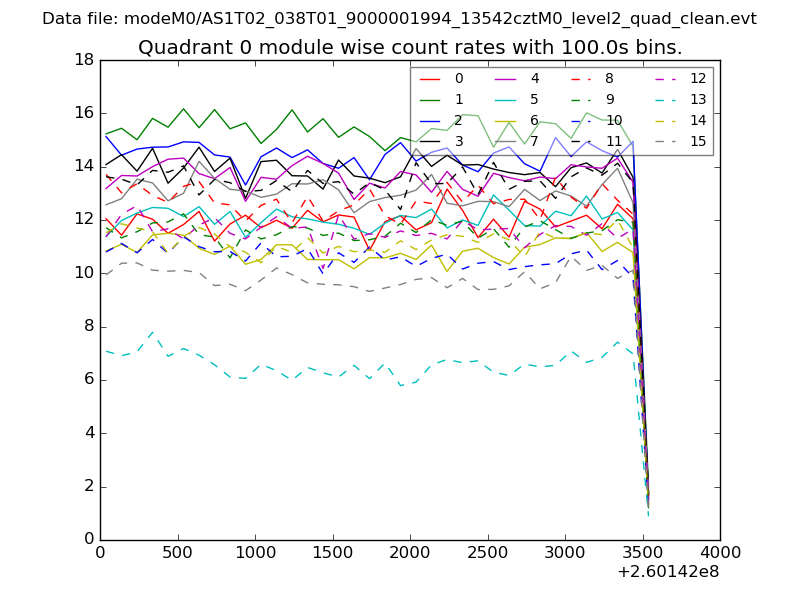 |
 |
| Module-wise count rates for Quadrant B Data is divided into 100 sec bins |
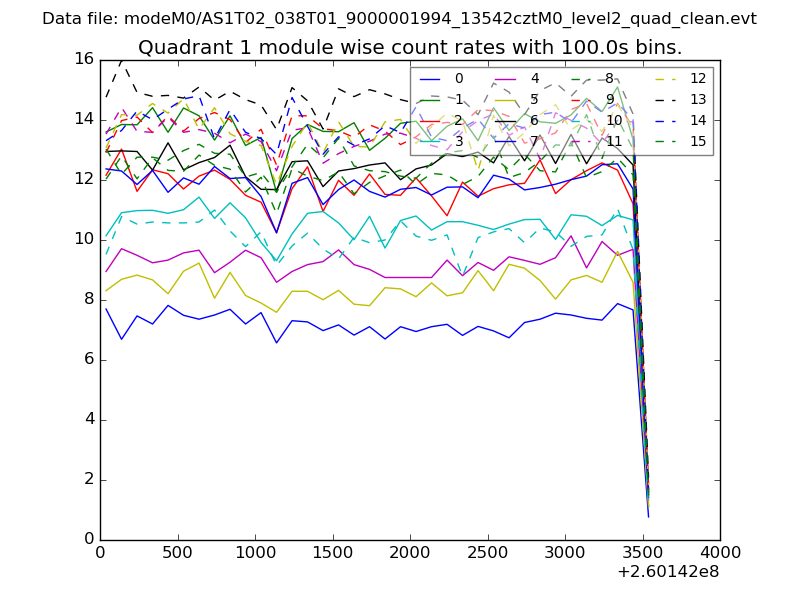 |
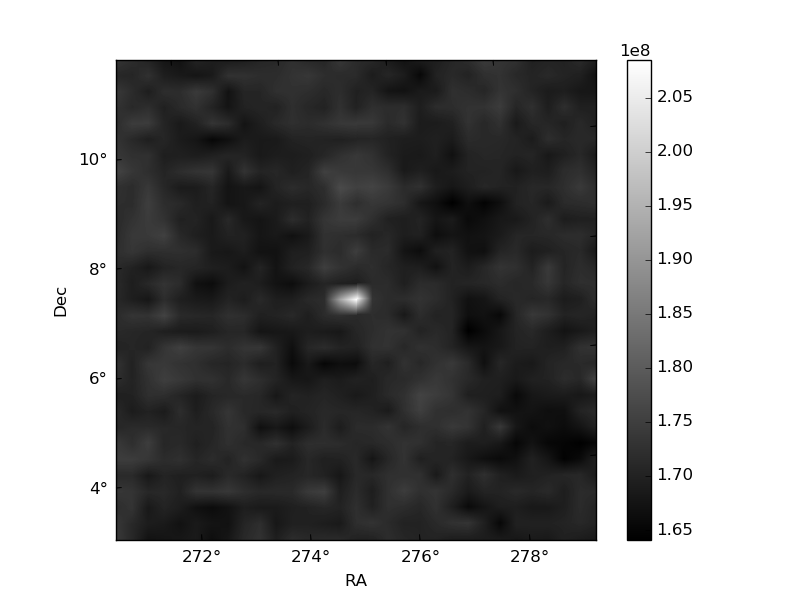 |
| Module-wise count rates for Quadrant C Data is divided into 100 sec bins |
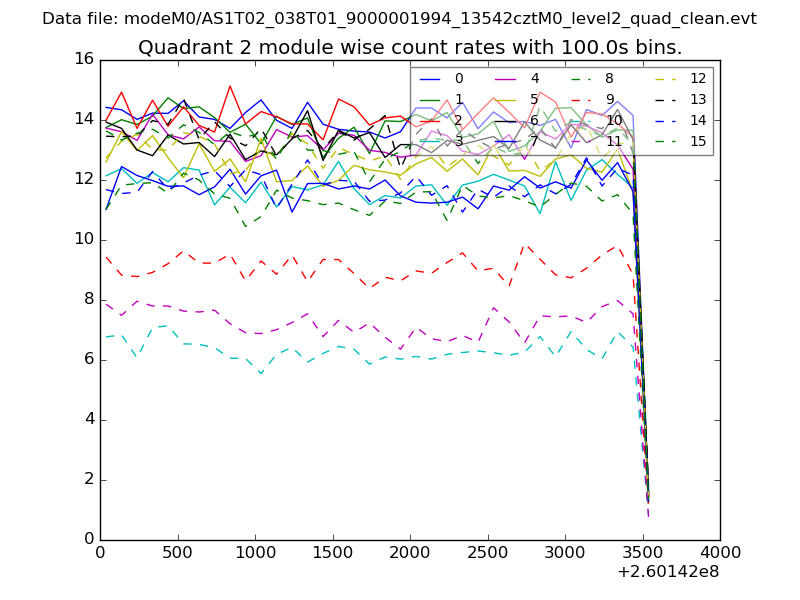 |
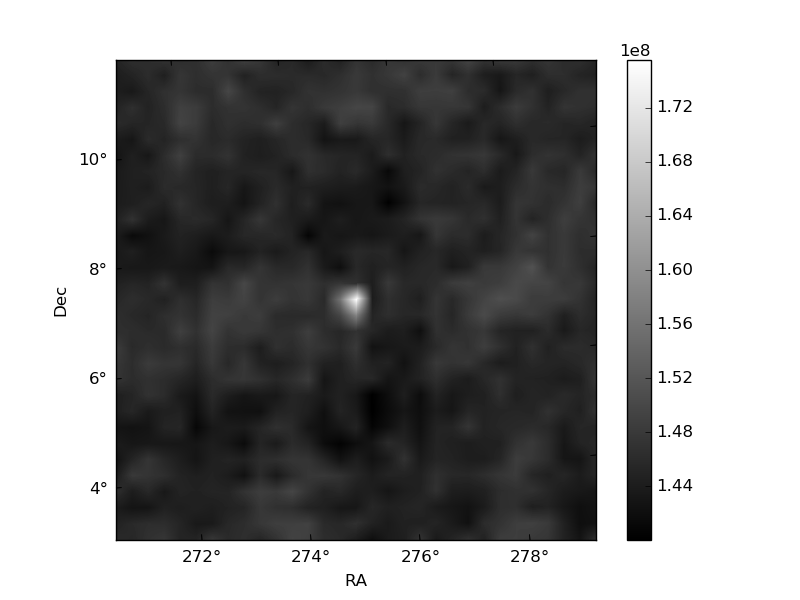 |
| Module-wise count rates for Quadrant D Data is divided into 100 sec bins |
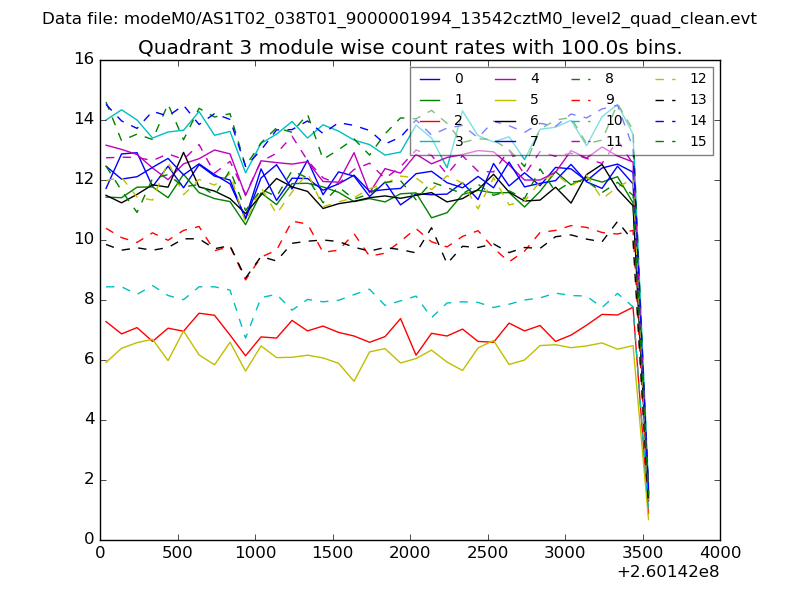 |
 |
| Parameter | Plot |
|---|---|
| CZT HV Monitor | 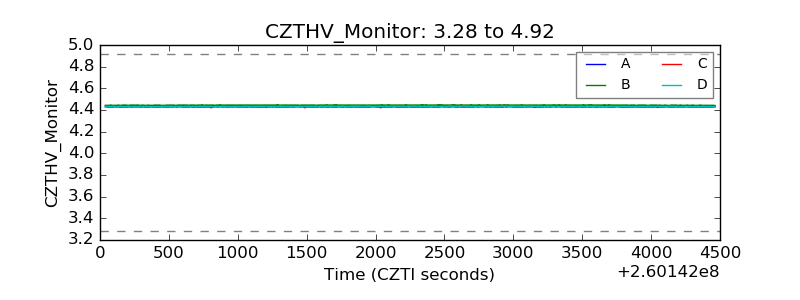 |
| D_VDD | 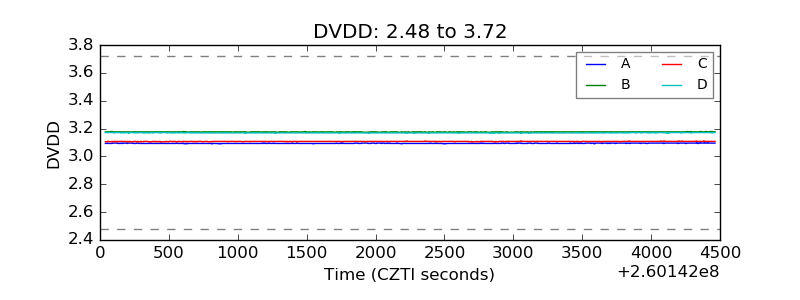 |
| Temperature 1 | 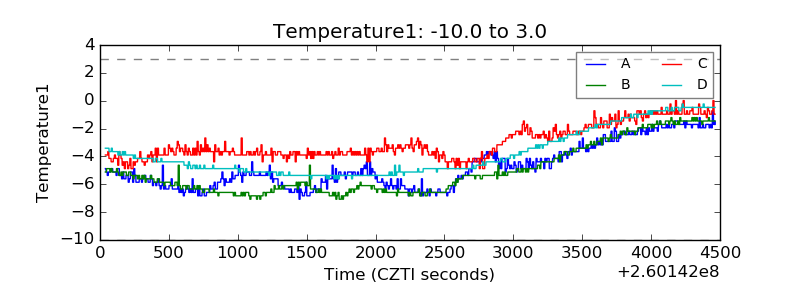 |
| Veto HV Monitor | 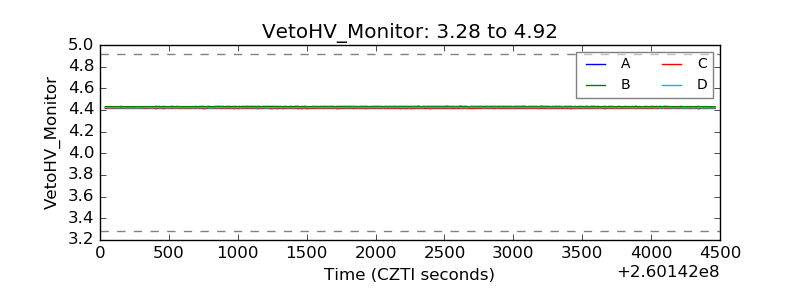 |
| Veto LLD | 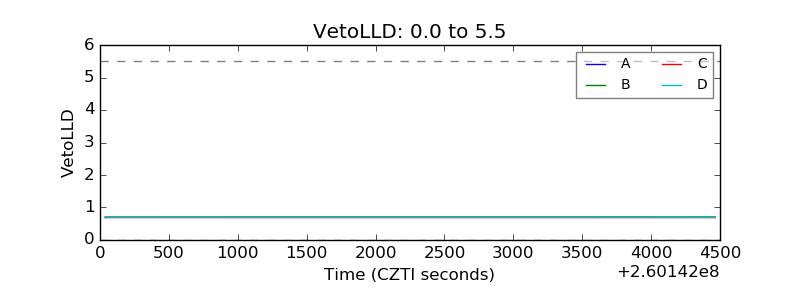 |
| Alpha Counter | 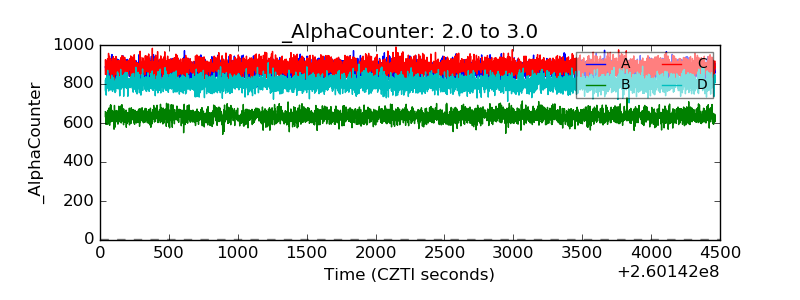 |
| _CPM_Rate | 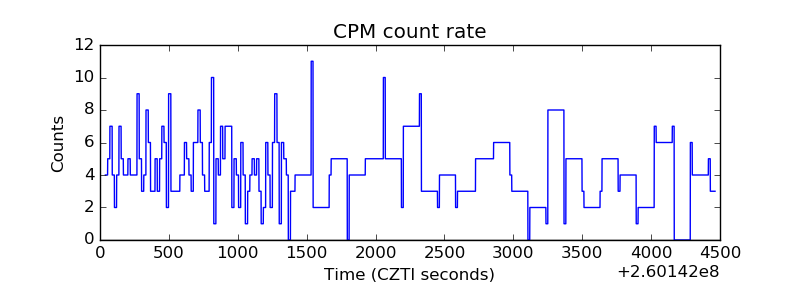 |
| CZT Counter | 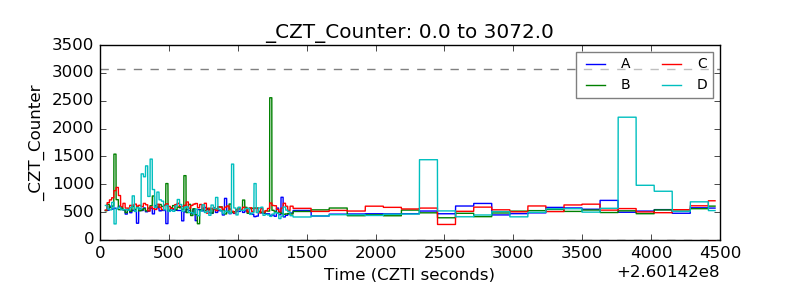 |
| +2.5 Volts monitor |  |
| +5 Volts monitor |  |
| _ROLL_ROT | 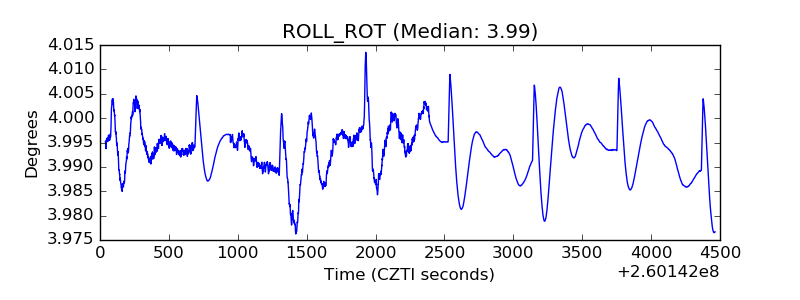 |
| _Roll_DEC |  |
| _Roll_RA | 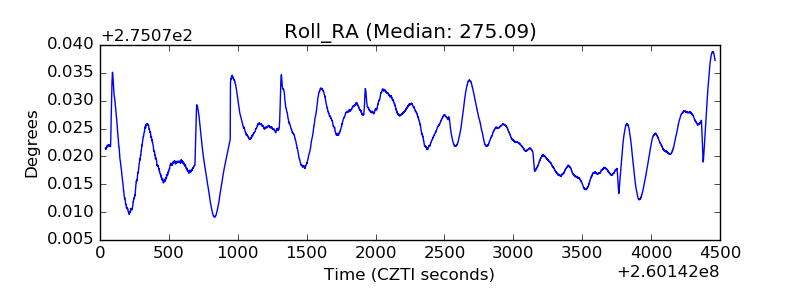 |
| Veto Counter | 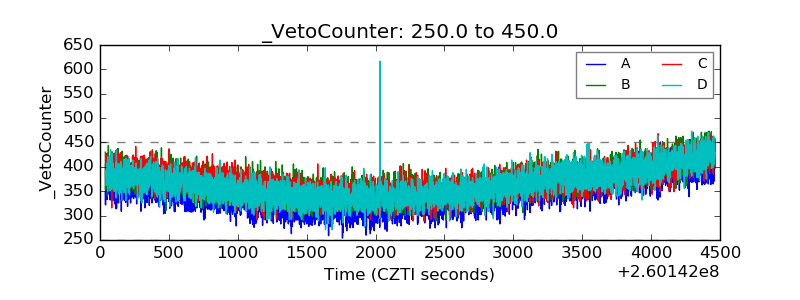 |