| Param | Original file | Final file |
|---|---|---|
| Filename | modeM0/AS1T02_038T01_9000001994_13545cztM0_level2.evt | modeM0/AS1T02_038T01_9000001994_13545cztM0_level2_quad_clean.evt |
| Size (bytes) | 770,961,600 | 170,930,880 |
| Size | 735.2 MB | 163.0 MB |
| Events in quadrant A | 5,385,907 | 1,143,096 |
| Events in quadrant B | 5,837,437 | 1,144,245 |
| Events in quadrant C | 5,582,205 | 1,130,348 |
| Events in quadrant D | 5,859,846 | 1,060,048 |
| Mode M0 | |||
|---|---|---|---|
| Quadrant | BADHDUFLAG | Total packets | Discarded packets |
| A | 0 | 22058 | 3 |
| B | 0 | 23577 | 2 |
| C | 0 | 22672 | 2 |
| D | 0 | 23653 | 2 |
| Mode SS | |||
|---|---|---|---|
| Quadrant | BADHDUFLAG | Total packets | Discarded packets |
| A | 0 | 206 | 0 |
| B | 0 | 206 | 0 |
| C | 0 | 206 | 0 |
| D | 0 | 206 | 0 |
| Mode M9 | |||
|---|---|---|---|
| Quadrant | BADHDUFLAG | Total packets | Discarded packets |
| A | 0 | 22 | 0 |
| B | 0 | 22 | 0 |
| C | 0 | 22 | 0 |
| D | 0 | 22 | 0 |
| Quadrant | Total seconds | Saturated seconds | Saturation percentage |
|---|---|---|---|
| A | 10100 | 100 | 0.990099% |
| B | 10100 | 211 | 2.089109% |
| C | 10100 | 68 | 0.673267% |
| D | 10100 | 115 | 1.138614% |
Noise dominated data is calculated using 1-second bins in cleaned event files. If a bin has >2000 counts, and if more than 50% of those come from <1% of pixels, then it is considered to be noise-dominated and hence unusable.
| Quadrant | # 1 sec bins | Bins with >0 counts | Bins with >2000 counts | High rate bins dominated by noise | Noise dominated (total time) | Noise dominated (detector-on time) | Marked lightcurve |
|---|---|---|---|---|---|---|---|
| A | 12276 | 10101 | 8 | 8 | 0.07% | 0.08% | 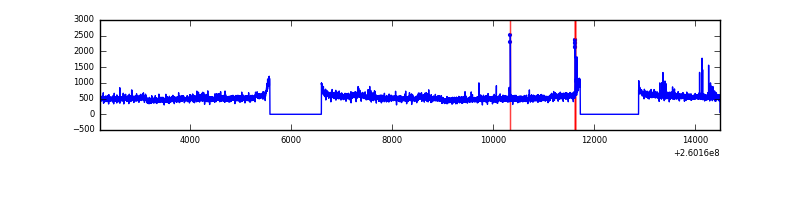 |
| B | 12276 | 10101 | 50 | 50 | 0.41% | 0.50% | 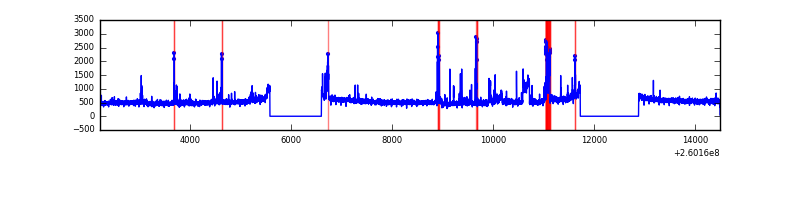 |
| C | 12276 | 10101 | 10 | 10 | 0.08% | 0.10% | 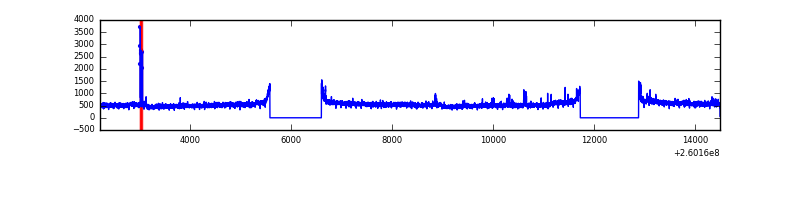 |
| D | 12276 | 10101 | 54 | 54 | 0.44% | 0.53% | 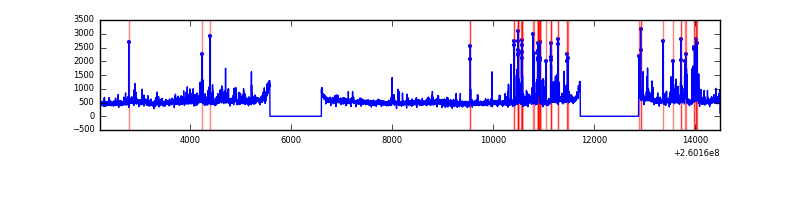 |
Top three noisy pixels from each quadrant. If the there are fewer than three noisy pixels in the level2.evt file, extra rows are filled as -1
| Pixel properties | Quadrant properties | ||||||
|---|---|---|---|---|---|---|---|
| Quadrant | DetID | PixID | Counts | Sigma | Mean | Median | Sigma |
| A | 14 | 238 | 38321 | 125.98 | 1369 | 1347 | 293.5 |
| A | 15 | 69 | 35121 | 115.08 | 1369 | 1347 | 293.5 |
| A | 1 | 162 | 32598 | 106.48 | 1369 | 1347 | 293.5 |
| B | 5 | 32 | 300811 | 1126.84 | 1349 | 1321 | 265.8 |
| B | 4 | 142 | 91962 | 341.04 | 1349 | 1321 | 265.8 |
| B | 3 | 64 | 66825 | 246.46 | 1349 | 1321 | 265.8 |
| C | 3 | 233 | 411107 | 1315.3 | 1319 | 1339 | 311.5 |
| C | 14 | 234 | 35296 | 109.0 | 1319 | 1339 | 311.5 |
| C | 13 | 61 | 9476 | 26.12 | 1319 | 1339 | 311.5 |
| D | 13 | 122 | 218212 | 673.08 | 1312 | 1281 | 322.3 |
| D | 2 | 14 | 211005 | 650.72 | 1312 | 1281 | 322.3 |
| D | 5 | 222 | 167838 | 516.78 | 1312 | 1281 | 322.3 |
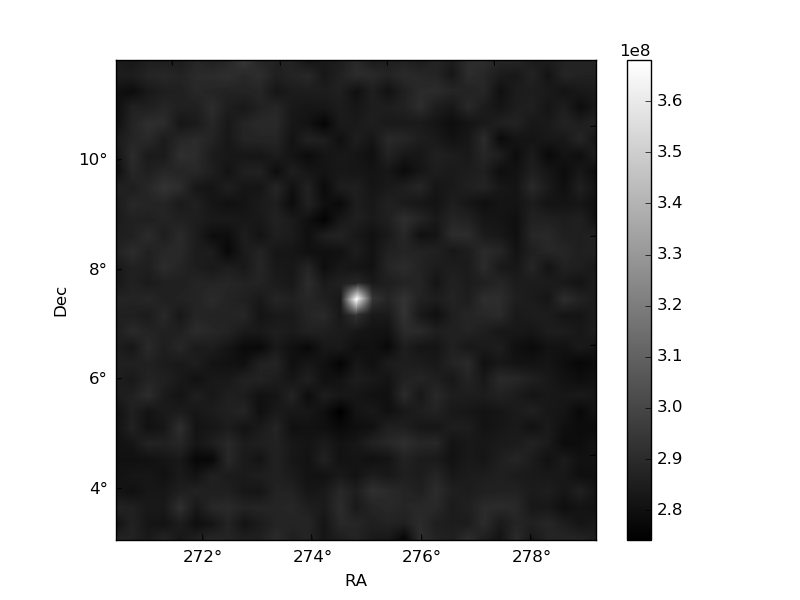
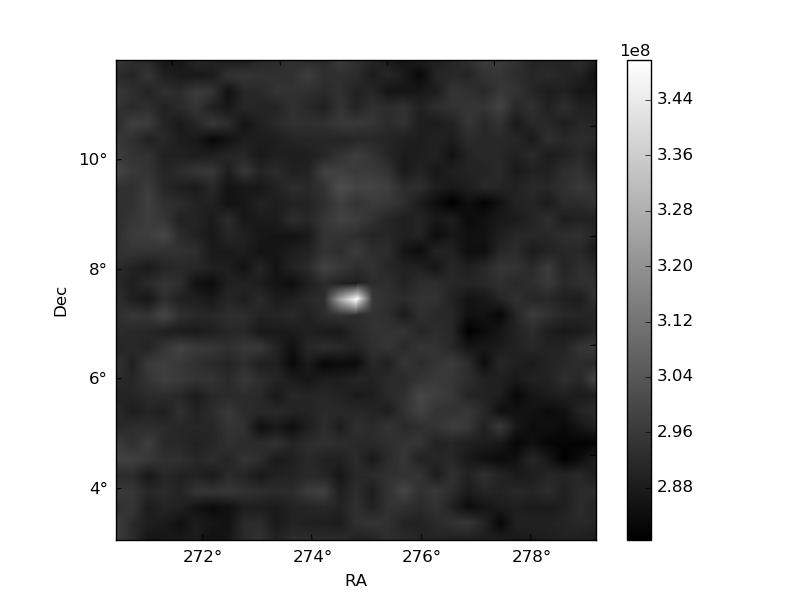
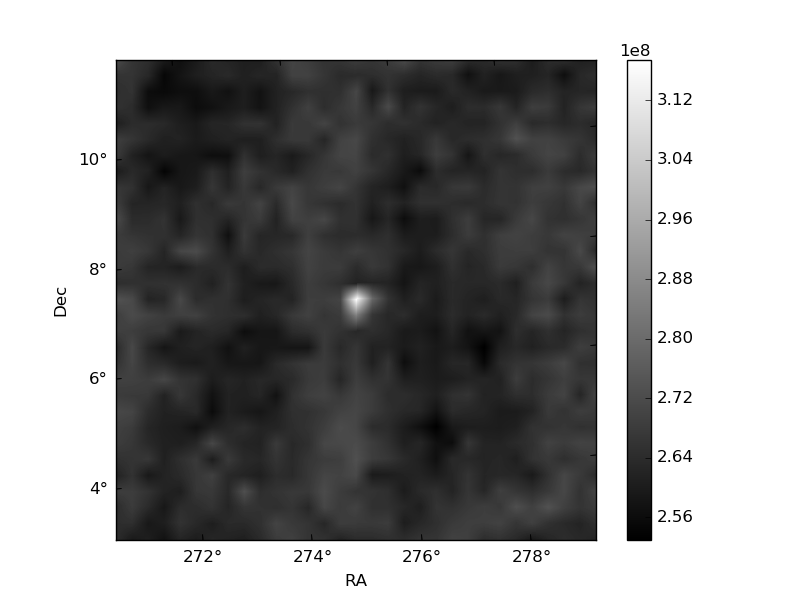
Histogram calculated using DETX and DETY for each event in the final _common_clean file
| Quadrant A | 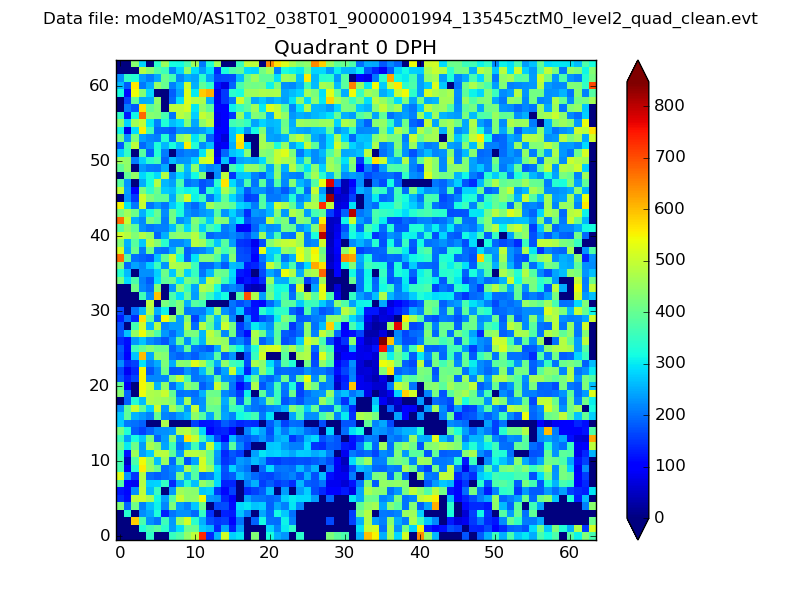 |
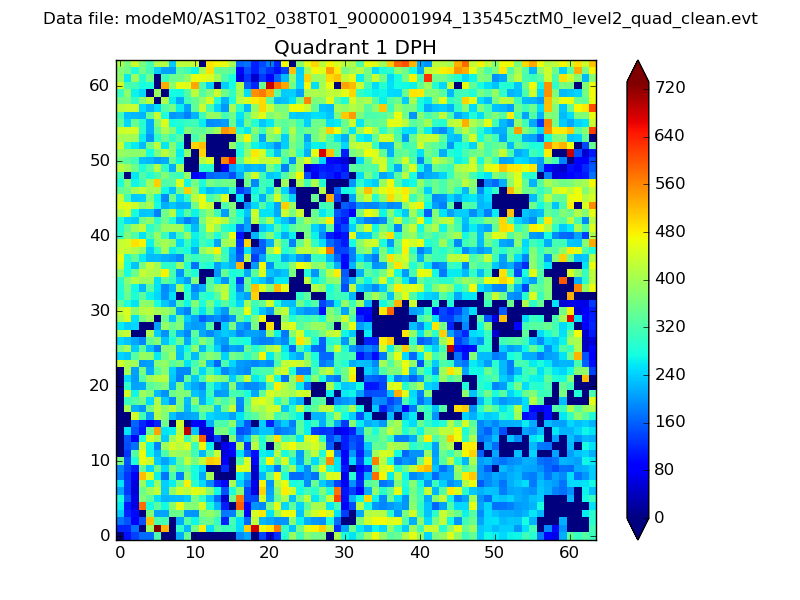 |
Quadrant B |
|---|---|---|---|
| Quadrant D | 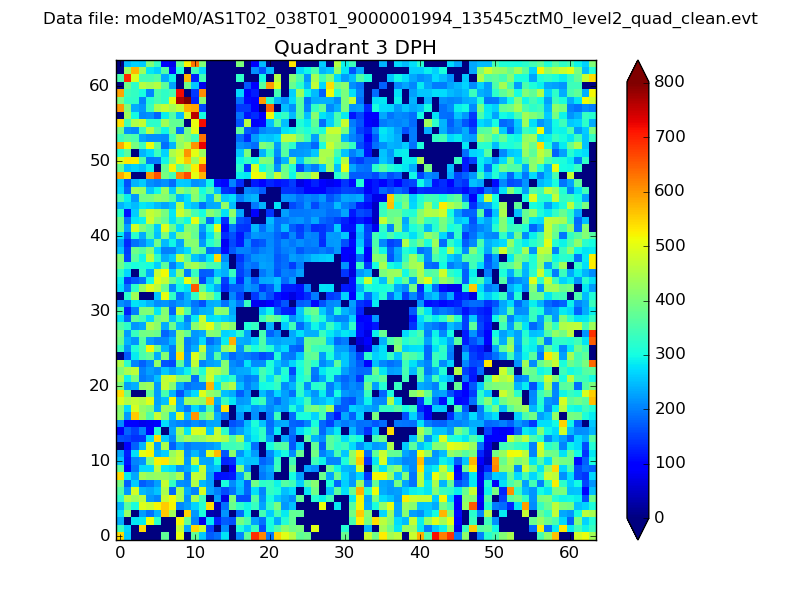 |
 |
Quadrant C |
| Plot type | Count rate plots | Images |
|---|---|---|
| Comparison with Poisson distribution Blue bars denote a histogram of data divided into 1 sec bins. Red curve is a Poisson curve with rate = median count rate of data. |
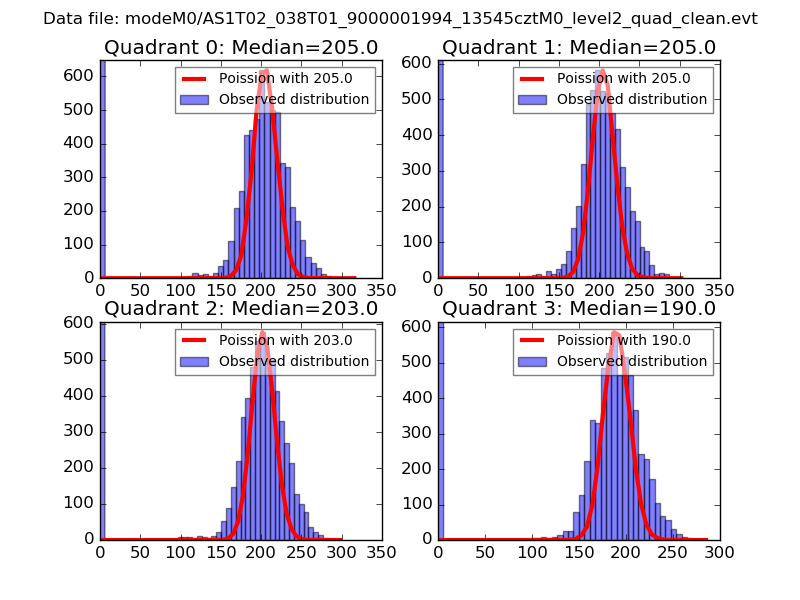 |
 |
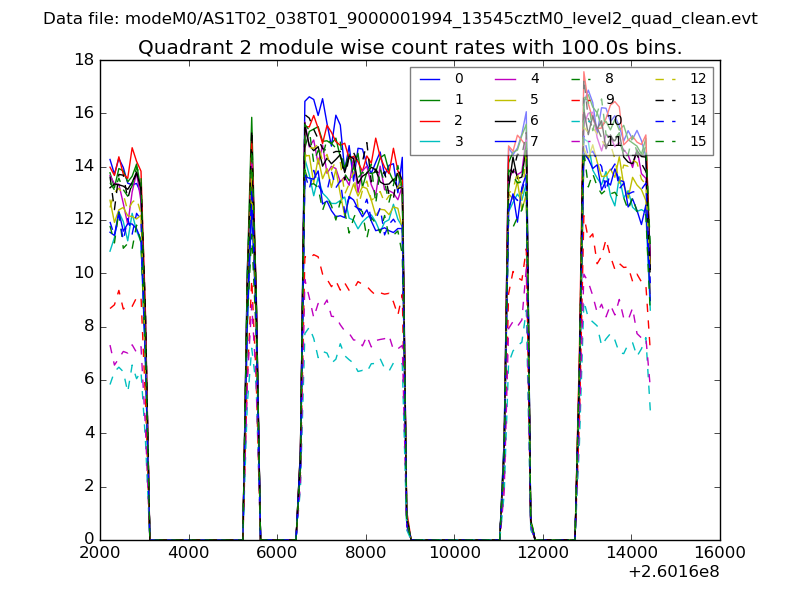
| Quadrant-wise count rates Data is divided into 100 sec bins |
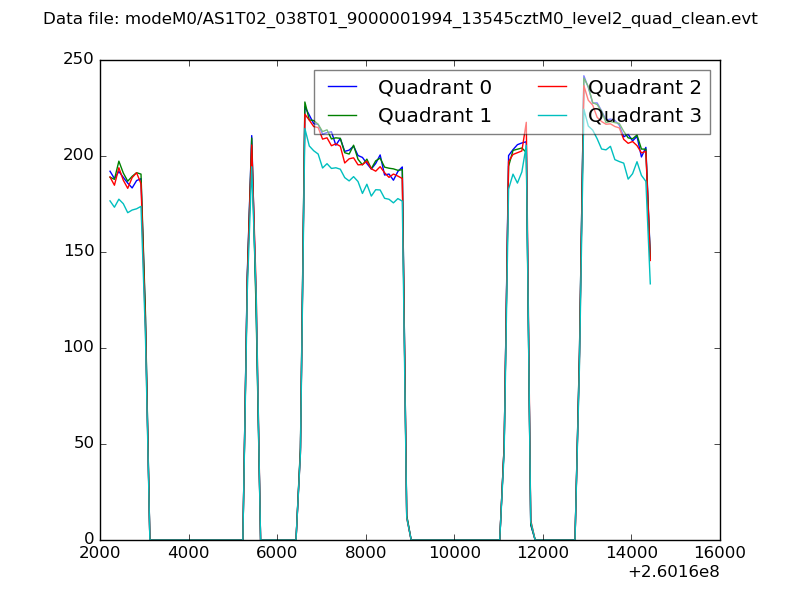 |
|
| Module-wise count rates for Quadrant A Data is divided into 100 sec bins |
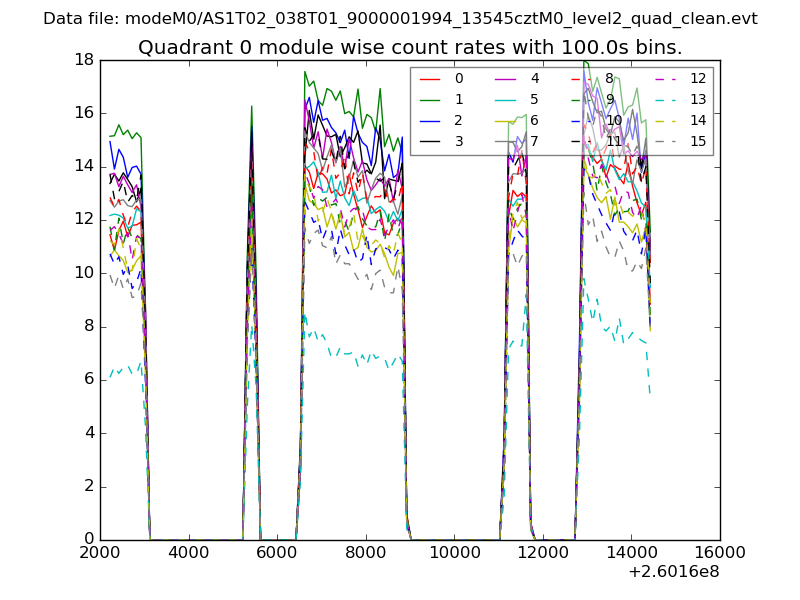 |
 |
| Module-wise count rates for Quadrant B Data is divided into 100 sec bins |
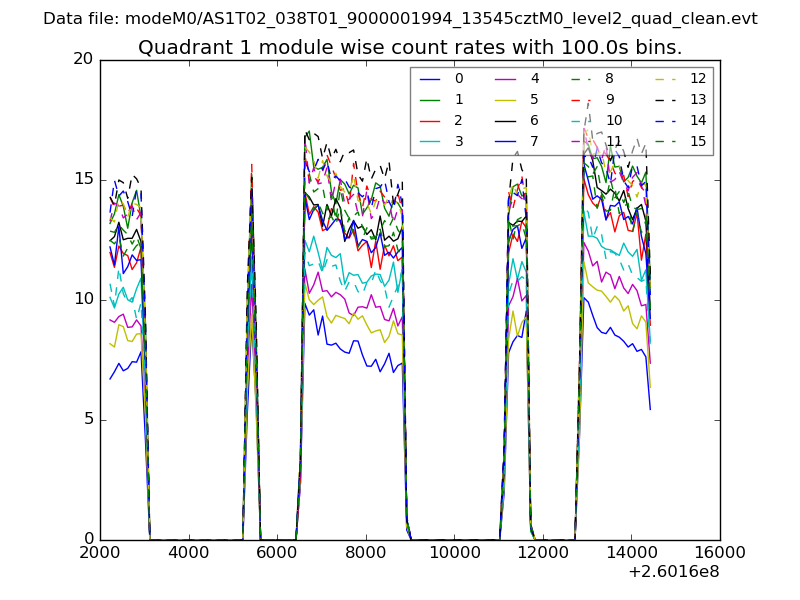 |
 |
| Module-wise count rates for Quadrant C Data is divided into 100 sec bins |
 |
 |
| Module-wise count rates for Quadrant D Data is divided into 100 sec bins |
 |
 |
| Parameter | Plot |
|---|---|
| CZT HV Monitor |  |
| D_VDD |  |
| Temperature 1 | 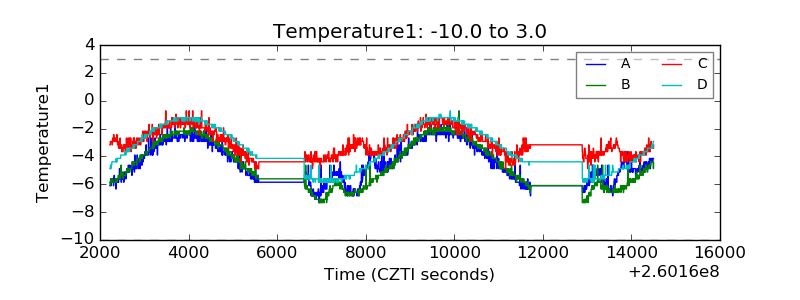 |
| Veto HV Monitor | 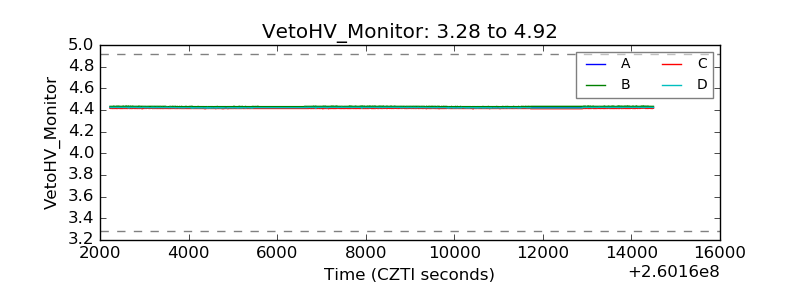 |
| Veto LLD | 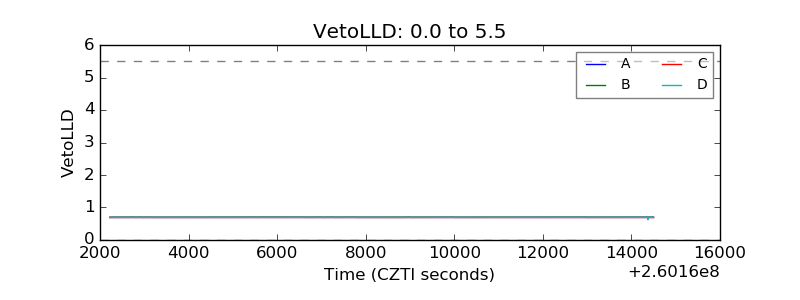 |
| Alpha Counter | 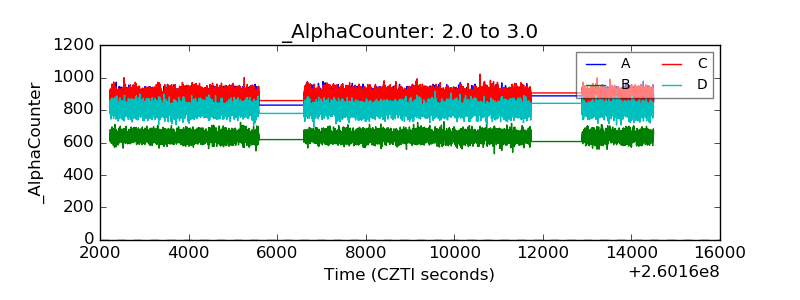 |
| _CPM_Rate | 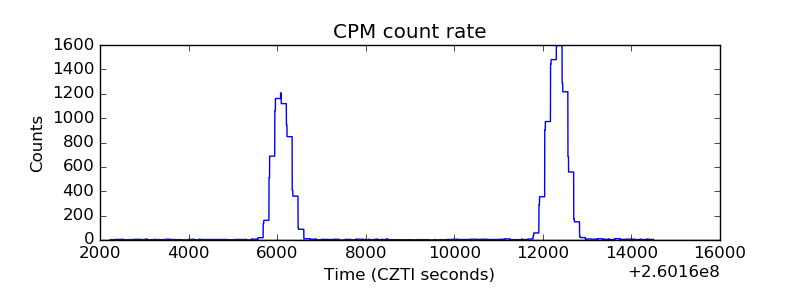 |
| CZT Counter |  |
| +2.5 Volts monitor |  |
| +5 Volts monitor | 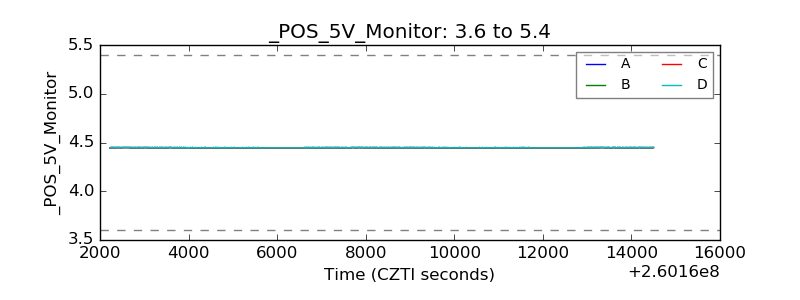 |
| _ROLL_ROT | 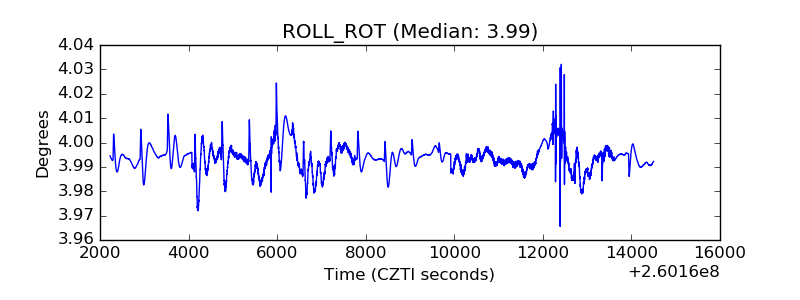 |
| _Roll_DEC | 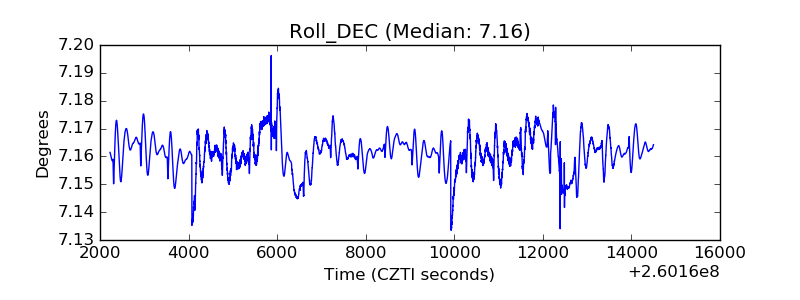 |
| _Roll_RA |  |
| Veto Counter | 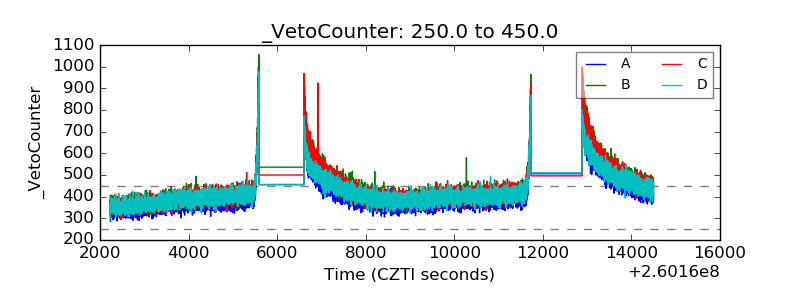 |