| Param | Original file | Final file |
|---|---|---|
| Filename | modeM0/AS1T02_038T01_9000001994_13546cztM0_level2.evt | modeM0/AS1T02_038T01_9000001994_13546cztM0_level2_quad_clean.evt |
| Size (bytes) | 470,828,160 | 106,453,440 |
| Size | 449.0 MB | 101.5 MB |
| Events in quadrant A | 3,228,650 | 724,402 |
| Events in quadrant B | 3,515,876 | 721,036 |
| Events in quadrant C | 3,369,882 | 713,528 |
| Events in quadrant D | 3,760,405 | 669,096 |
| Mode M0 | |||
|---|---|---|---|
| Quadrant | BADHDUFLAG | Total packets | Discarded packets |
| A | 0 | 13255 | 2 |
| B | 0 | 14047 | 1 |
| C | 0 | 13953 | 1 |
| D | 0 | 15088 | 1 |
| Mode SS | |||
|---|---|---|---|
| Quadrant | BADHDUFLAG | Total packets | Discarded packets |
| A | 0 | 114 | 0 |
| B | 0 | 114 | 0 |
| C | 0 | 114 | 0 |
| D | 0 | 114 | 0 |
| Mode M9 | |||
|---|---|---|---|
| Quadrant | BADHDUFLAG | Total packets | Discarded packets |
| A | 0 | 12 | 0 |
| B | 0 | 12 | 0 |
| C | 0 | 12 | 0 |
| D | 0 | 12 | 0 |
| Quadrant | Total seconds | Saturated seconds | Saturation percentage |
|---|---|---|---|
| A | 5670 | 91 | 1.604938% |
| B | 5670 | 200 | 3.527337% |
| C | 5670 | 49 | 0.864198% |
| D | 5670 | 129 | 2.275132% |
Noise dominated data is calculated using 1-second bins in cleaned event files. If a bin has >2000 counts, and if more than 50% of those come from <1% of pixels, then it is considered to be noise-dominated and hence unusable.
| Quadrant | # 1 sec bins | Bins with >0 counts | Bins with >2000 counts | High rate bins dominated by noise | Noise dominated (total time) | Noise dominated (detector-on time) | Marked lightcurve |
|---|---|---|---|---|---|---|---|
| A | 6876 | 5671 | 12 | 12 | 0.17% | 0.21% | 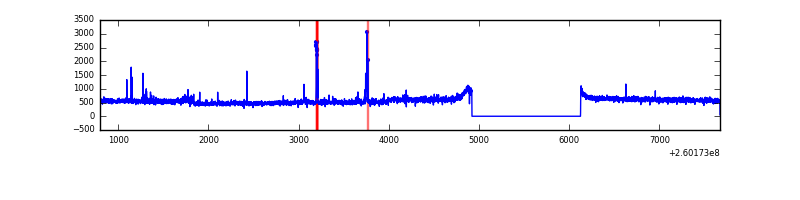 |
| B | 6876 | 5671 | 87 | 87 | 1.27% | 1.53% | 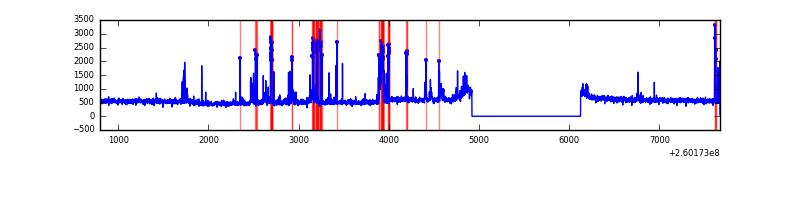 |
| C | 6876 | 5671 | 0 | 0 | 0.00% | 0.00% | 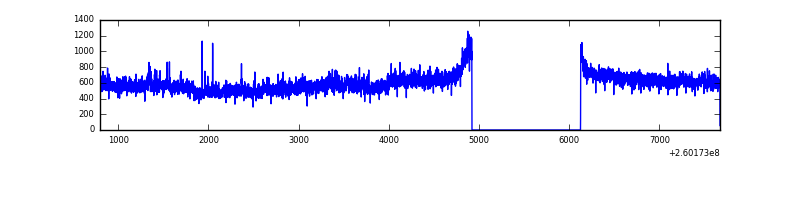 |
| D | 6876 | 5671 | 51 | 51 | 0.74% | 0.90% | 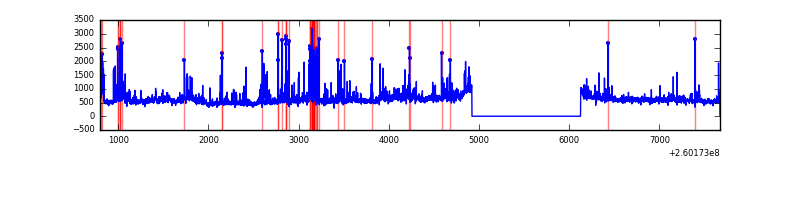 |
Top three noisy pixels from each quadrant. If the there are fewer than three noisy pixels in the level2.evt file, extra rows are filled as -1
| Pixel properties | Quadrant properties | ||||||
|---|---|---|---|---|---|---|---|
| Quadrant | DetID | PixID | Counts | Sigma | Mean | Median | Sigma |
| A | 15 | 69 | 56102 | 318.39 | 809 | 797 | 173.7 |
| A | 1 | 162 | 30985 | 173.79 | 809 | 797 | 173.7 |
| A | 10 | 229 | 10628 | 56.6 | 809 | 797 | 173.7 |
| B | 0 | 182 | 166820 | 1053.37 | 789 | 777 | 157.6 |
| B | 5 | 32 | 116471 | 733.95 | 789 | 777 | 157.6 |
| B | 0 | 189 | 43569 | 271.47 | 789 | 777 | 157.6 |
| C | 3 | 233 | 359497 | 1953.45 | 772 | 780 | 183.6 |
| C | 13 | 61 | 5557 | 26.01 | 772 | 780 | 183.6 |
| C | 14 | 234 | 2130 | 7.35 | 772 | 780 | 183.6 |
| D | 13 | 122 | 241881 | 1262.77 | 770 | 751 | 191.0 |
| D | 5 | 222 | 188611 | 983.8 | 770 | 751 | 191.0 |
| D | 2 | 14 | 185064 | 965.22 | 770 | 751 | 191.0 |
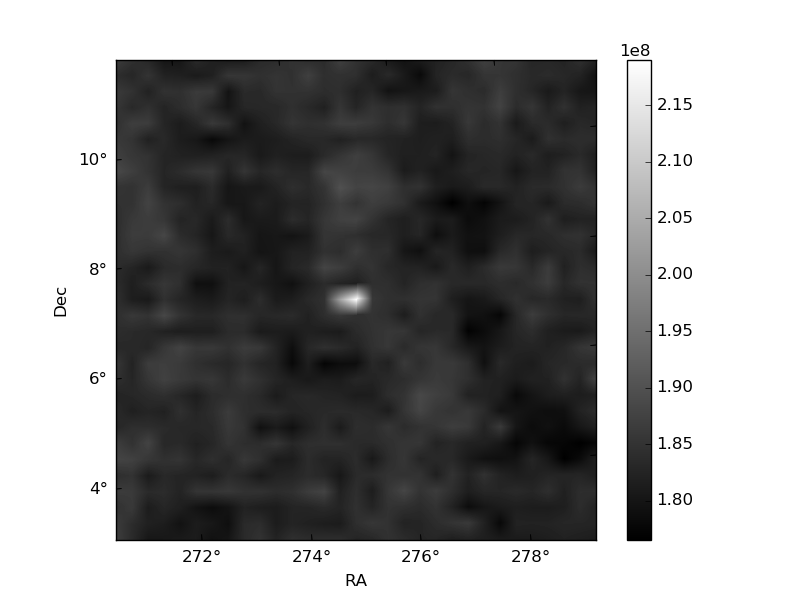
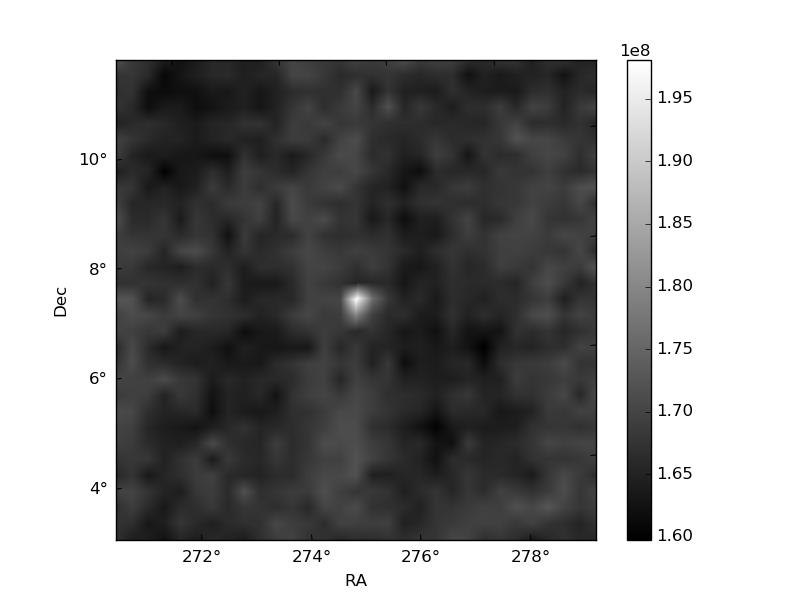
Histogram calculated using DETX and DETY for each event in the final _common_clean file
| Quadrant A | 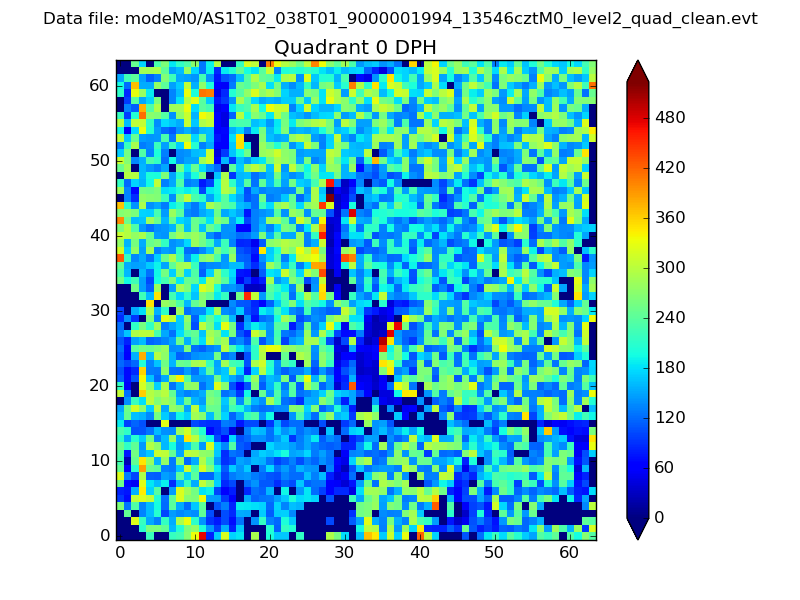 |
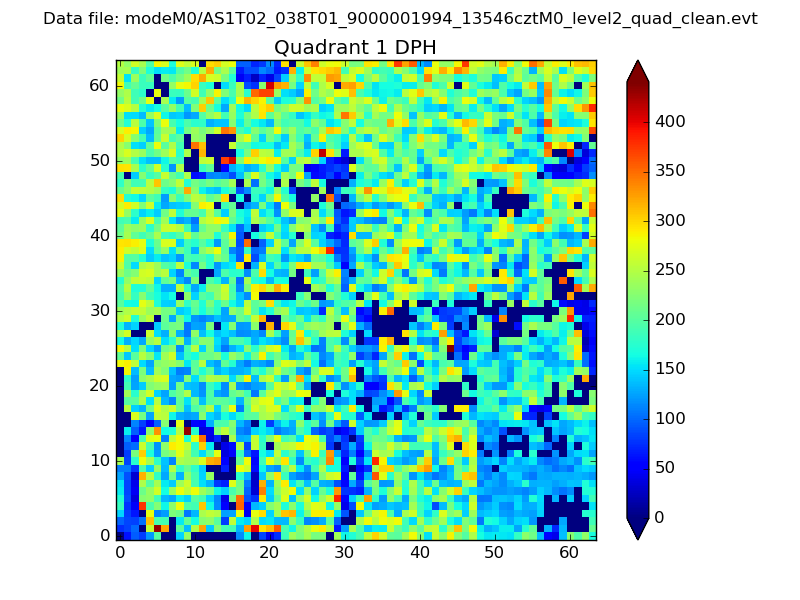 |
Quadrant B |
|---|---|---|---|
| Quadrant D | 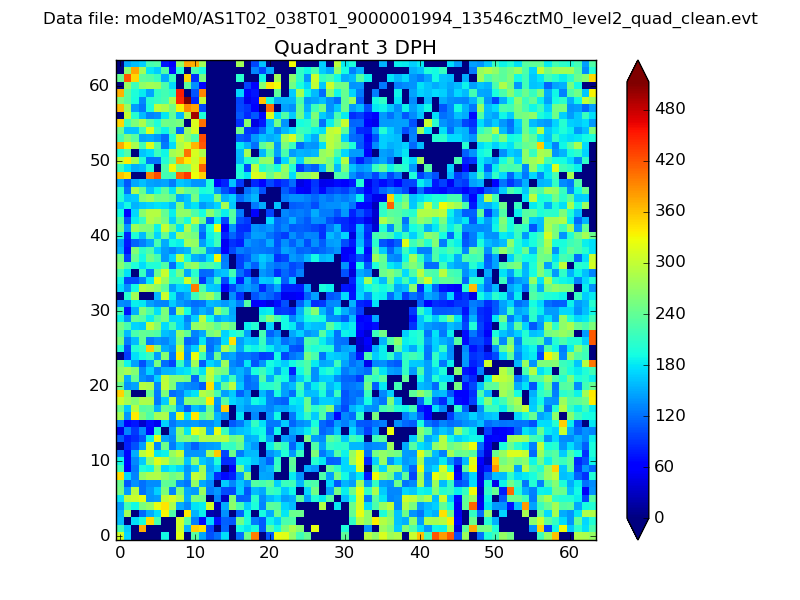 |
 |
Quadrant C |
| Plot type | Count rate plots | Images |
|---|---|---|
| Comparison with Poisson distribution Blue bars denote a histogram of data divided into 1 sec bins. Red curve is a Poisson curve with rate = median count rate of data. |
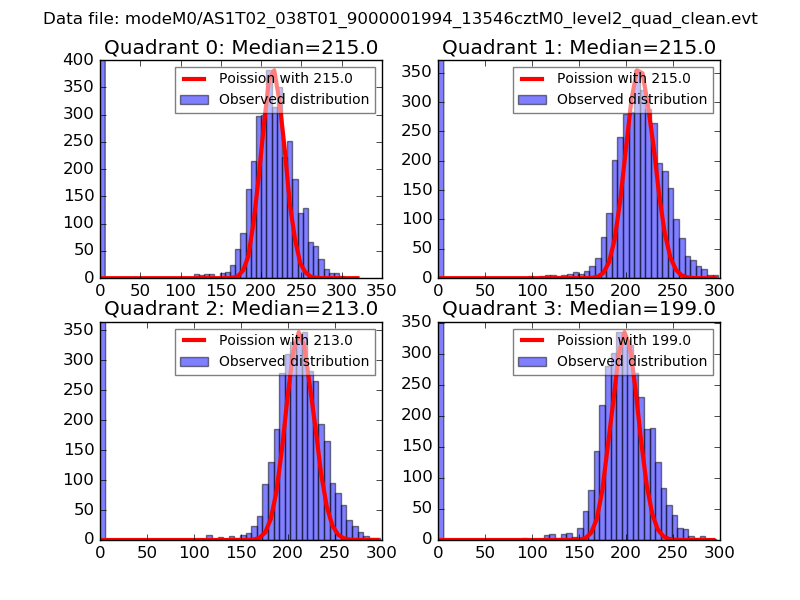 |
 |
| Quadrant-wise count rates Data is divided into 100 sec bins |
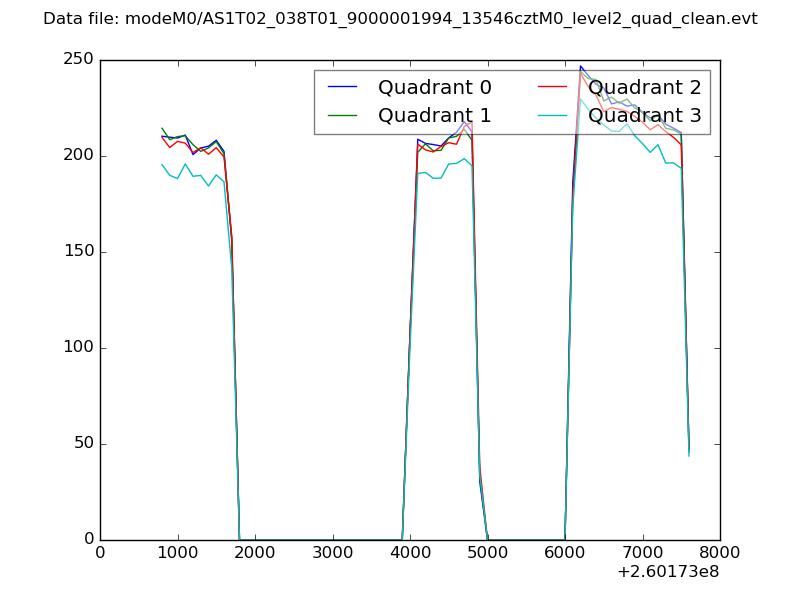 |
|
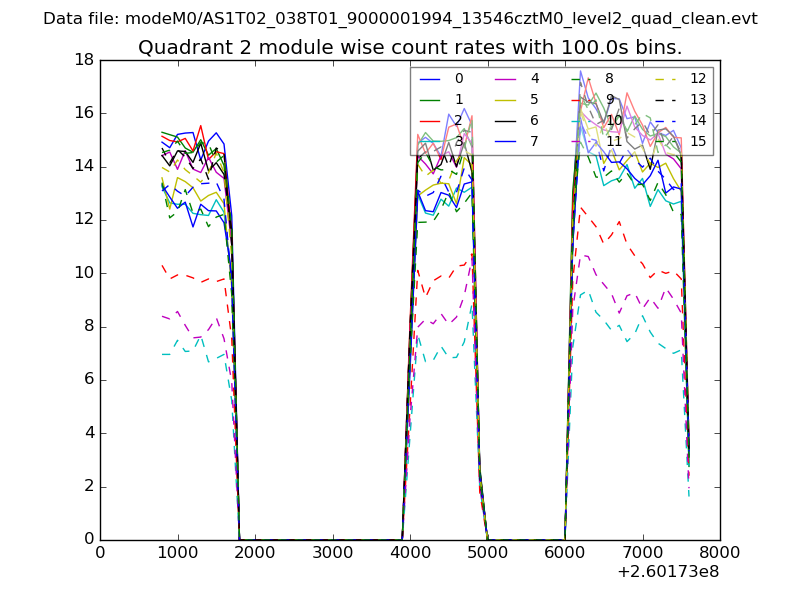
| Module-wise count rates for Quadrant A Data is divided into 100 sec bins |
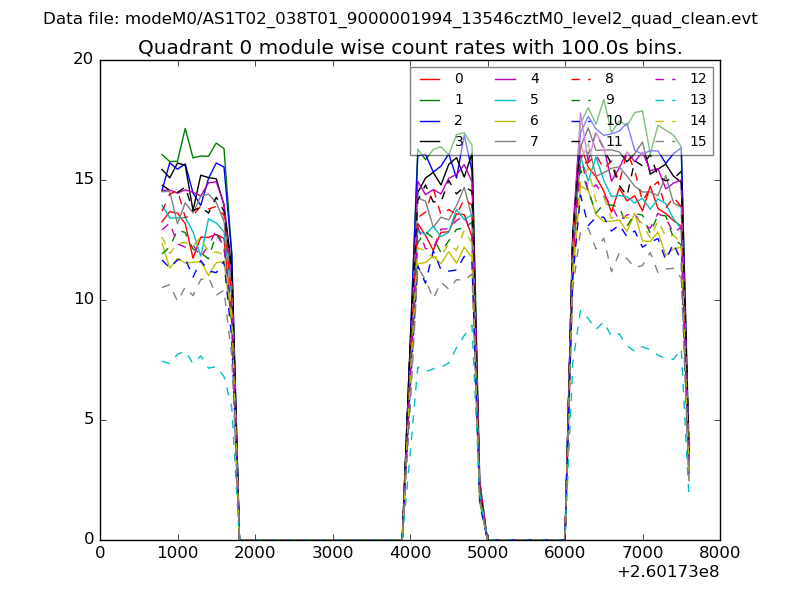 |
 |
| Module-wise count rates for Quadrant B Data is divided into 100 sec bins |
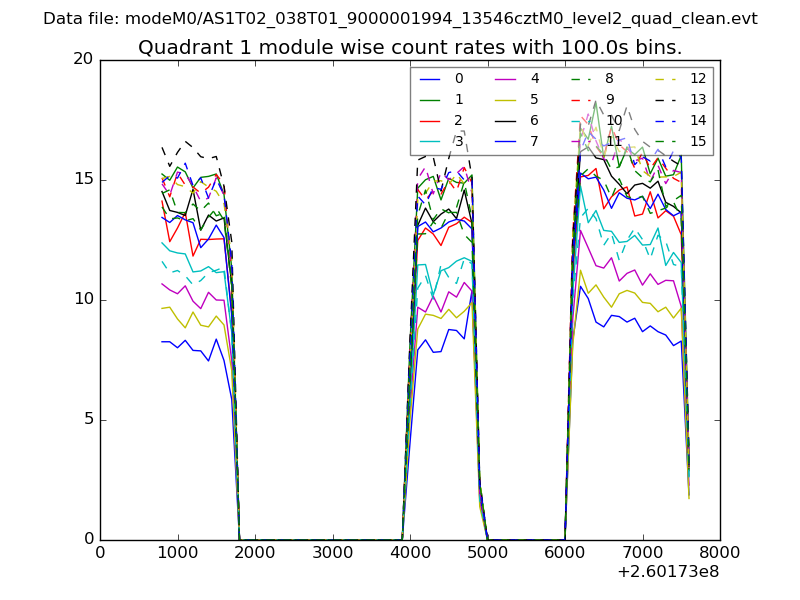 |
 |
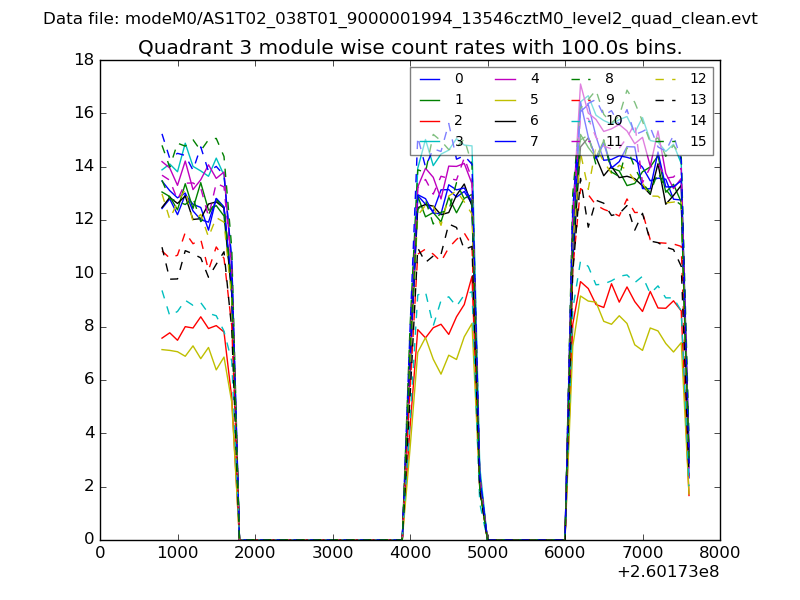
| Module-wise count rates for Quadrant C Data is divided into 100 sec bins |
 |
 |
| Module-wise count rates for Quadrant D Data is divided into 100 sec bins |
 |
 |
| Parameter | Plot |
|---|---|
| CZT HV Monitor | 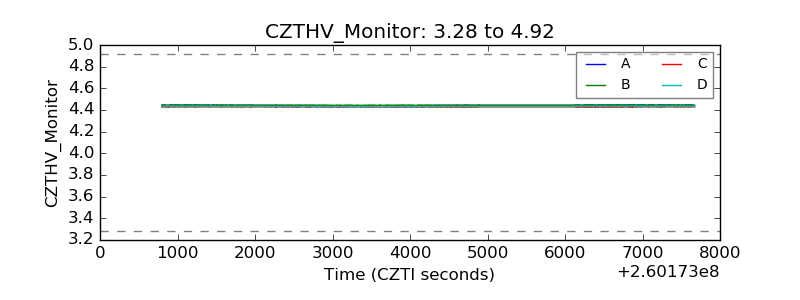 |
| D_VDD | 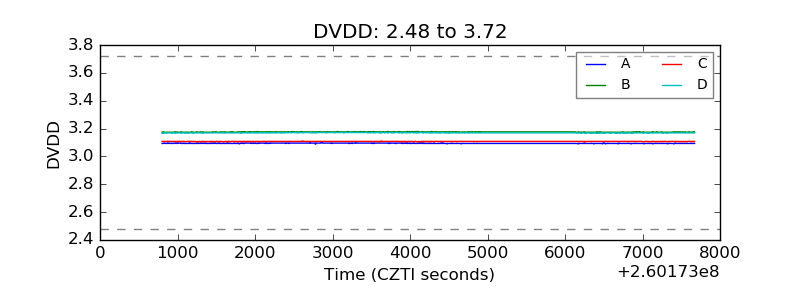 |
| Temperature 1 | 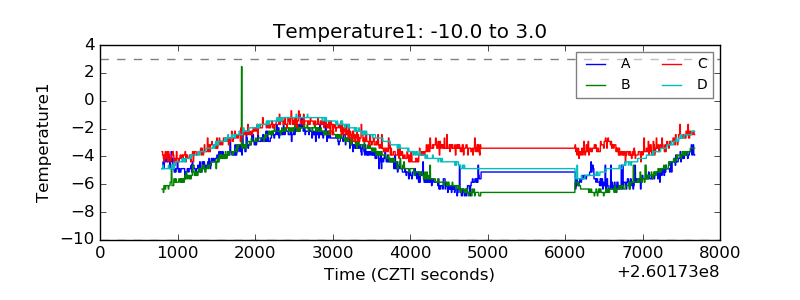 |
| Veto HV Monitor | 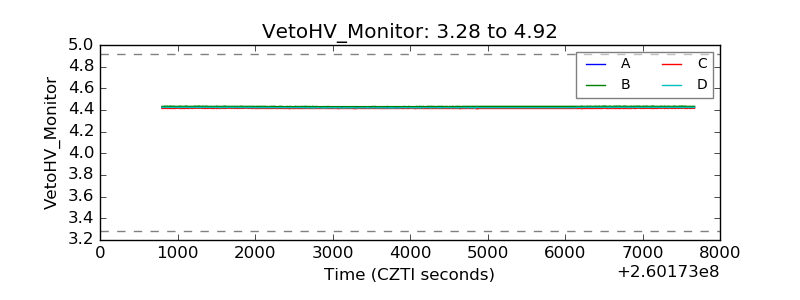 |
| Veto LLD | 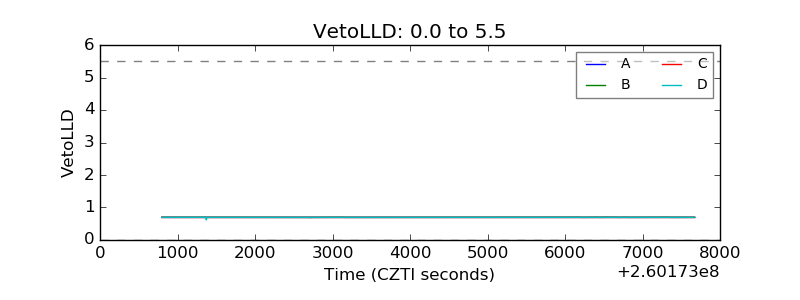 |
| Alpha Counter | 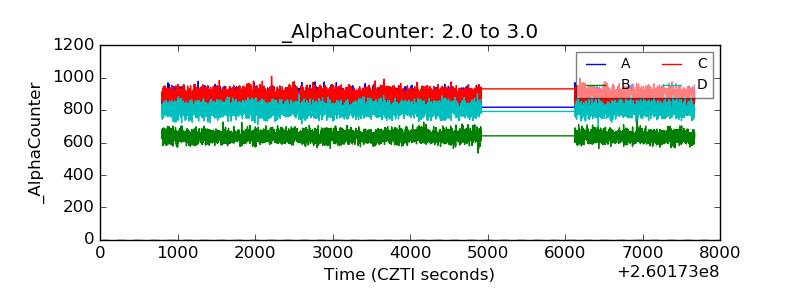 |
| _CPM_Rate | 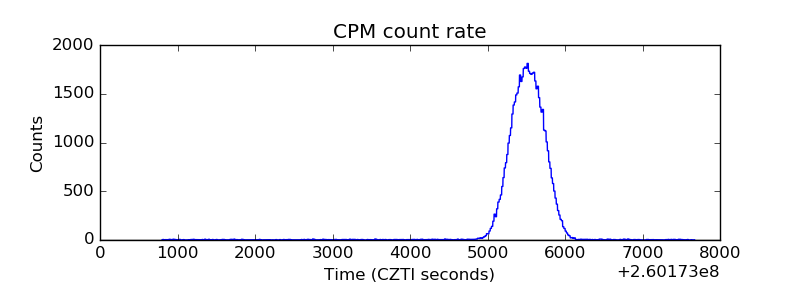 |
| CZT Counter |  |
| +2.5 Volts monitor |  |
| +5 Volts monitor |  |
| _ROLL_ROT | 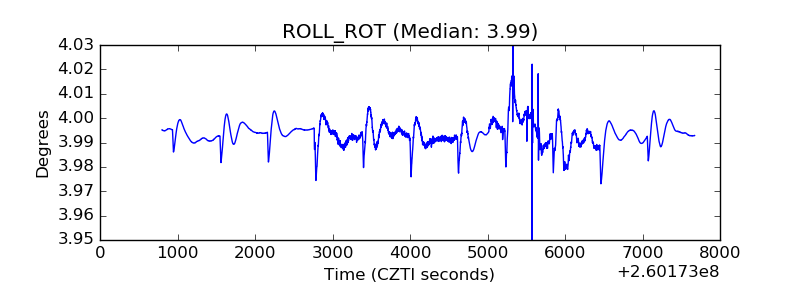 |
| _Roll_DEC | 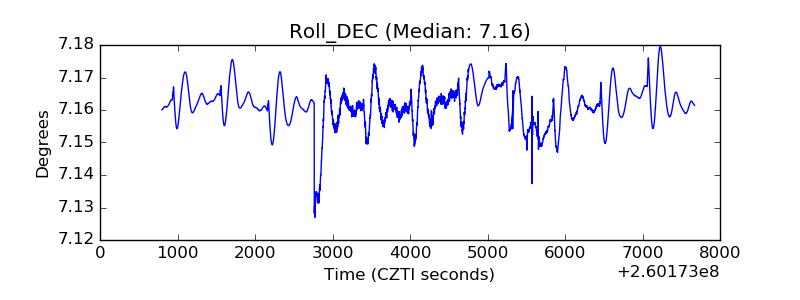 |
| _Roll_RA |  |
| Veto Counter | 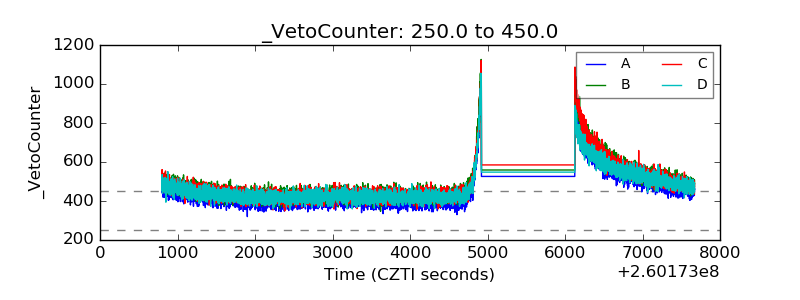 |