| Param | Original file | Final file |
|---|---|---|
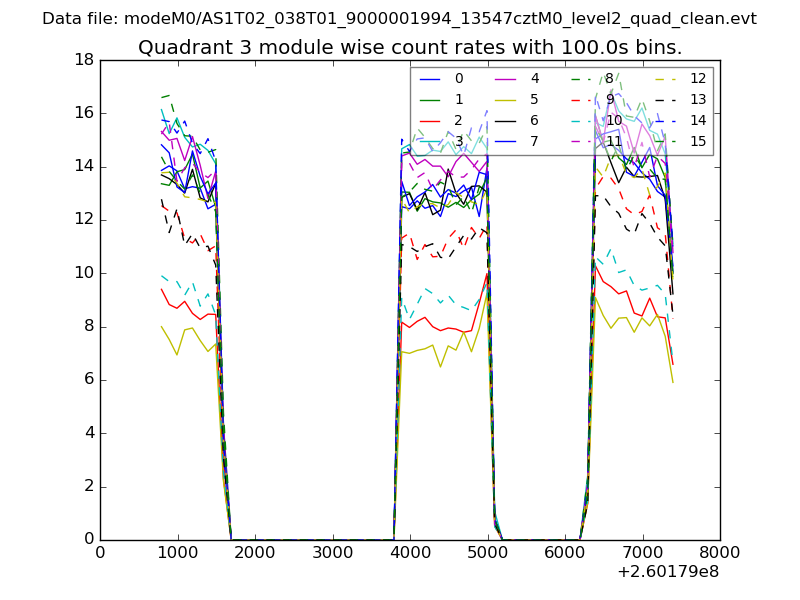
| Filename | modeM0/AS1T02_038T01_9000001994_13547cztM0_level2.evt | modeM0/AS1T02_038T01_9000001994_13547cztM0_level2_quad_clean.evt |
| Size (bytes) | 463,461,120 | 101,986,560 |
| Size | 442.0 MB | 97.3 MB |
| Events in quadrant A | 3,171,062 | 689,936 |
| Events in quadrant B | 3,295,372 | 687,477 |
| Events in quadrant C | 3,412,623 | 680,349 |
| Events in quadrant D | 3,776,101 | 638,347 |
| Mode M0 | |||
|---|---|---|---|
| Quadrant | BADHDUFLAG | Total packets | Discarded packets |
| A | 0 | 13152 | 2 |
| B | 0 | 13495 | 1 |
| C | 0 | 14242 | 1 |
| D | 0 | 14876 | 1 |
| Mode SS | |||
|---|---|---|---|
| Quadrant | BADHDUFLAG | Total packets | Discarded packets |
| A | 0 | 116 | 0 |
| B | 0 | 116 | 0 |
| C | 0 | 116 | 0 |
| D | 0 | 116 | 0 |
| Mode M9 | |||
|---|---|---|---|
| Quadrant | BADHDUFLAG | Total packets | Discarded packets |
| A | 0 | 12 | 0 |
| B | 0 | 12 | 0 |
| C | 0 | 12 | 0 |
| D | 0 | 12 | 0 |
| Quadrant | Total seconds | Saturated seconds | Saturation percentage |
|---|---|---|---|
| A | 5608 | 77 | 1.373039% |
| B | 5608 | 96 | 1.711840% |
| C | 5608 | 56 | 0.998573% |
| D | 5608 | 166 | 2.960057% |
Noise dominated data is calculated using 1-second bins in cleaned event files. If a bin has >2000 counts, and if more than 50% of those come from <1% of pixels, then it is considered to be noise-dominated and hence unusable.
| Quadrant | # 1 sec bins | Bins with >0 counts | Bins with >2000 counts | High rate bins dominated by noise | Noise dominated (total time) | Noise dominated (detector-on time) | Marked lightcurve |
|---|---|---|---|---|---|---|---|
| A | 6879 | 5609 | 5 | 5 | 0.07% | 0.09% |  |
| B | 6879 | 5609 | 17 | 17 | 0.25% | 0.30% |  |
| C | 6879 | 5609 | 1 | 1 | 0.01% | 0.02% | 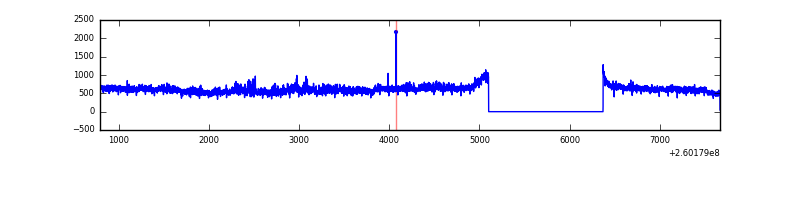 |
| D | 6879 | 5609 | 79 | 79 | 1.15% | 1.41% | 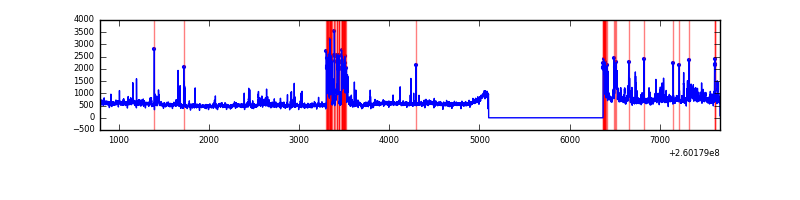 |
Top three noisy pixels from each quadrant. If the there are fewer than three noisy pixels in the level2.evt file, extra rows are filled as -1
| Pixel properties | Quadrant properties | ||||||
|---|---|---|---|---|---|---|---|
| Quadrant | DetID | PixID | Counts | Sigma | Mean | Median | Sigma |
| A | 15 | 69 | 24077 | 134.02 | 815 | 803 | 173.7 |
| A | 1 | 162 | 10308 | 54.73 | 815 | 803 | 173.7 |
| A | 0 | 226 | 7316 | 37.5 | 815 | 803 | 173.7 |
| B | 3 | 64 | 69295 | 435.78 | 798 | 785 | 157.2 |
| B | 4 | 142 | 37313 | 232.35 | 798 | 785 | 157.2 |
| B | 4 | 80 | 21993 | 134.9 | 798 | 785 | 157.2 |
| C | 3 | 233 | 373237 | 2022.67 | 779 | 788 | 184.1 |
| C | 13 | 61 | 5466 | 25.4 | 779 | 788 | 184.1 |
| C | 14 | 234 | 4667 | 21.07 | 779 | 788 | 184.1 |
| D | 2 | 14 | 244451 | 1273.26 | 777 | 758 | 191.4 |
| D | 13 | 122 | 238457 | 1241.94 | 777 | 758 | 191.4 |
| D | 8 | 195 | 207754 | 1081.52 | 777 | 758 | 191.4 |
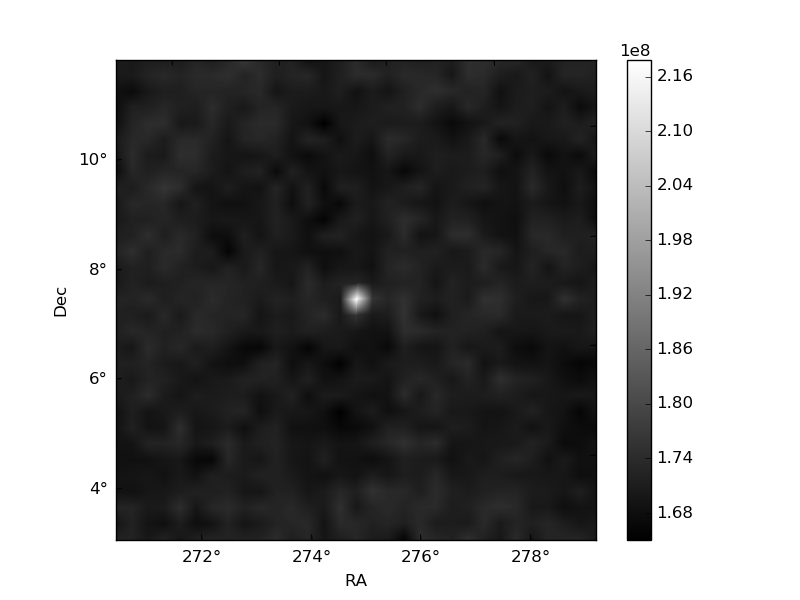
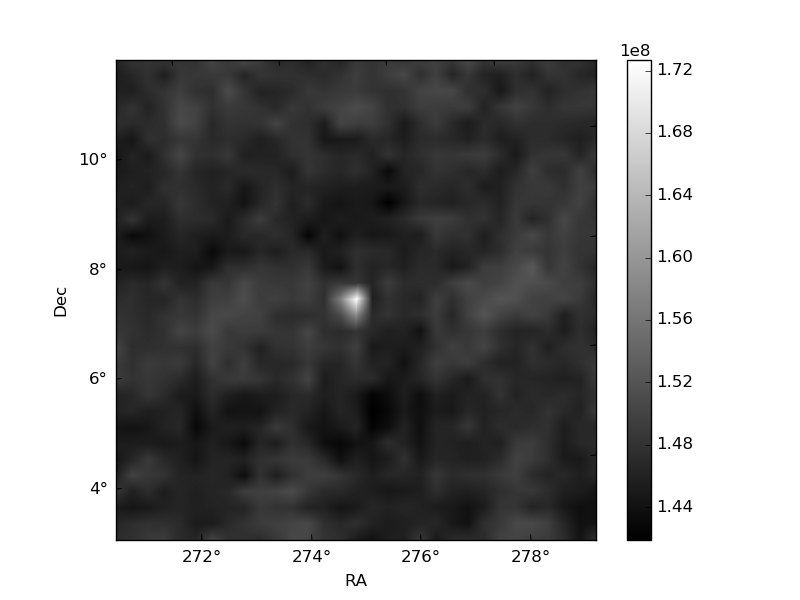
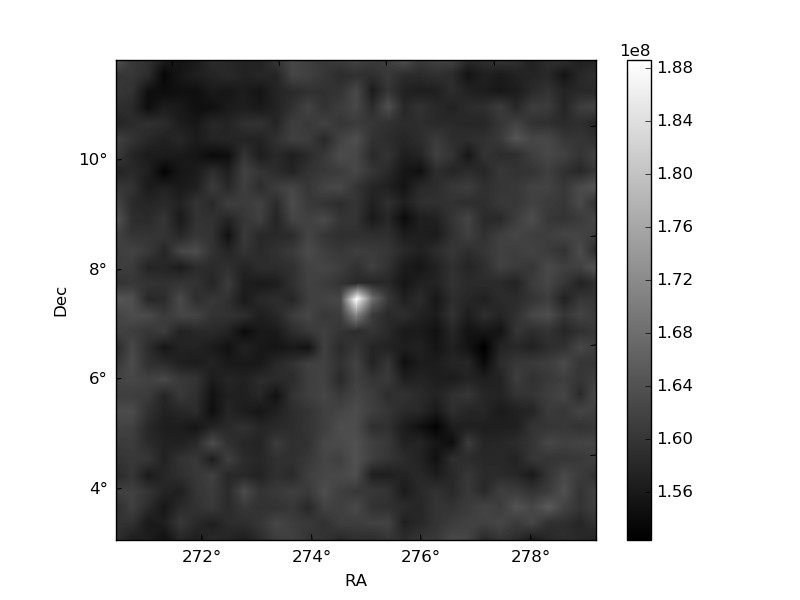
Histogram calculated using DETX and DETY for each event in the final _common_clean file
| Quadrant A | 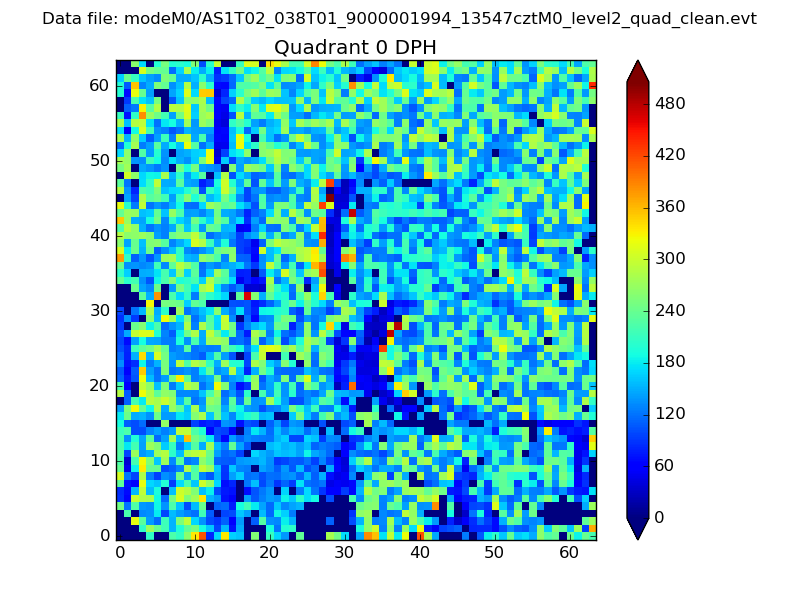 |
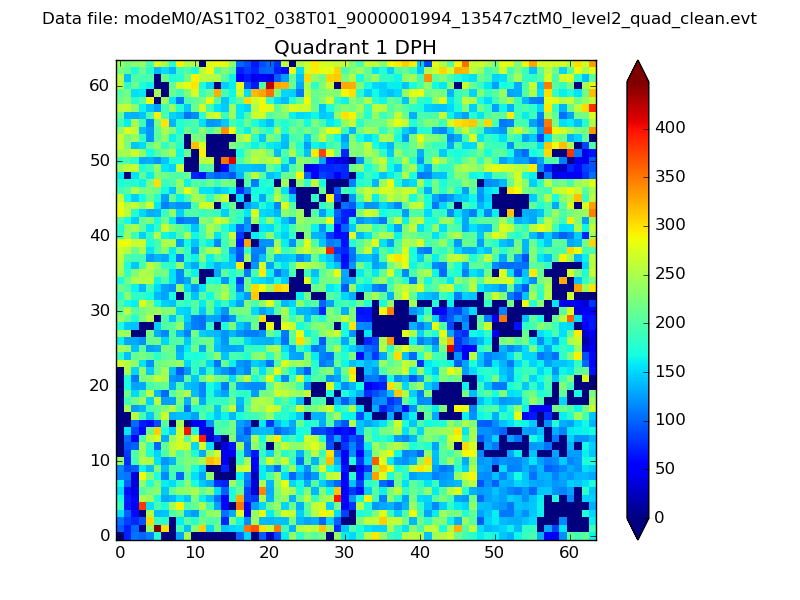 |
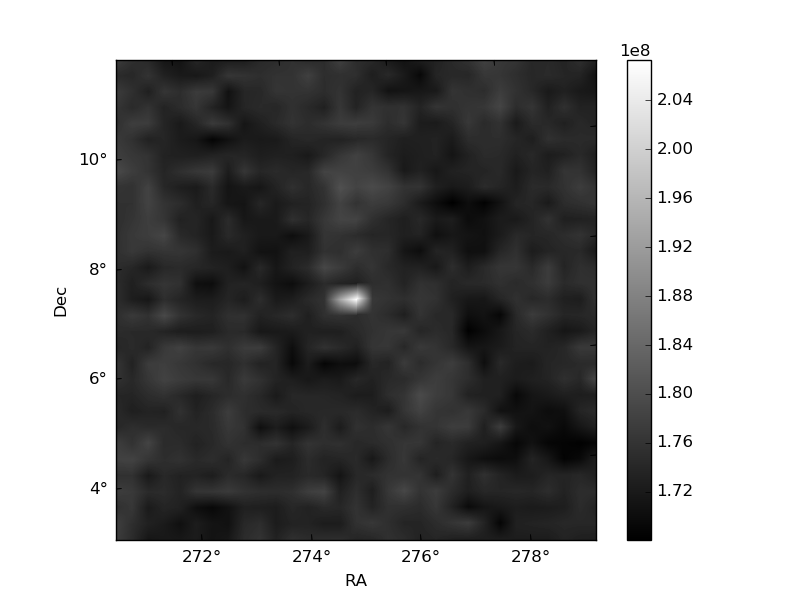
Quadrant B |
|---|---|---|---|
| Quadrant D | 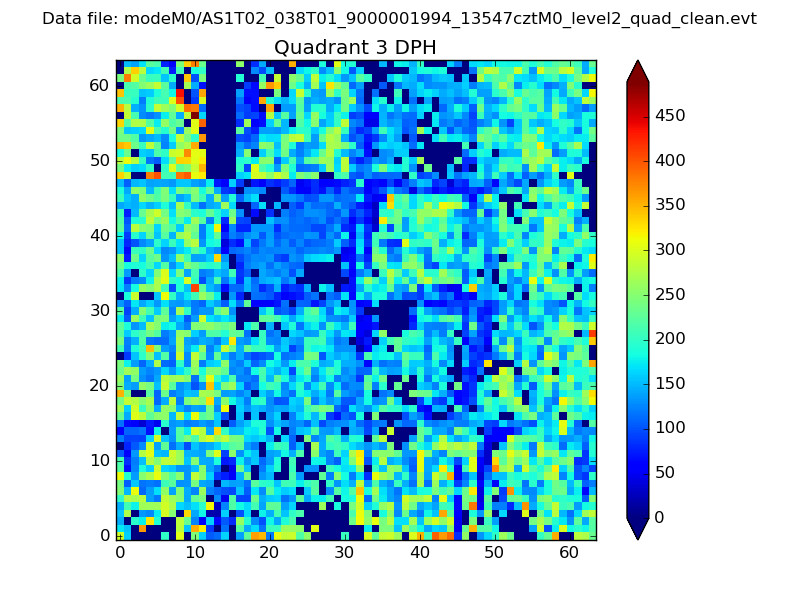 |
 |
Quadrant C |
| Plot type | Count rate plots | Images |
|---|---|---|
| Comparison with Poisson distribution Blue bars denote a histogram of data divided into 1 sec bins. Red curve is a Poisson curve with rate = median count rate of data. |
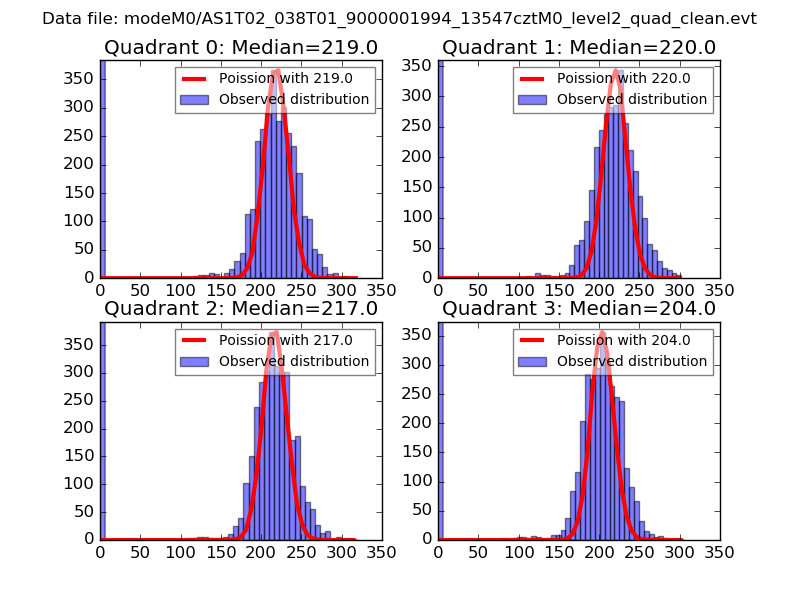 |
 |
| Quadrant-wise count rates Data is divided into 100 sec bins |
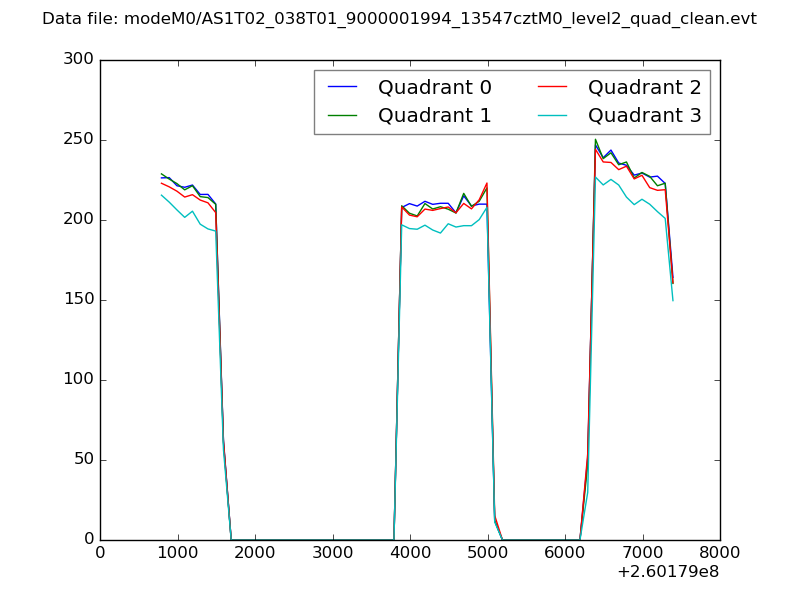 |
|
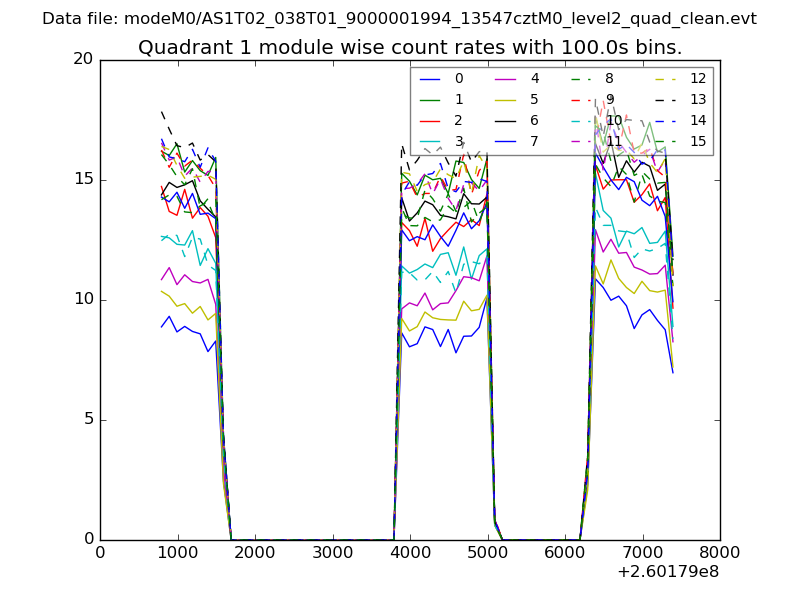
| Module-wise count rates for Quadrant A Data is divided into 100 sec bins |
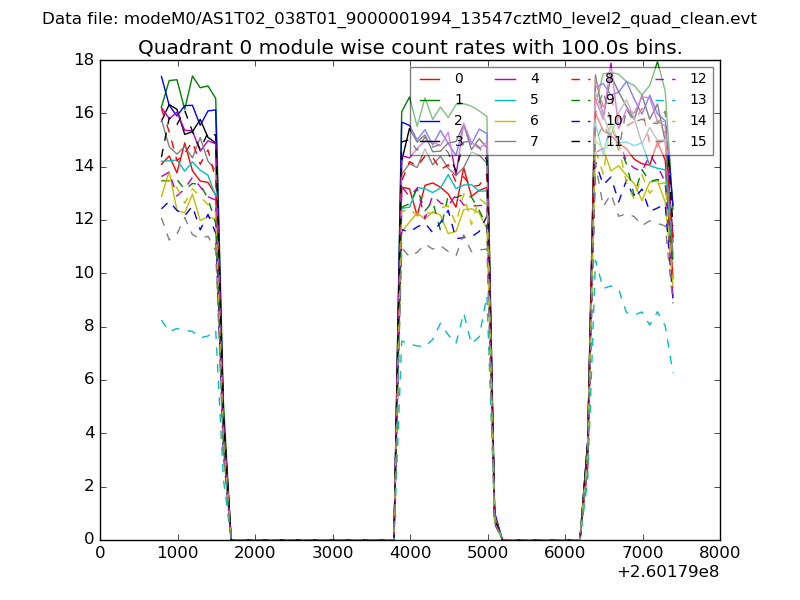 |
 |
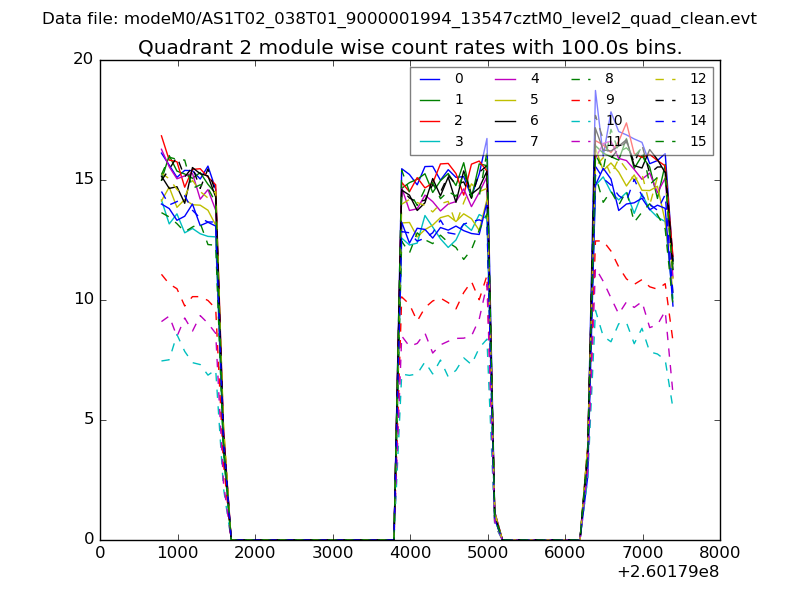
| Module-wise count rates for Quadrant B Data is divided into 100 sec bins |
 |
 |
| Module-wise count rates for Quadrant C Data is divided into 100 sec bins |
 |
 |
| Module-wise count rates for Quadrant D Data is divided into 100 sec bins |
 |
 |
| Parameter | Plot |
|---|---|
| CZT HV Monitor | 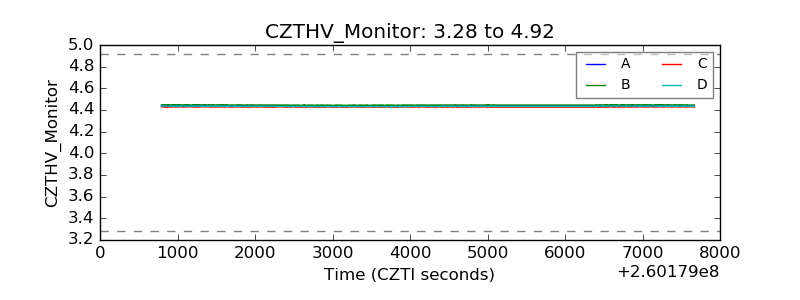 |
| D_VDD | 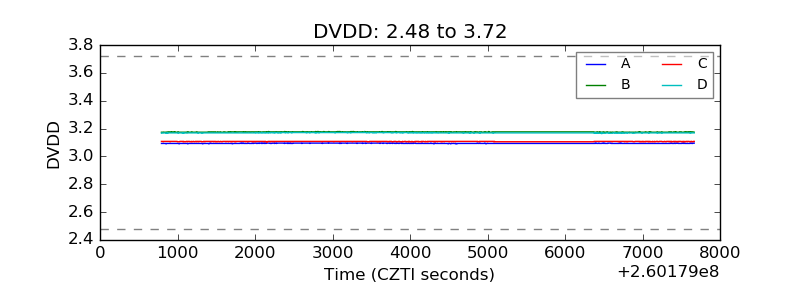 |
| Temperature 1 | 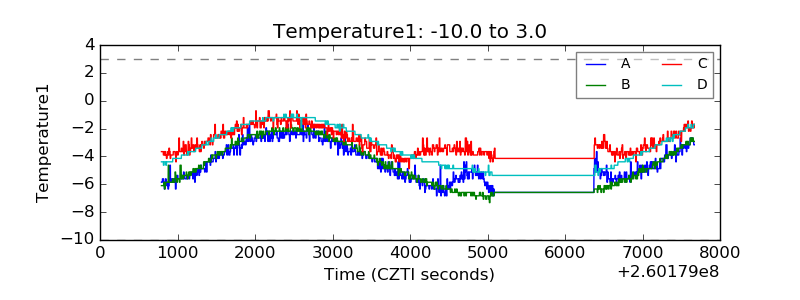 |
| Veto HV Monitor |  |
| Veto LLD | 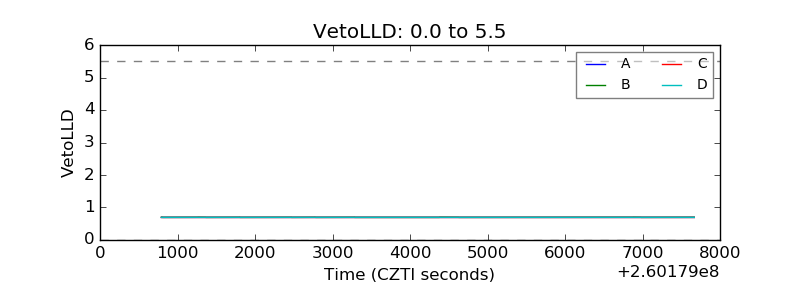 |
| Alpha Counter | 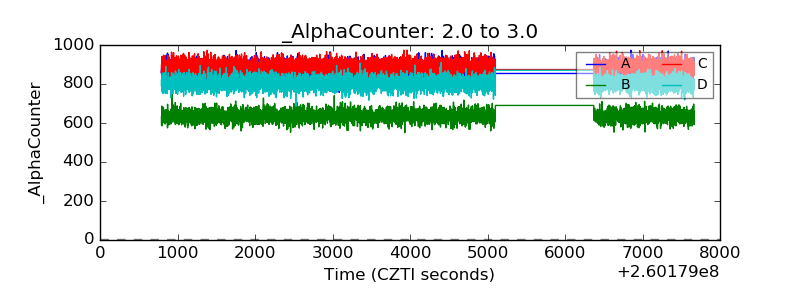 |
| _CPM_Rate |  |
| CZT Counter | 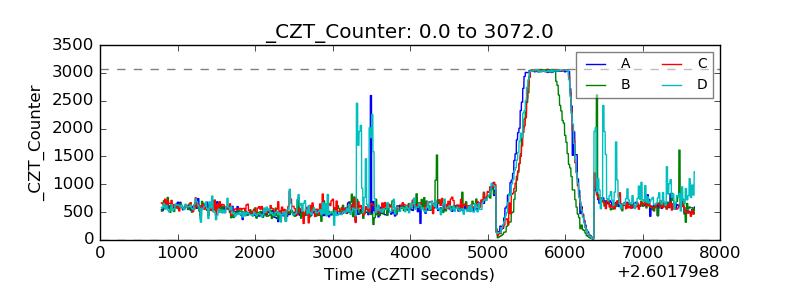 |
| +2.5 Volts monitor |  |
| +5 Volts monitor |  |
| _ROLL_ROT | 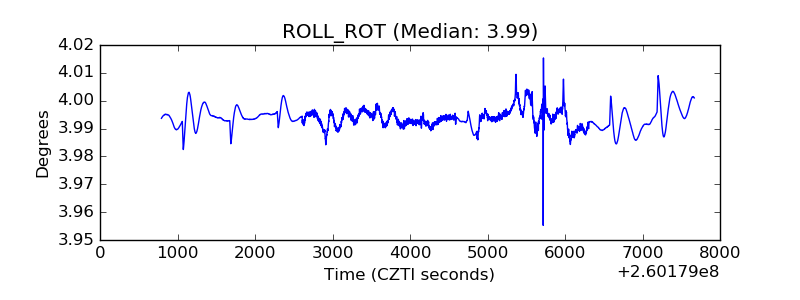 |
| _Roll_DEC | 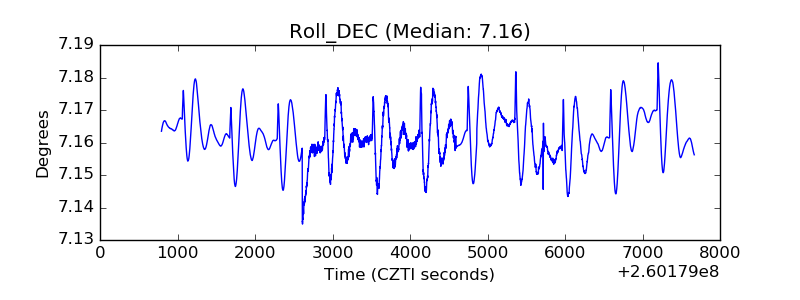 |
| _Roll_RA | 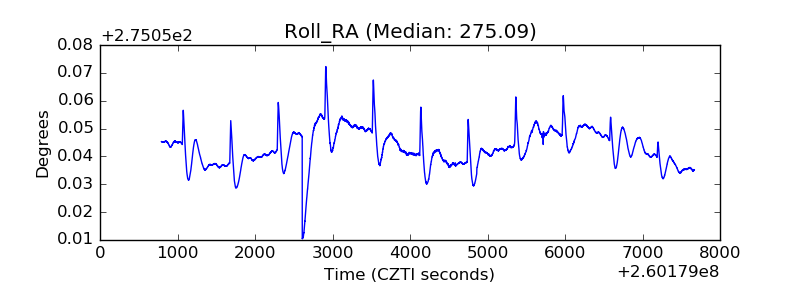 |
| Veto Counter | 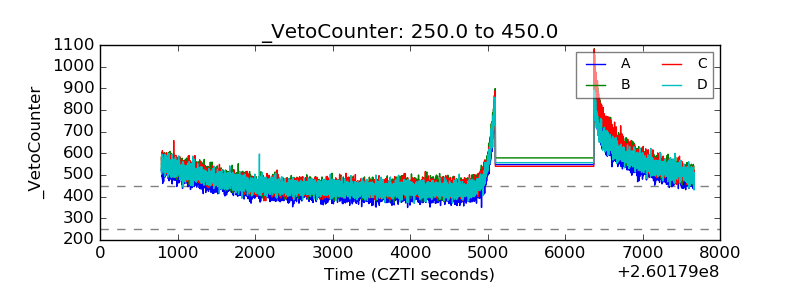 |