| Param | Original file | Final file |
|---|---|---|
| Filename | modeM0/AS1T02_038T01_9000001994_13549cztM0_level2.evt | modeM0/AS1T02_038T01_9000001994_13549cztM0_level2_quad_clean.evt |
| Size (bytes) | 550,667,520 | 101,764,800 |
| Size | 525.2 MB | 97.1 MB |
| Events in quadrant A | 3,961,873 | 667,467 |
| Events in quadrant B | 4,309,434 | 662,710 |
| Events in quadrant C | 3,773,091 | 658,775 |
| Events in quadrant D | 4,175,836 | 623,046 |
| Mode M0 | |||
|---|---|---|---|
| Quadrant | BADHDUFLAG | Total packets | Discarded packets |
| A | 0 | 15902 | 3 |
| B | 0 | 17161 | 2 |
| C | 0 | 15398 | 2 |
| D | 0 | 16598 | 2 |
| Mode SS | |||
|---|---|---|---|
| Quadrant | BADHDUFLAG | Total packets | Discarded packets |
| A | 0 | 138 | 0 |
| B | 0 | 138 | 0 |
| C | 0 | 138 | 0 |
| D | 0 | 138 | 0 |
| Mode M9 | |||
|---|---|---|---|
| Quadrant | BADHDUFLAG | Total packets | Discarded packets |
| A | 0 | 12 | 0 |
| B | 0 | 12 | 0 |
| C | 0 | 12 | 0 |
| D | 0 | 13 | 0 |
| Quadrant | Total seconds | Saturated seconds | Saturation percentage |
|---|---|---|---|
| A | 6736 | 179 | 2.657363% |
| B | 6736 | 278 | 4.127078% |
| C | 6736 | 92 | 1.365796% |
| D | 6736 | 136 | 2.019002% |
Noise dominated data is calculated using 1-second bins in cleaned event files. If a bin has >2000 counts, and if more than 50% of those come from <1% of pixels, then it is considered to be noise-dominated and hence unusable.
| Quadrant | # 1 sec bins | Bins with >0 counts | Bins with >2000 counts | High rate bins dominated by noise | Noise dominated (total time) | Noise dominated (detector-on time) | Marked lightcurve |
|---|---|---|---|---|---|---|---|
| A | 7877 | 6737 | 32 | 32 | 0.41% | 0.47% | 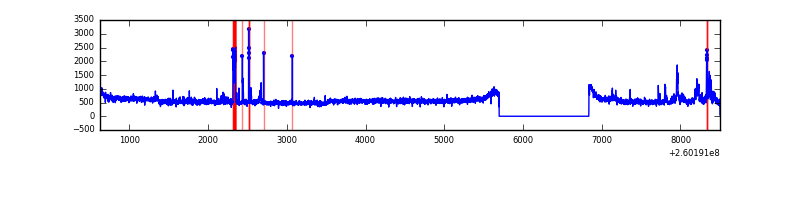 |
| B | 7876 | 6736 | 100 | 100 | 1.27% | 1.48% | 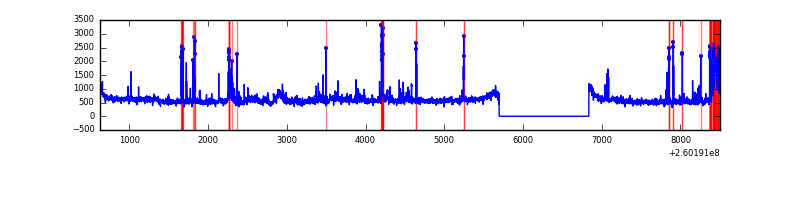 |
| C | 7877 | 6737 | 4 | 4 | 0.05% | 0.06% | 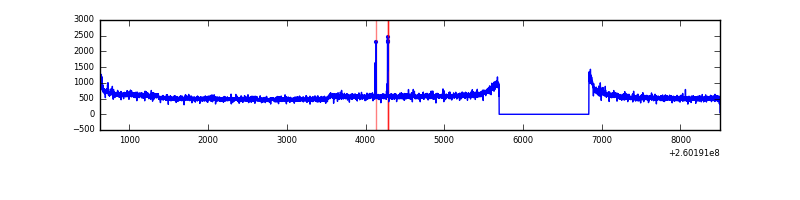 |
| D | 7877 | 6737 | 30 | 30 | 0.38% | 0.45% | 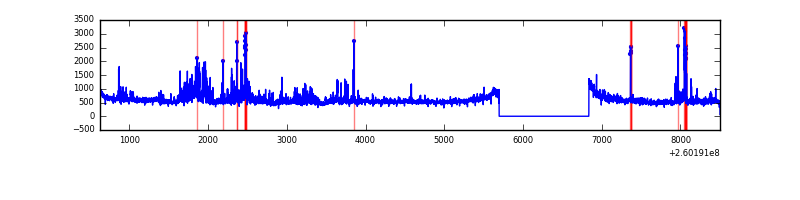 |
Top three noisy pixels from each quadrant. If the there are fewer than three noisy pixels in the level2.evt file, extra rows are filled as -1
| Pixel properties | Quadrant properties | ||||||
|---|---|---|---|---|---|---|---|
| Quadrant | DetID | PixID | Counts | Sigma | Mean | Median | Sigma |
| A | 14 | 238 | 244719 | 1229.69 | 954 | 941 | 198.2 |
| A | 1 | 162 | 24281 | 117.73 | 954 | 941 | 198.2 |
| A | 1 | 178 | 8368 | 37.46 | 954 | 941 | 198.2 |
| B | 3 | 64 | 252424 | 1385.51 | 933 | 916 | 181.5 |
| B | 0 | 182 | 203709 | 1117.15 | 933 | 916 | 181.5 |
| B | 4 | 142 | 94090 | 513.28 | 933 | 916 | 181.5 |
| C | 3 | 233 | 181276 | 846.5 | 917 | 927 | 213.1 |
| C | 12 | 4 | 11368 | 49.0 | 917 | 927 | 213.1 |
| C | 14 | 234 | 8291 | 34.56 | 917 | 927 | 213.1 |
| D | 13 | 122 | 255329 | 1130.49 | 918 | 897 | 225.1 |
| D | 8 | 195 | 193798 | 857.1 | 918 | 897 | 225.1 |
| D | 5 | 222 | 125894 | 555.38 | 918 | 897 | 225.1 |
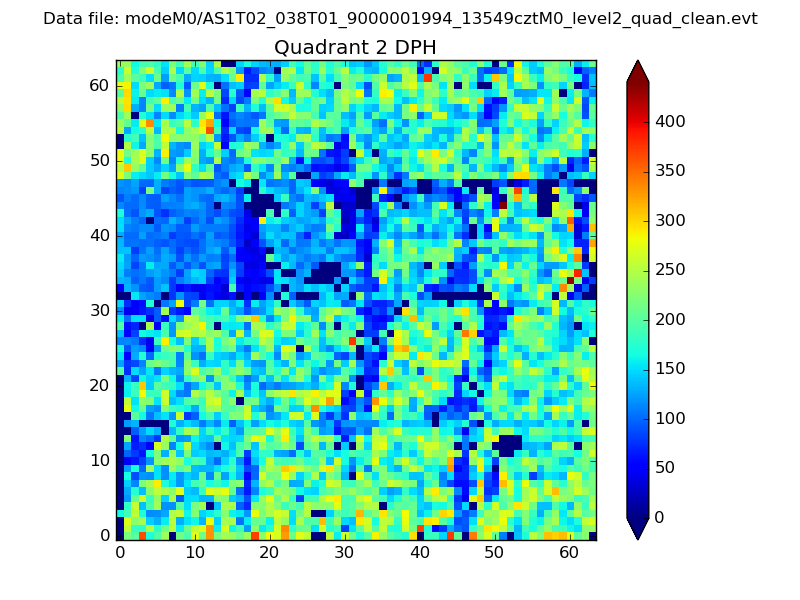
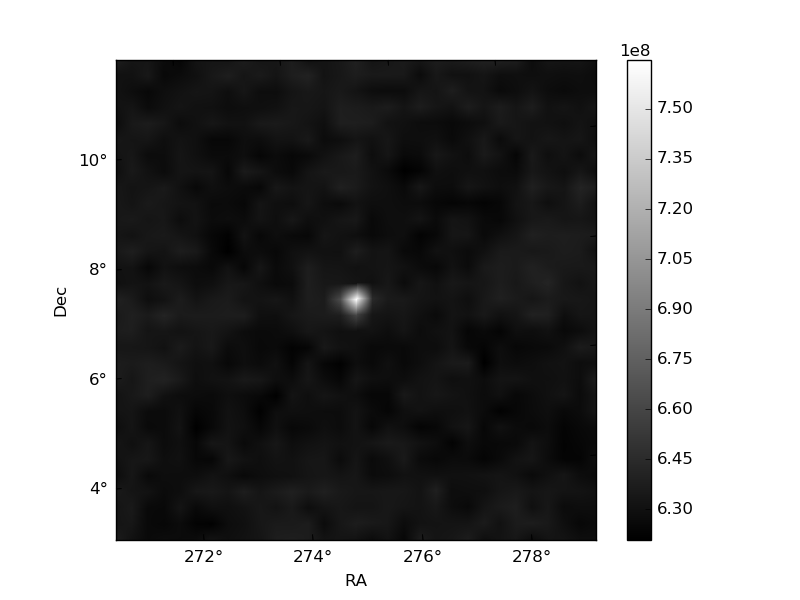
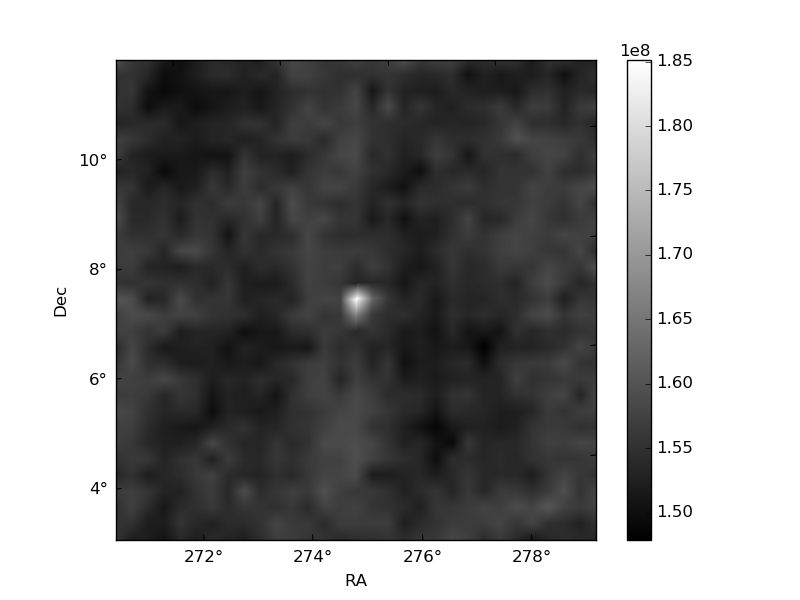
Histogram calculated using DETX and DETY for each event in the final _common_clean file
| Quadrant A | 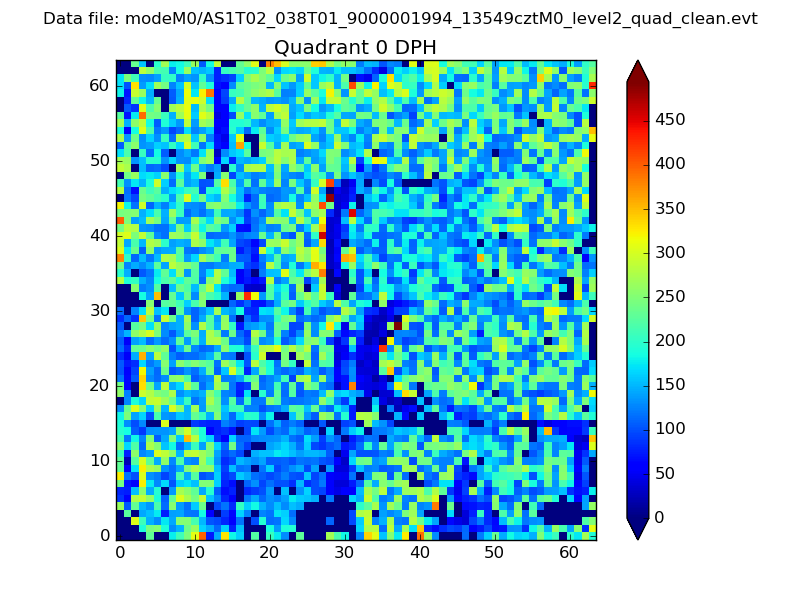 |
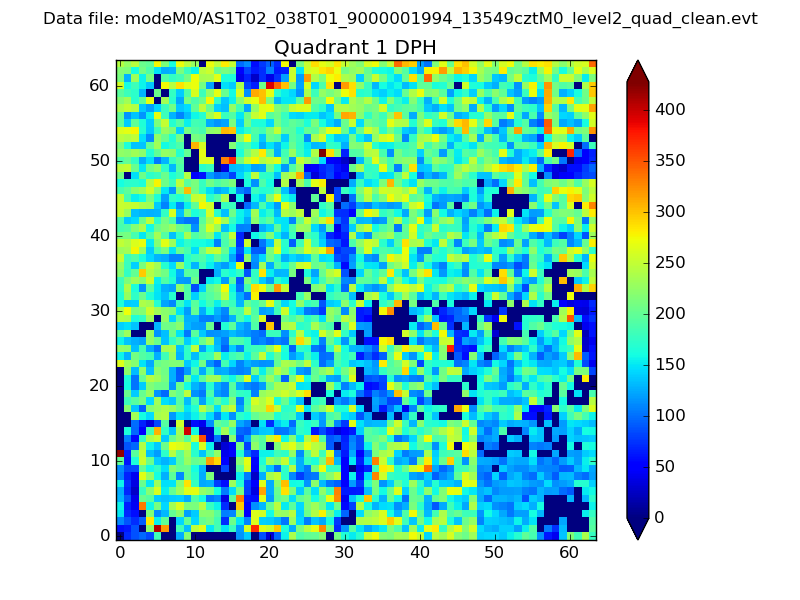 |
Quadrant B |
|---|---|---|---|
| Quadrant D | 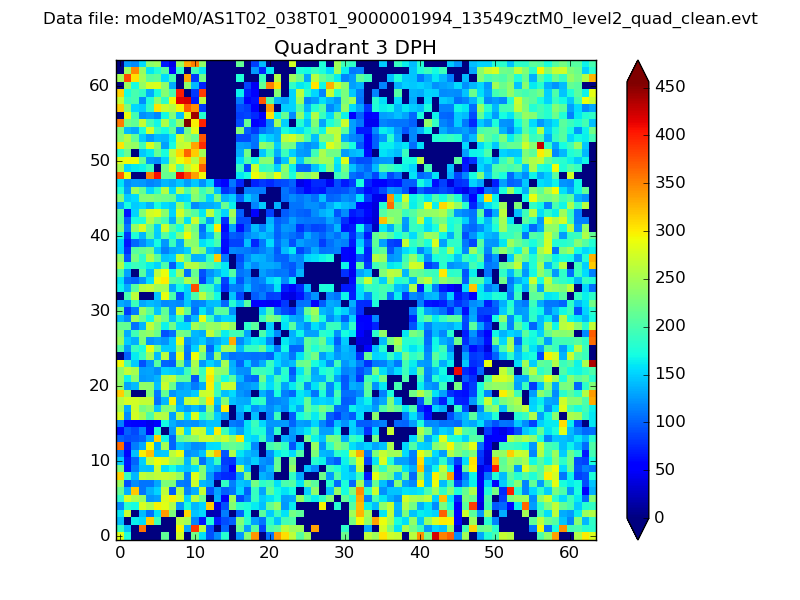 |
 |
Quadrant C |
| Plot type | Count rate plots | Images |
|---|---|---|
| Comparison with Poisson distribution Blue bars denote a histogram of data divided into 1 sec bins. Red curve is a Poisson curve with rate = median count rate of data. |
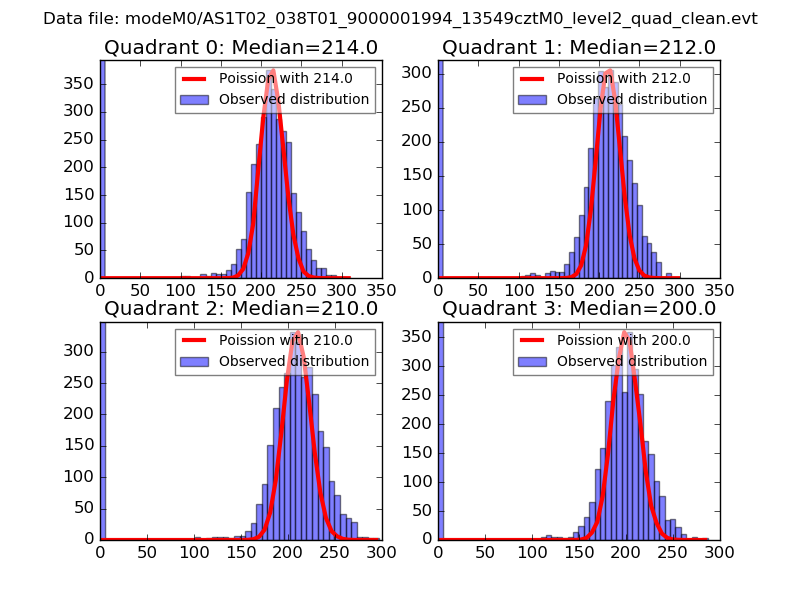 |
 |
| Quadrant-wise count rates Data is divided into 100 sec bins |
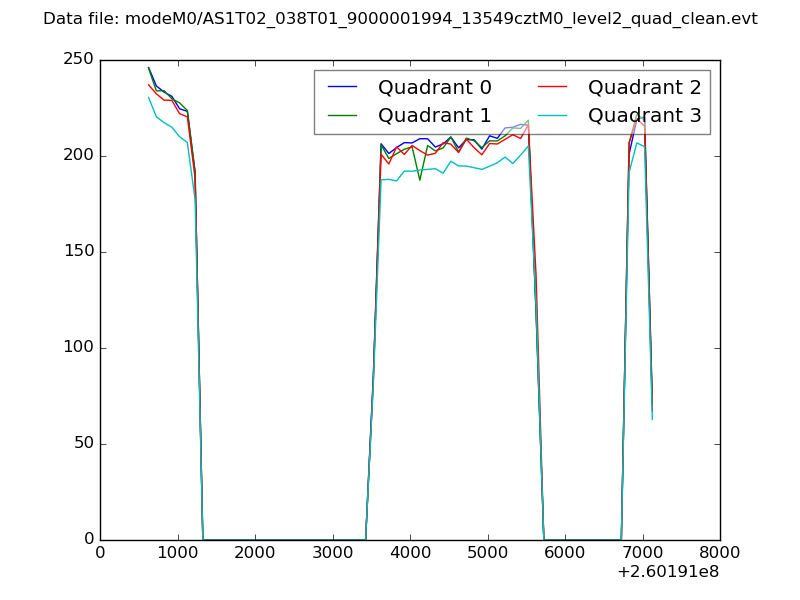 |
|
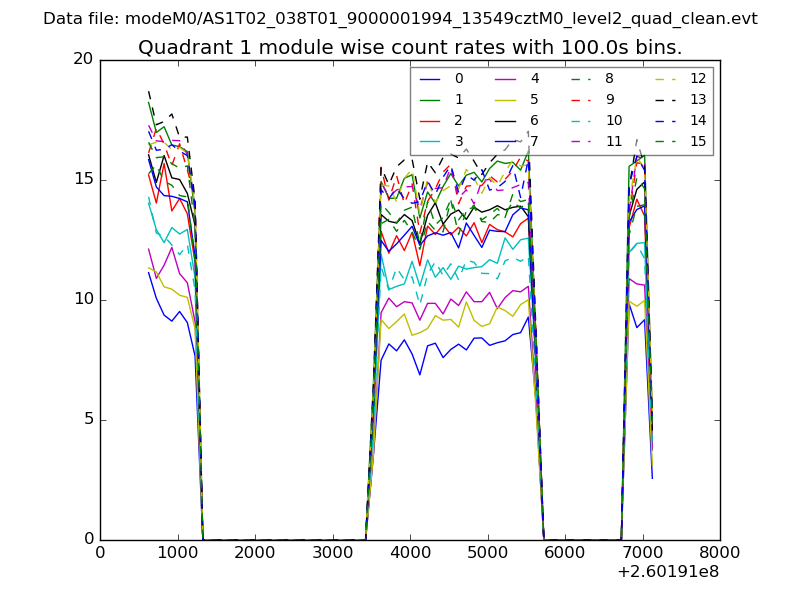
| Module-wise count rates for Quadrant A Data is divided into 100 sec bins |
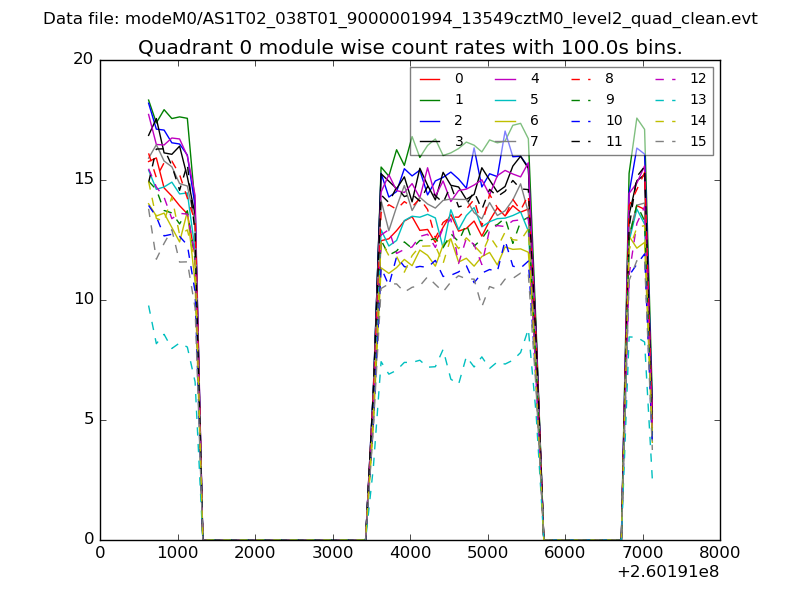 |
 |
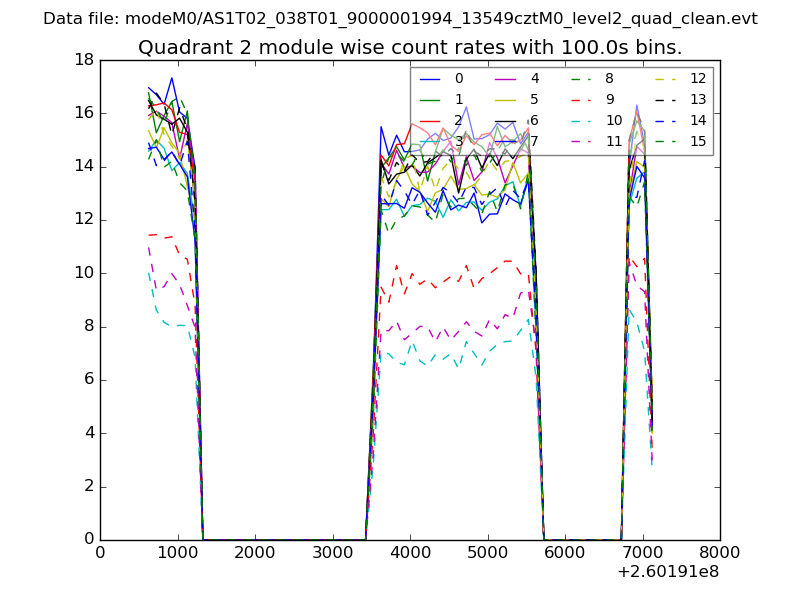
| Module-wise count rates for Quadrant B Data is divided into 100 sec bins |
 |
 |
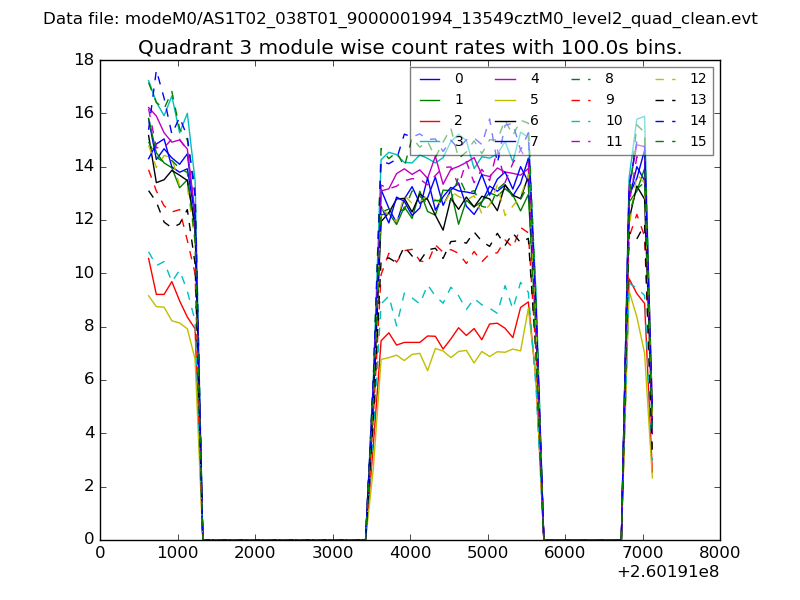
| Module-wise count rates for Quadrant C Data is divided into 100 sec bins |
 |
 |
| Module-wise count rates for Quadrant D Data is divided into 100 sec bins |
 |
 |
| Parameter | Plot |
|---|---|
| CZT HV Monitor | 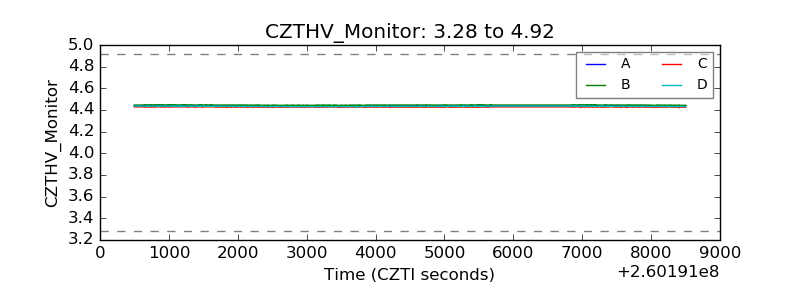 |
| D_VDD |  |
| Temperature 1 | 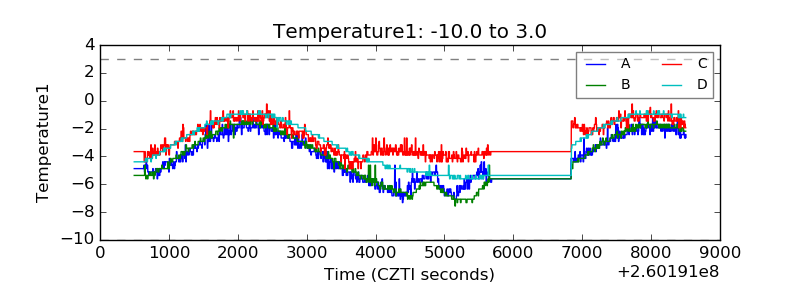 |
| Veto HV Monitor |  |
| Veto LLD | 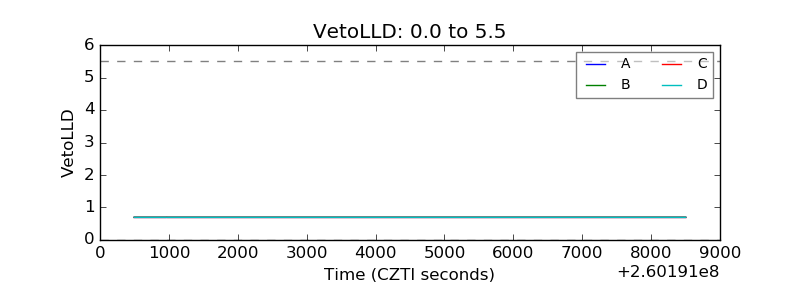 |
| Alpha Counter | 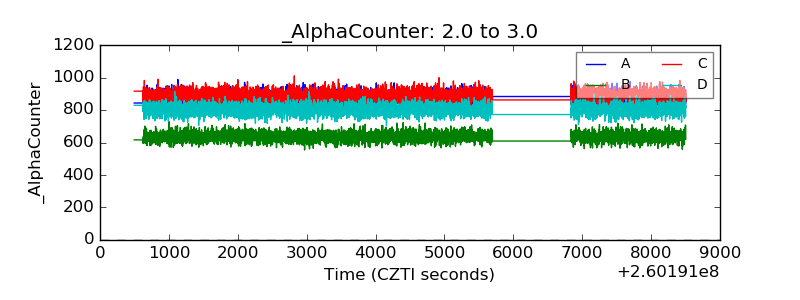 |
| _CPM_Rate | 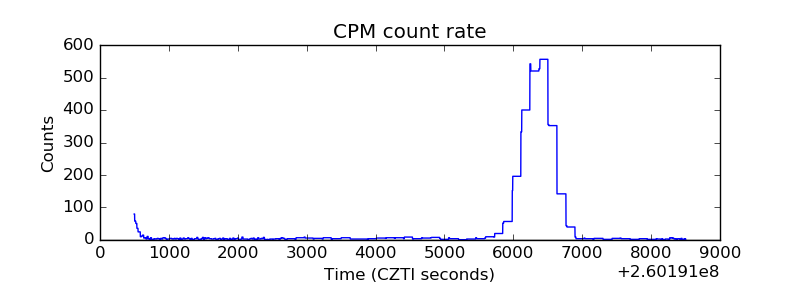 |
| CZT Counter | 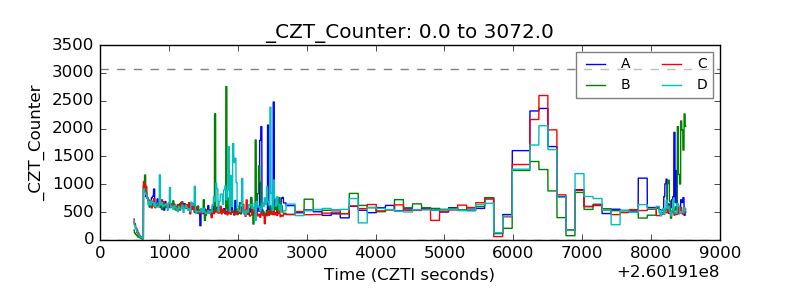 |
| +2.5 Volts monitor |  |
| +5 Volts monitor |  |
| _ROLL_ROT | 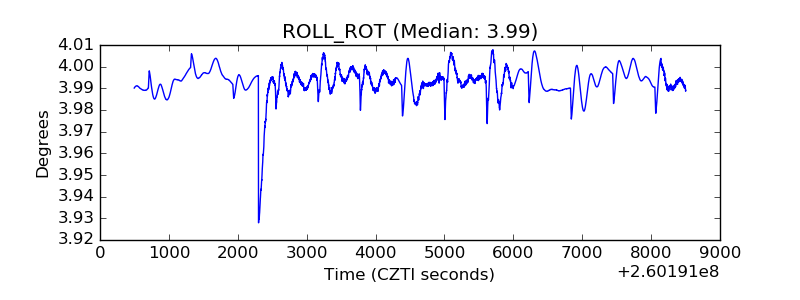 |
| _Roll_DEC | 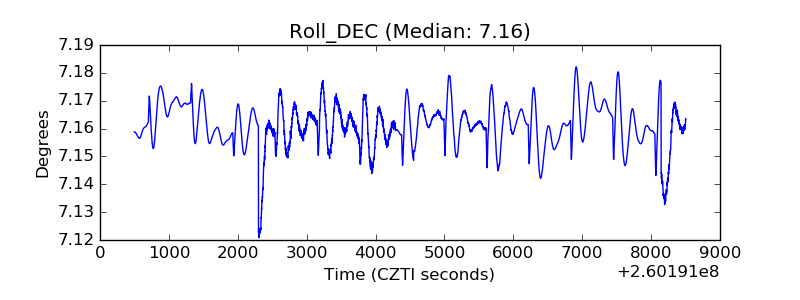 |
| _Roll_RA | 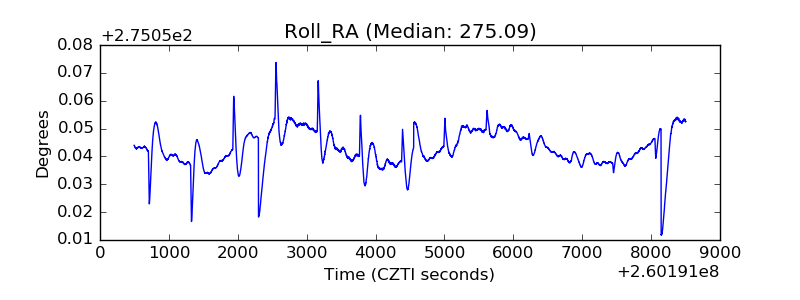 |
| Veto Counter | 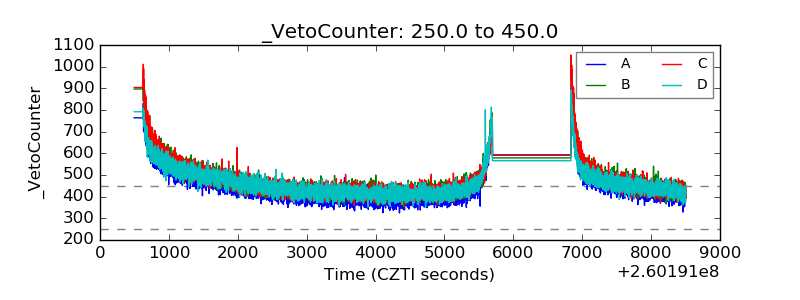 |