| Param | Original file | Final file |
|---|---|---|
| Filename | modeM0/AS1T02_038T01_9000001994_13550cztM0_level2.evt | modeM0/AS1T02_038T01_9000001994_13550cztM0_level2_quad_clean.evt |
| Size (bytes) | 306,731,520 | 44,686,080 |
| Size | 292.5 MB | 42.6 MB |
| Events in quadrant A | 2,064,331 | 282,195 |
| Events in quadrant B | 2,924,836 | 274,495 |
| Events in quadrant C | 1,938,703 | 278,184 |
| Events in quadrant D | 2,112,015 | 259,301 |
| Mode M0 | |||
|---|---|---|---|
| Quadrant | BADHDUFLAG | Total packets | Discarded packets |
| A | 0 | 8307 | 0 |
| B | 0 | 10928 | 0 |
| C | 0 | 7830 | 0 |
| D | 0 | 8456 | 0 |
| Mode SS | |||
|---|---|---|---|
| Quadrant | BADHDUFLAG | Total packets | Discarded packets |
| A | 0 | 72 | 0 |
| B | 0 | 72 | 0 |
| C | 0 | 72 | 0 |
| D | 0 | 72 | 0 |
| Quadrant | Total seconds | Saturated seconds | Saturation percentage |
|---|---|---|---|
| A | 3656 | 15 | 0.410284% |
| B | 3656 | 579 | 15.836980% |
| C | 3656 | 1 | 0.027352% |
| D | 3656 | 43 | 1.176149% |
Noise dominated data is calculated using 1-second bins in cleaned event files. If a bin has >2000 counts, and if more than 50% of those come from <1% of pixels, then it is considered to be noise-dominated and hence unusable.
| Quadrant | # 1 sec bins | Bins with >0 counts | Bins with >2000 counts | High rate bins dominated by noise | Noise dominated (total time) | Noise dominated (detector-on time) | Marked lightcurve |
|---|---|---|---|---|---|---|---|
| A | 3657 | 3657 | 5 | 5 | 0.14% | 0.14% | 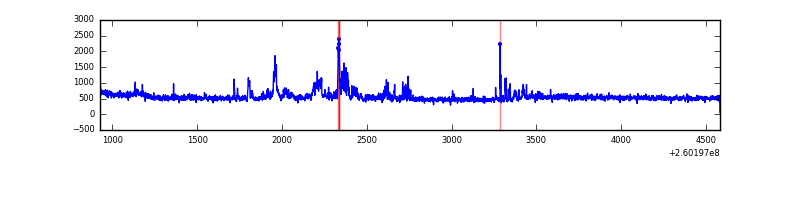 |
| B | 3657 | 3657 | 242 | 242 | 6.62% | 6.62% | 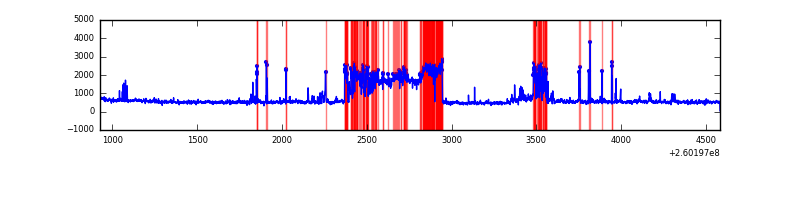 |
| C | 3657 | 3657 | 0 | 0 | 0.00% | 0.00% | 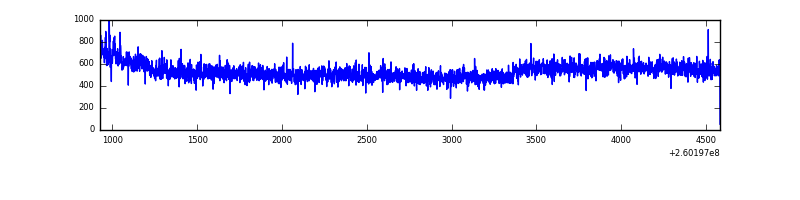 |
| D | 3657 | 3657 | 37 | 37 | 1.01% | 1.01% | 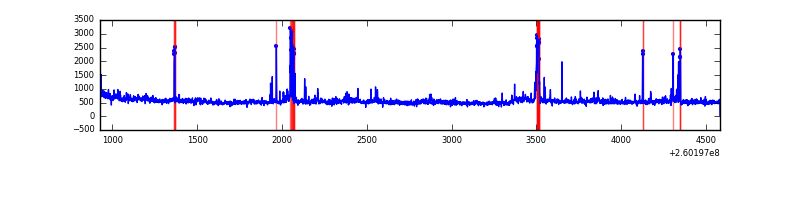 |
Top three noisy pixels from each quadrant. If the there are fewer than three noisy pixels in the level2.evt file, extra rows are filled as -1
| Pixel properties | Quadrant properties | ||||||
|---|---|---|---|---|---|---|---|
| Quadrant | DetID | PixID | Counts | Sigma | Mean | Median | Sigma |
| A | 14 | 238 | 170808 | 1670.7 | 482 | 474 | 102.0 |
| A | 15 | 69 | 13381 | 126.6 | 482 | 474 | 102.0 |
| A | 1 | 162 | 11826 | 111.34 | 482 | 474 | 102.0 |
| B | 0 | 182 | 1055766 | 12370.42 | 434 | 427 | 85.3 |
| B | 3 | 64 | 99500 | 1161.31 | 434 | 427 | 85.3 |
| B | 4 | 142 | 32605 | 377.18 | 434 | 427 | 85.3 |
| C | 3 | 233 | 134002 | 1225.47 | 463 | 467 | 109.0 |
| C | 13 | 61 | 3200 | 25.08 | 463 | 467 | 109.0 |
| C | 8 | 222 | 1131 | 6.09 | 463 | 467 | 109.0 |
| D | 8 | 195 | 108721 | 950.95 | 461 | 452 | 113.9 |
| D | 2 | 14 | 84645 | 739.48 | 461 | 452 | 113.9 |
| D | 5 | 222 | 71144 | 620.9 | 461 | 452 | 113.9 |
Histogram calculated using DETX and DETY for each event in the final _common_clean file
| Quadrant A | 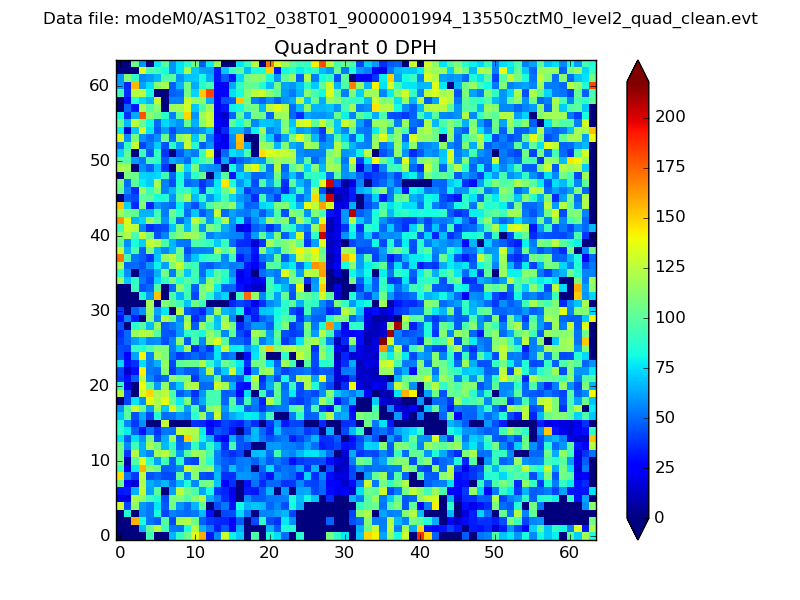 |
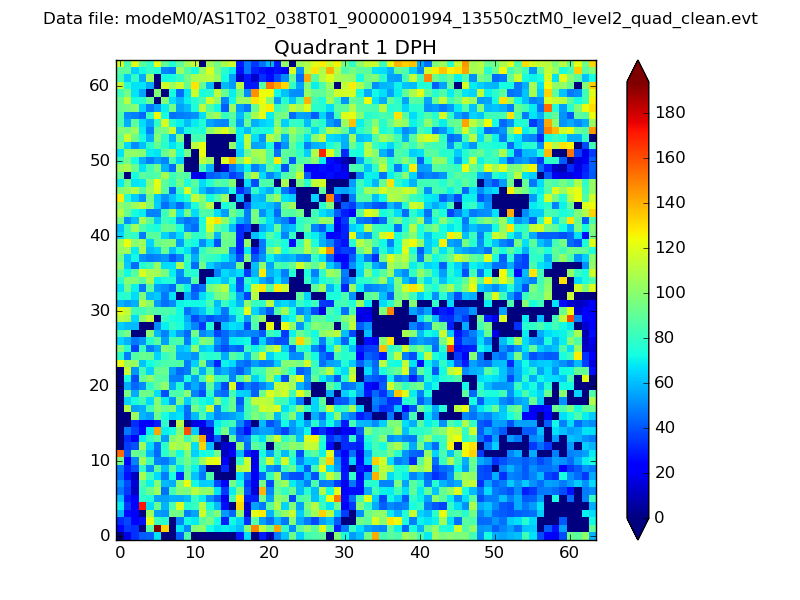 |
Quadrant B |
|---|---|---|---|
| Quadrant D | 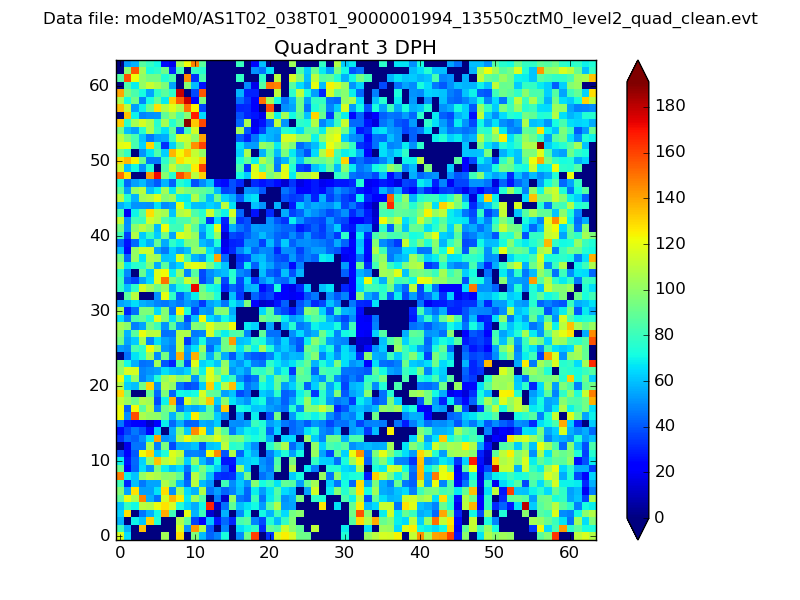 |
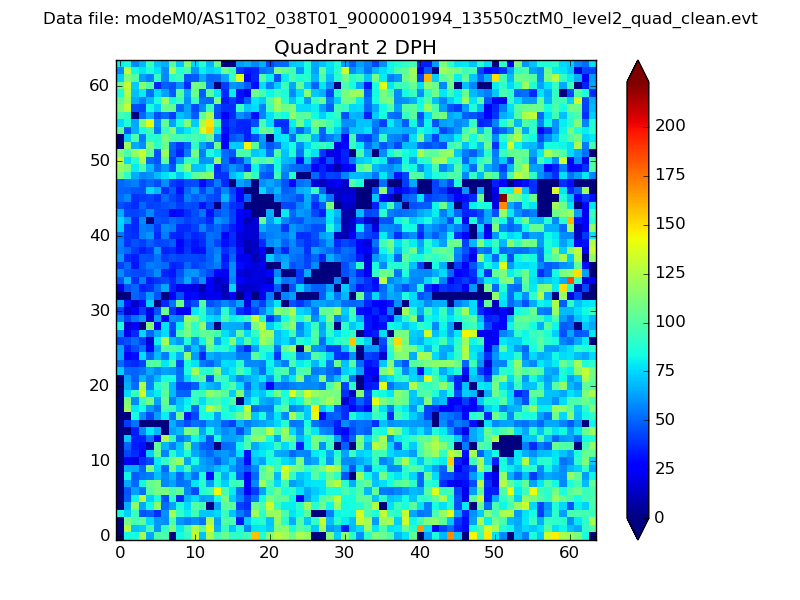 |
Quadrant C |
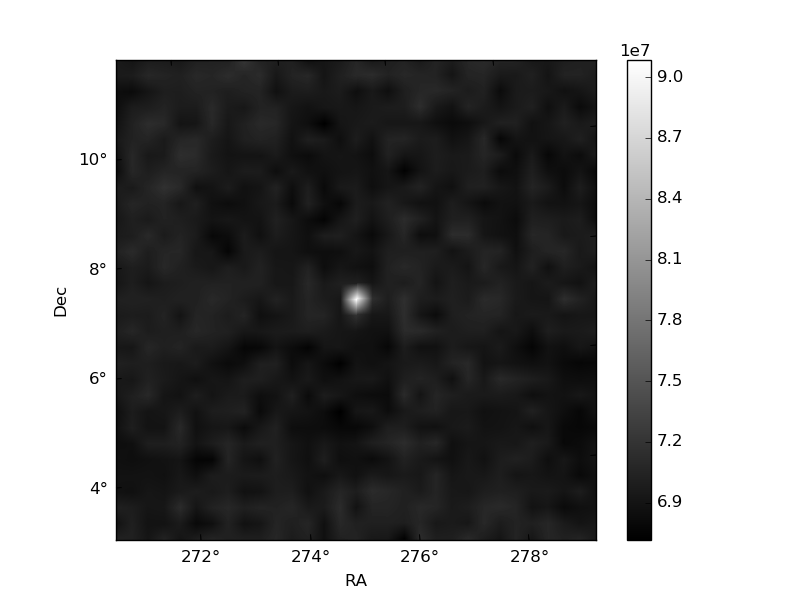
| Plot type | Count rate plots | Images |
|---|---|---|
| Comparison with Poisson distribution Blue bars denote a histogram of data divided into 1 sec bins. Red curve is a Poisson curve with rate = median count rate of data. |
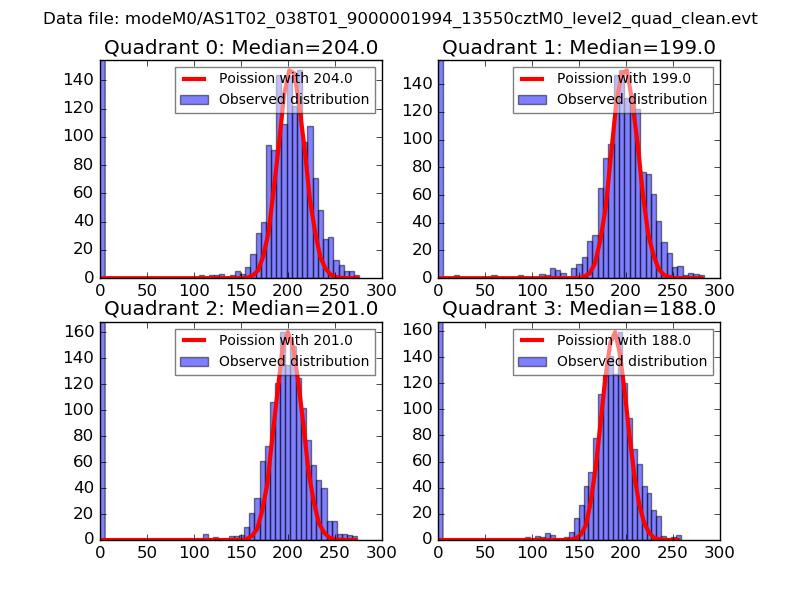 |
 |
| Quadrant-wise count rates Data is divided into 100 sec bins |
 |
|
| Module-wise count rates for Quadrant A Data is divided into 100 sec bins |
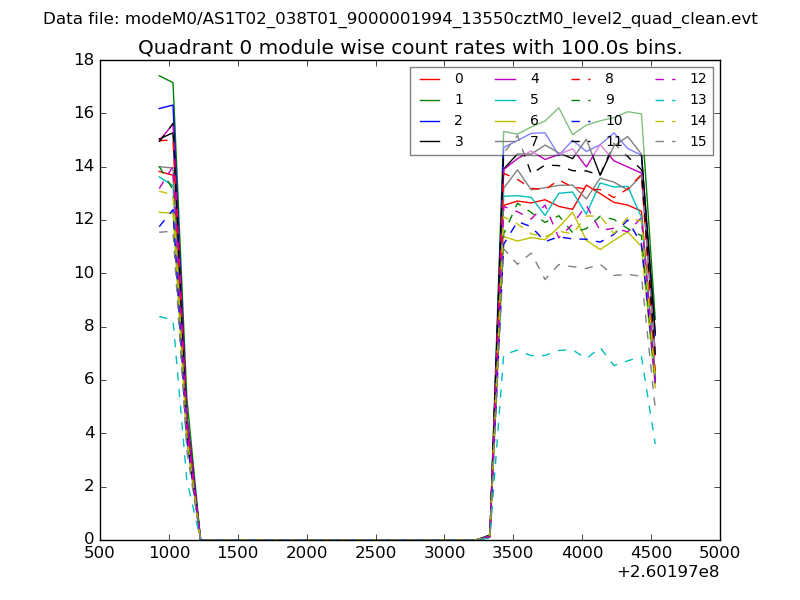 |
 |
| Module-wise count rates for Quadrant B Data is divided into 100 sec bins |
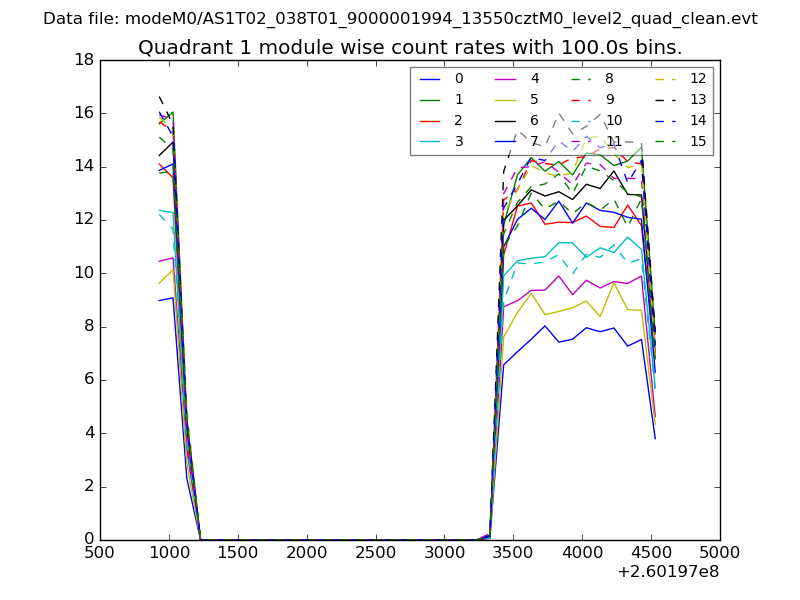 |
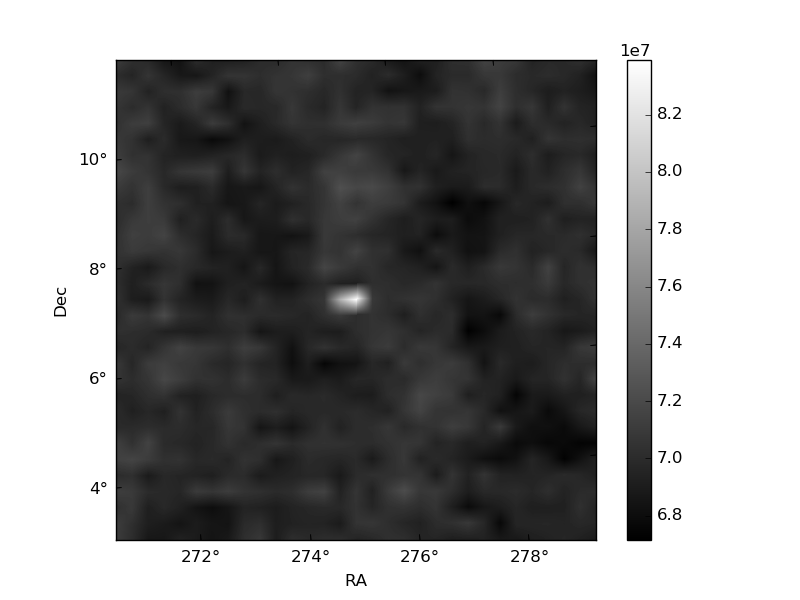 |
| Module-wise count rates for Quadrant C Data is divided into 100 sec bins |
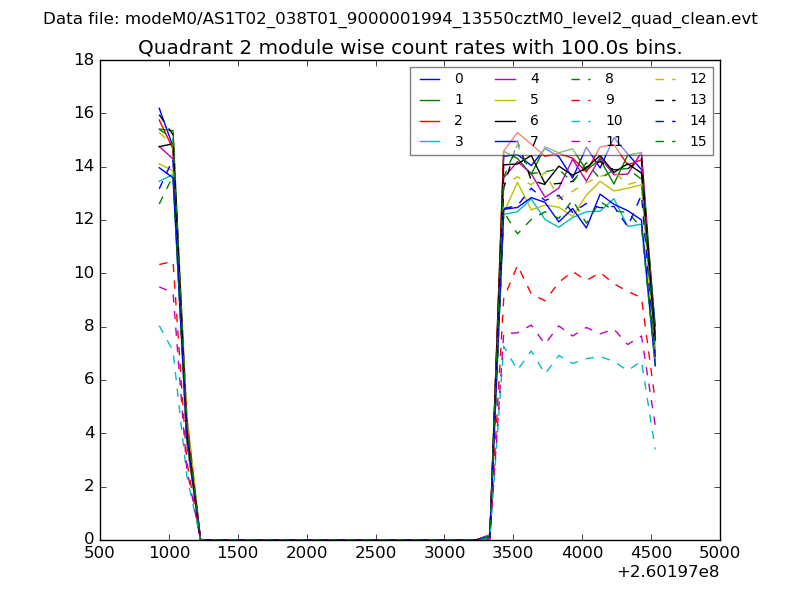 |
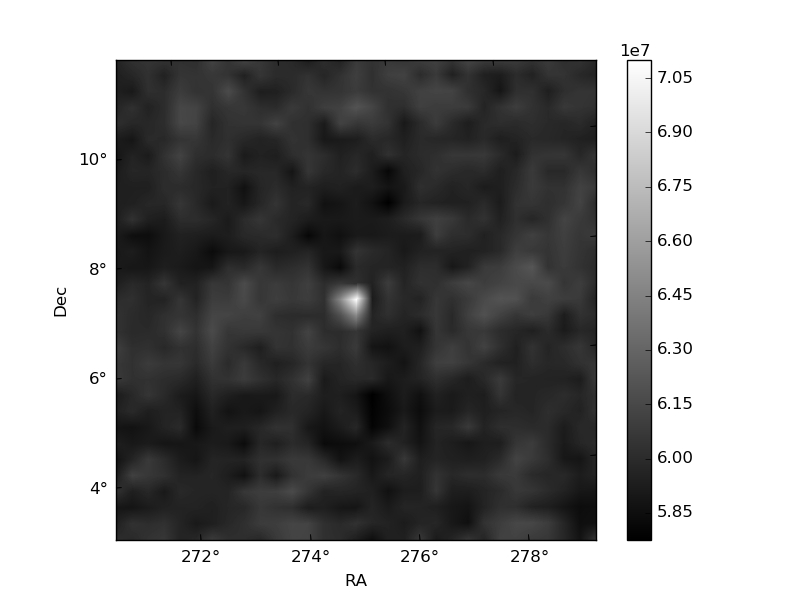 |
| Module-wise count rates for Quadrant D Data is divided into 100 sec bins |
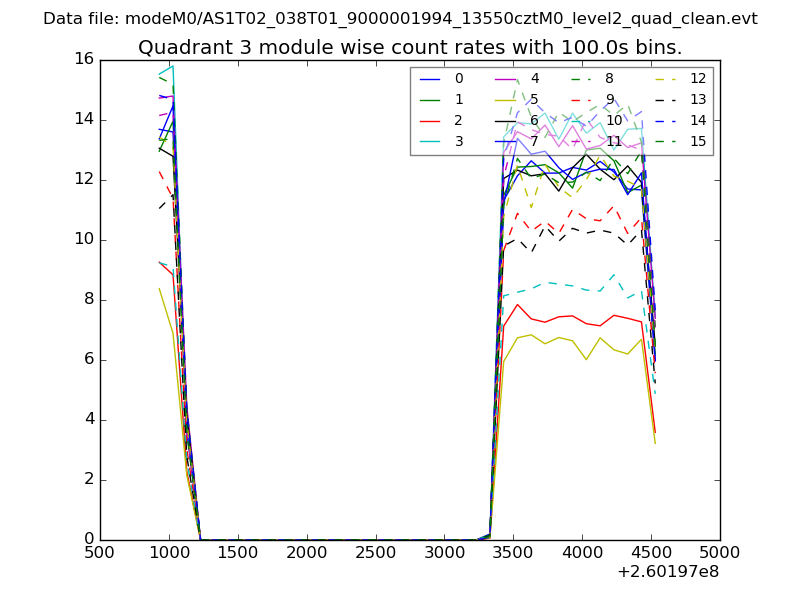 |
 |
| Parameter | Plot |
|---|---|
| CZT HV Monitor | 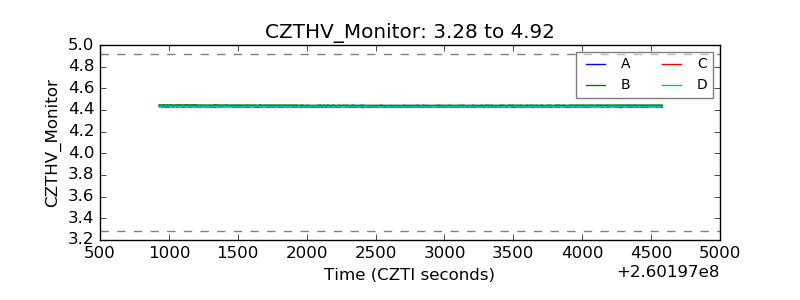 |
| D_VDD | 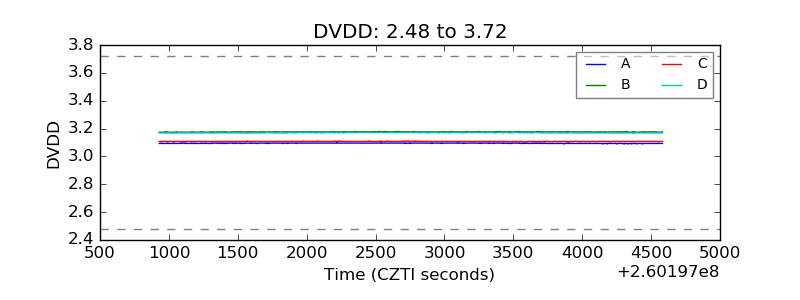 |
| Temperature 1 | 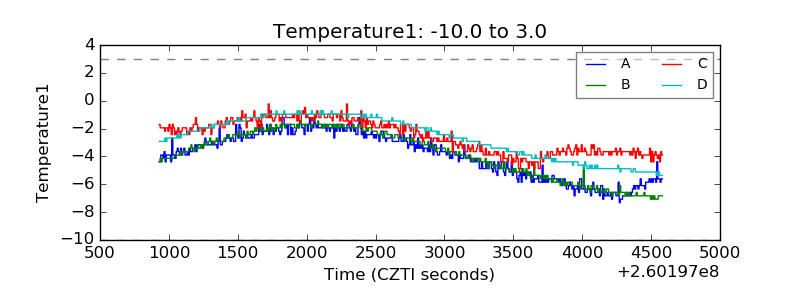 |
| Veto HV Monitor | 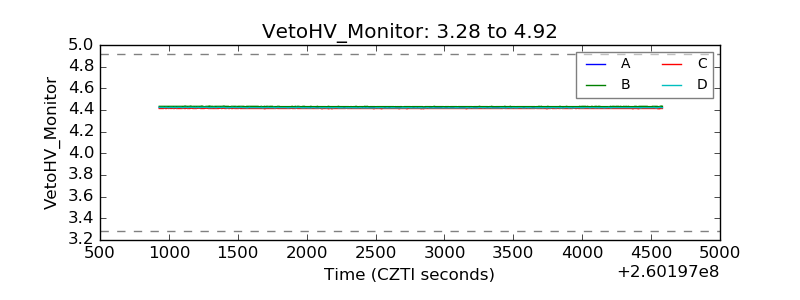 |
| Veto LLD | 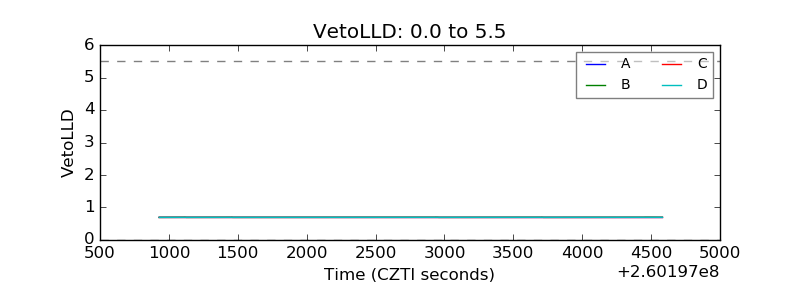 |
| Alpha Counter | 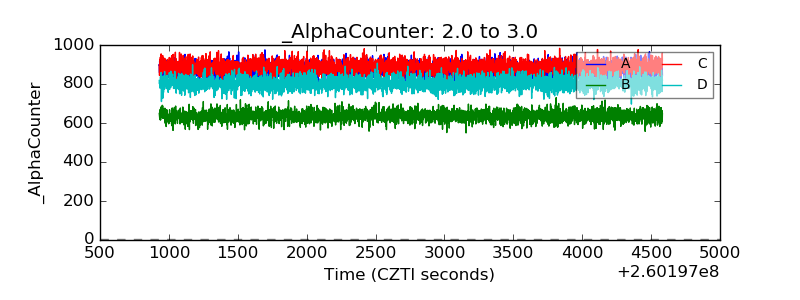 |
| _CPM_Rate | 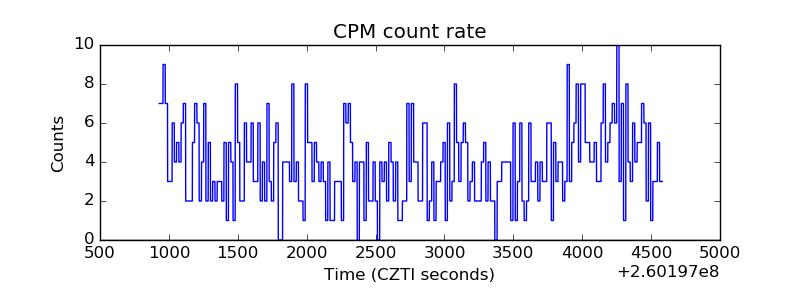 |
| CZT Counter | 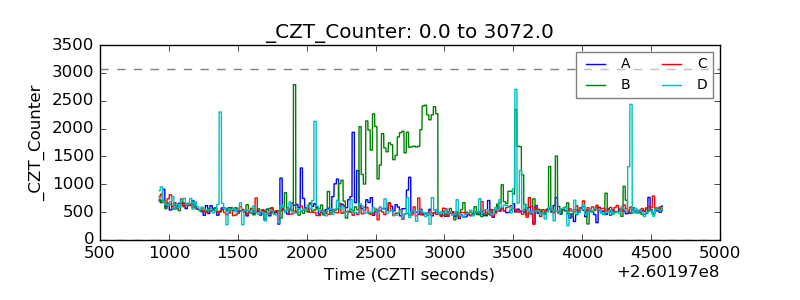 |
| +2.5 Volts monitor |  |
| +5 Volts monitor |  |
| _ROLL_ROT | 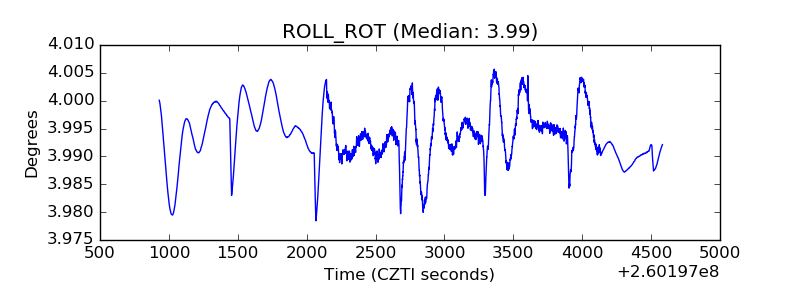 |
| _Roll_DEC | 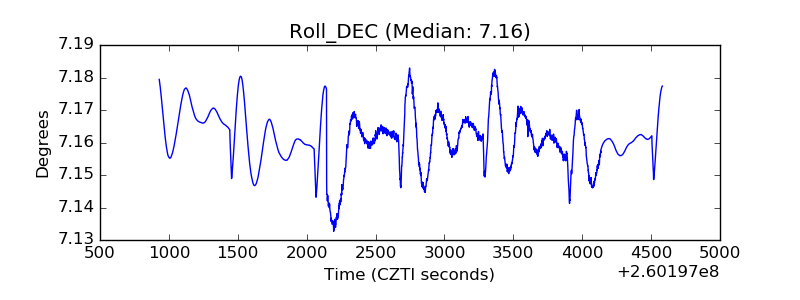 |
| _Roll_RA | 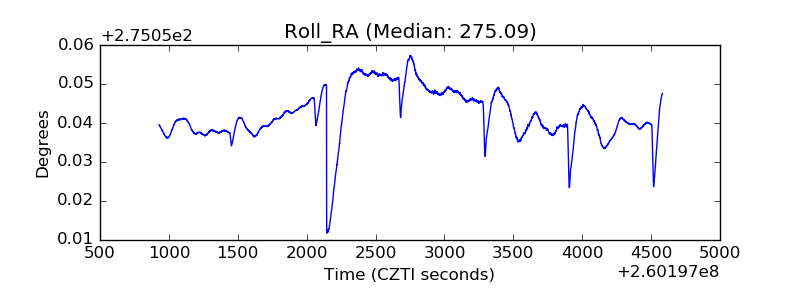 |
| Veto Counter | 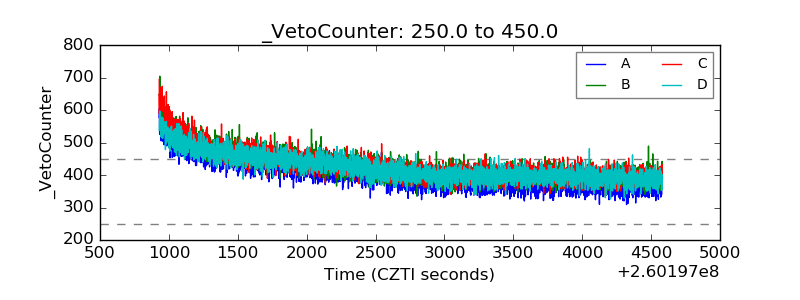 |