| Param | Original file | Final file |
|---|---|---|
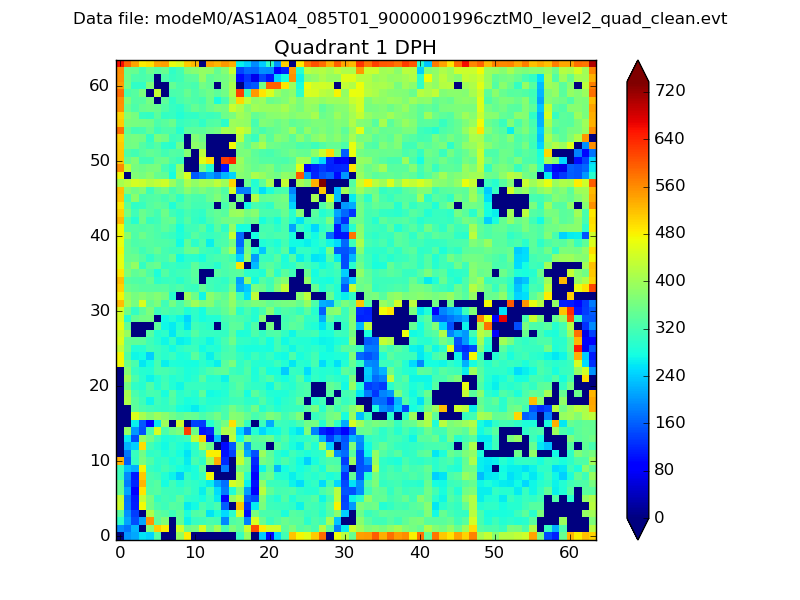
| Filename | modeM0/AS1A04_085T01_9000001996cztM0_level2.fits | modeM0/AS1A04_085T01_9000001996cztM0_level2_quad_clean.evt |
| Size (bytes) | 135,576,000 | 112,556,160 |
| Size | 129.3 MB | 107.3 MB |
| Events in quadrant A | 821,058 | 637,782 |
| Events in quadrant B | 779,362 | 607,729 |
| Events in quadrant C | 809,696 | 607,873 |
| Events in quadrant D | 695,376 | 554,172 |
| Mode SS | |||
|---|---|---|---|
| Quadrant | BADHDUFLAG | Total packets | Discarded packets |
| A | 0 | 298 | 0 |
| B | 0 | 298 | 0 |
| C | 0 | 298 | 0 |
| D | 0 | 298 | 0 |
| Mode M9 | |||
|---|---|---|---|
| Quadrant | BADHDUFLAG | Total packets | Discarded packets |
| A | 0 | 15 | 0 |
| B | 0 | 15 | 0 |
| C | 0 | 15 | 0 |
| D | 0 | 15 | 0 |
| Mode M0 | |||
|---|---|---|---|
| Quadrant | BADHDUFLAG | Total packets | Discarded packets |
| A | 0 | 30219 | 0 |
| B | 0 | 33339 | 0 |
| C | 0 | 30226 | 0 |
| D | 0 | 37715 | 0 |
| Quadrant | Total seconds | Saturated seconds | Saturation percentage |
|---|---|---|---|
| A | 14483 | 215 | 1.484499% |
| B | 14483 | 642 | 4.432783% |
| C | 14483 | 170 | 1.173790% |
| D | 14483 | 515 | 3.555893% |
Noise dominated data is calculated using 1-second bins in cleaned event files. If a bin has >2000 counts, and if more than 50% of those come from <1% of pixels, then it is considered to be noise-dominated and hence unusable.
| Quadrant | # 1 sec bins | Bins with >0 counts | Bins with >2000 counts | High rate bins dominated by noise | Noise dominated (total time) | Noise dominated (detector-on time) | Marked lightcurve |
|---|---|---|---|---|---|---|---|
| A | 16028 | 14481 | 0 | 0 | 0.00% | 0.00% |  |
| B | 16028 | 14480 | 0 | 0 | 0.00% | 0.00% |  |
| C | 16028 | 14481 | 0 | 0 | 0.00% | 0.00% |  |
| D | 16028 | 14480 | 0 | 0 | 0.00% | 0.00% |  |
Top three noisy pixels from each quadrant. If the there are fewer than three noisy pixels in the level2.evt file, extra rows are filled as -1
| Pixel properties | Quadrant properties | ||||||
|---|---|---|---|---|---|---|---|
| Quadrant | DetID | PixID | Counts | Sigma | Mean | Median | Sigma |
| A | 0 | 29 | 770 | 10.18 | 214 | 200 | 56.0 |
| A | 7 | 110 | 688 | 8.72 | 214 | 200 | 56.0 |
| A | 9 | 19 | 636 | 7.79 | 214 | 200 | 56.0 |
| B | 2 | 9 | 720 | 12.08 | 205 | 196 | 43.4 |
| B | 2 | 8 | 547 | 8.09 | 205 | 196 | 43.4 |
| B | 14 | 254 | 536 | 7.84 | 205 | 196 | 43.4 |
| C | 1 | 81 | 611 | 7.34 | 213 | 198 | 56.3 |
| C | 1 | 80 | 608 | 7.29 | 213 | 198 | 56.3 |
| C | 12 | 241 | 567 | 6.56 | 213 | 198 | 56.3 |
| D | 4 | 246 | 567 | 6.98 | 198 | 179 | 55.5 |
| D | 6 | 231 | 534 | 6.38 | 198 | 179 | 55.5 |
| D | 3 | 14 | 533 | 6.36 | 198 | 179 | 55.5 |
Histogram calculated using DETX and DETY for each event in the final _common_clean file
| Quadrant A |  |
 |
Quadrant B |
|---|---|---|---|
| Quadrant D |  |
 |
Quadrant C |
| Plot type | Count rate plots | Images |
|---|---|---|
| Comparison with Poisson distribution Blue bars denote a histogram of data divided into 1 sec bins. Red curve is a Poisson curve with rate = median count rate of data. |
 |
 |
| Quadrant-wise count rates Data is divided into 100 sec bins |
 |
|
| Module-wise count rates for Quadrant A Data is divided into 100 sec bins |
 |
 |
| Module-wise count rates for Quadrant B Data is divided into 100 sec bins |
 |
 |
| Module-wise count rates for Quadrant C Data is divided into 100 sec bins |
 |
 |
| Module-wise count rates for Quadrant D Data is divided into 100 sec bins |
 |
 |
| Parameter | Plot |
|---|---|
| CZT HV Monitor |  |
| D_VDD |  |
| Temperature 1 |  |
| Veto HV Monitor |  |
| Veto LLD |  |
| Alpha Counter |  |
| _CPM_Rate |  |
| CZT Counter |  |
| +2.5 Volts monitor |  |
| +5 Volts monitor |  |
| _ROLL_ROT |  |
| _Roll_DEC |  |
| _Roll_RA |  |
| Veto Counter |  |