| Param | Original file | Final file |
|---|---|---|
| Filename | modeM0/AS1A04_085T01_9000001996_13550cztM0_level2.evt | modeM0/AS1A04_085T01_9000001996_13550cztM0_level2_quad_clean.evt |
| Size (bytes) | 148,976,640 | 29,854,080 |
| Size | 142.1 MB | 28.5 MB |
| Events in quadrant A | 1,035,655 | 194,608 |
| Events in quadrant B | 1,059,422 | 196,524 |
| Events in quadrant C | 1,054,276 | 188,627 |
| Events in quadrant D | 1,224,534 | 179,081 |
| Mode SS | |||
|---|---|---|---|
| Quadrant | BADHDUFLAG | Total packets | Discarded packets |
| A | 0 | 44 | 0 |
| B | 0 | 44 | 0 |
| C | 0 | 44 | 0 |
| D | 0 | 44 | 0 |
| Mode M9 | |||
|---|---|---|---|
| Quadrant | BADHDUFLAG | Total packets | Discarded packets |
| A | 0 | 8 | 0 |
| B | 0 | 8 | 0 |
| C | 0 | 8 | 0 |
| D | 0 | 8 | 0 |
| Mode M0 | |||
|---|---|---|---|
| Quadrant | BADHDUFLAG | Total packets | Discarded packets |
| A | 0 | 4247 | 2 |
| B | 0 | 4326 | 1 |
| C | 0 | 4289 | 1 |
| D | 0 | 4909 | 1 |
| Quadrant | Total seconds | Saturated seconds | Saturation percentage |
|---|---|---|---|
| A | 1984 | 78 | 3.931452% |
| B | 1984 | 73 | 3.679435% |
| C | 1984 | 59 | 2.973790% |
| D | 1984 | 70 | 3.528226% |
Noise dominated data is calculated using 1-second bins in cleaned event files. If a bin has >2000 counts, and if more than 50% of those come from <1% of pixels, then it is considered to be noise-dominated and hence unusable.
| Quadrant | # 1 sec bins | Bins with >0 counts | Bins with >2000 counts | High rate bins dominated by noise | Noise dominated (total time) | Noise dominated (detector-on time) | Marked lightcurve |
|---|---|---|---|---|---|---|---|
| A | 2850 | 1985 | 0 | 0 | 0.00% | 0.00% | 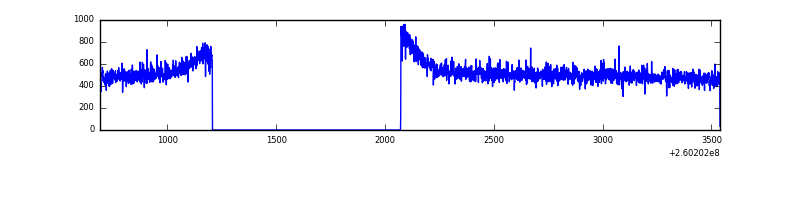 |
| B | 2850 | 1985 | 1 | 1 | 0.04% | 0.05% | 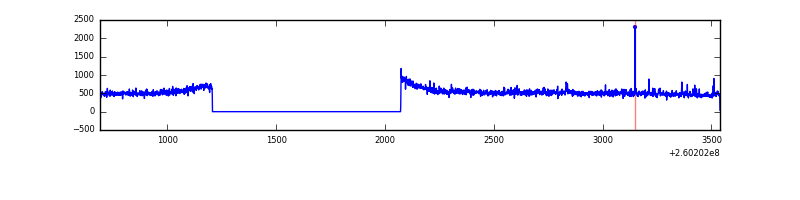 |
| C | 2850 | 1985 | 0 | 0 | 0.00% | 0.00% |  |
| D | 2850 | 1985 | 11 | 11 | 0.39% | 0.55% | 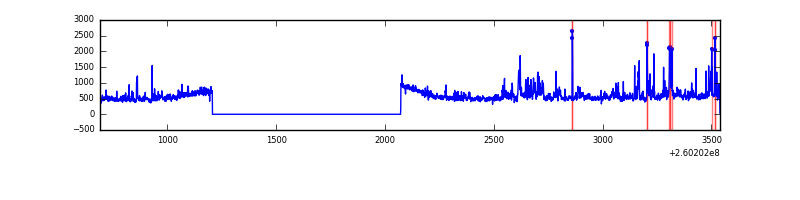 |
Top three noisy pixels from each quadrant. If the there are fewer than three noisy pixels in the level2.evt file, extra rows are filled as -1
| Pixel properties | Quadrant properties | ||||||
|---|---|---|---|---|---|---|---|
| Quadrant | DetID | PixID | Counts | Sigma | Mean | Median | Sigma |
| A | 1 | 162 | 6452 | 110.43 | 266 | 259 | 56.1 |
| A | 1 | 178 | 2466 | 39.35 | 266 | 259 | 56.1 |
| A | 0 | 226 | 2424 | 38.6 | 266 | 259 | 56.1 |
| B | 0 | 214 | 9873 | 187.34 | 262 | 255 | 51.3 |
| B | 3 | 209 | 8016 | 151.17 | 262 | 255 | 51.3 |
| B | 3 | 64 | 7750 | 145.99 | 262 | 255 | 51.3 |
| C | 3 | 233 | 59260 | 978.07 | 255 | 254 | 60.3 |
| C | 13 | 61 | 1854 | 26.52 | 255 | 254 | 60.3 |
| C | 8 | 222 | 817 | 9.33 | 255 | 254 | 60.3 |
| D | 13 | 122 | 126629 | 2011.94 | 256 | 248 | 62.8 |
| D | 2 | 14 | 67107 | 1064.37 | 256 | 248 | 62.8 |
| D | 8 | 195 | 29468 | 465.17 | 256 | 248 | 62.8 |
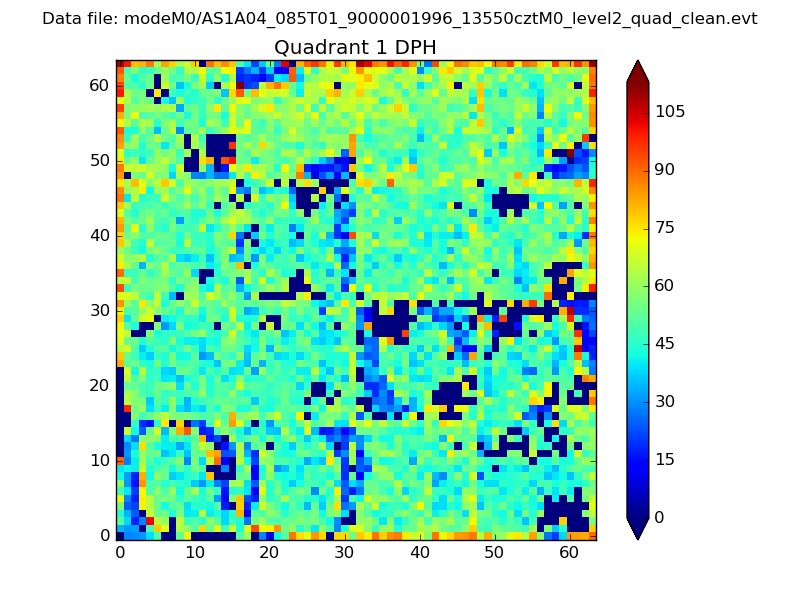
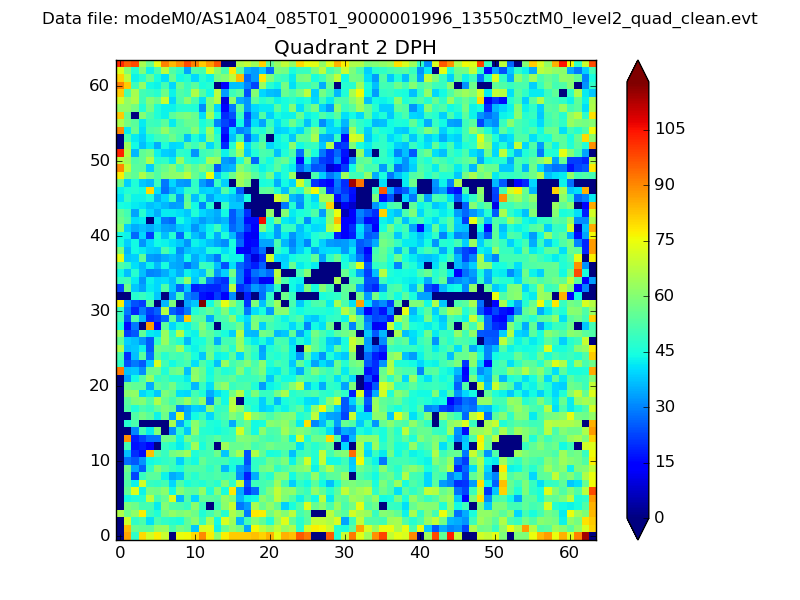
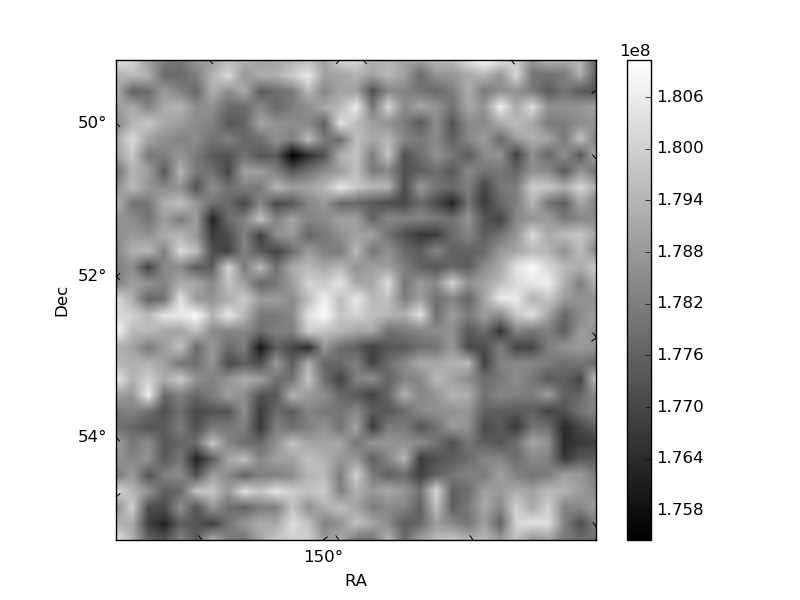
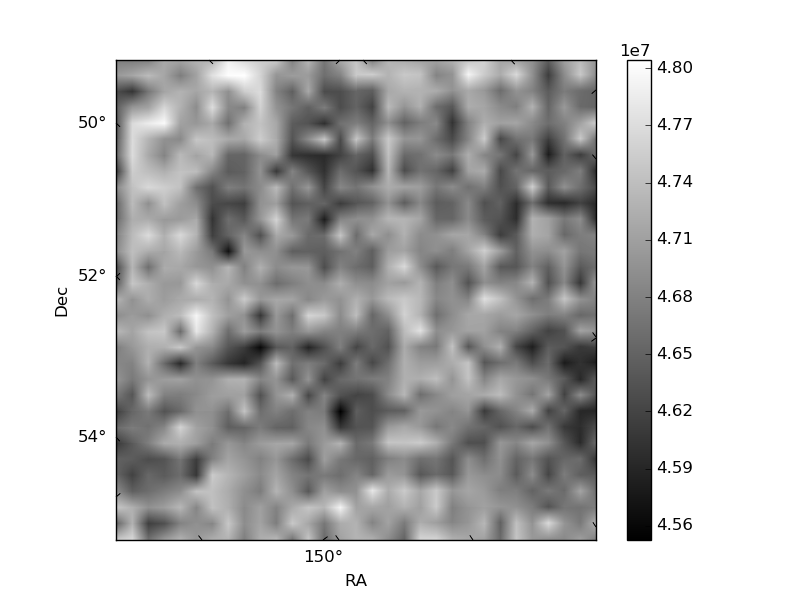
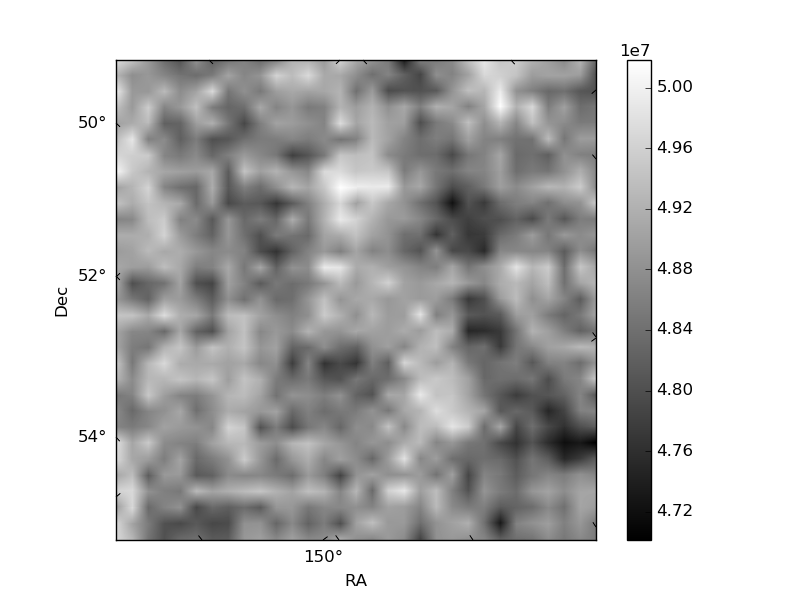
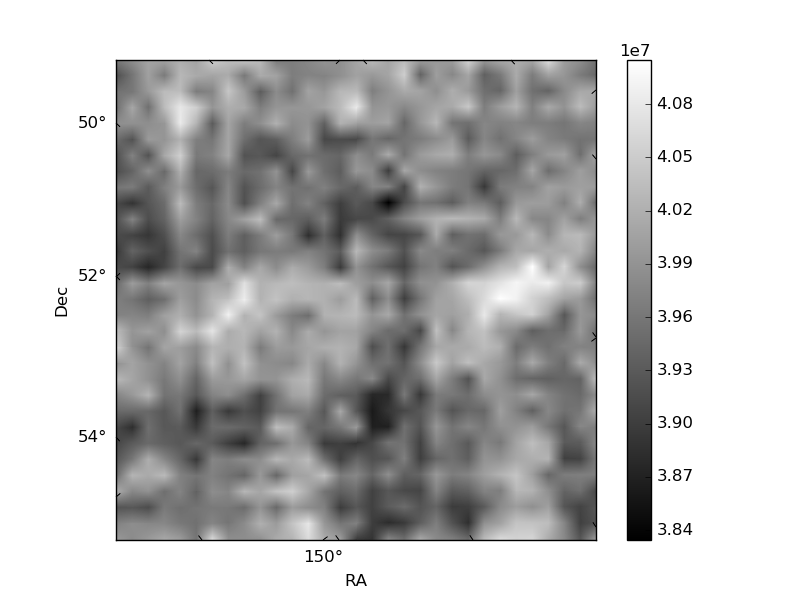
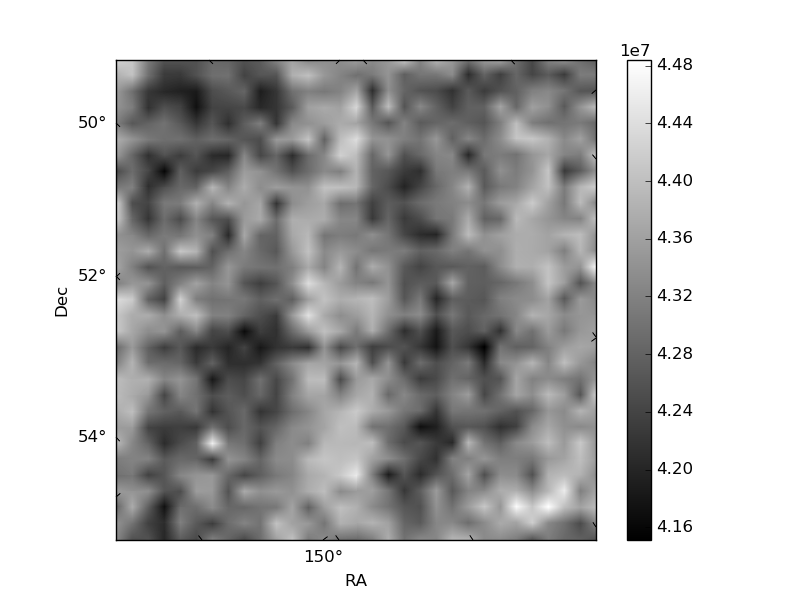
Histogram calculated using DETX and DETY for each event in the final _common_clean file
| Quadrant A | 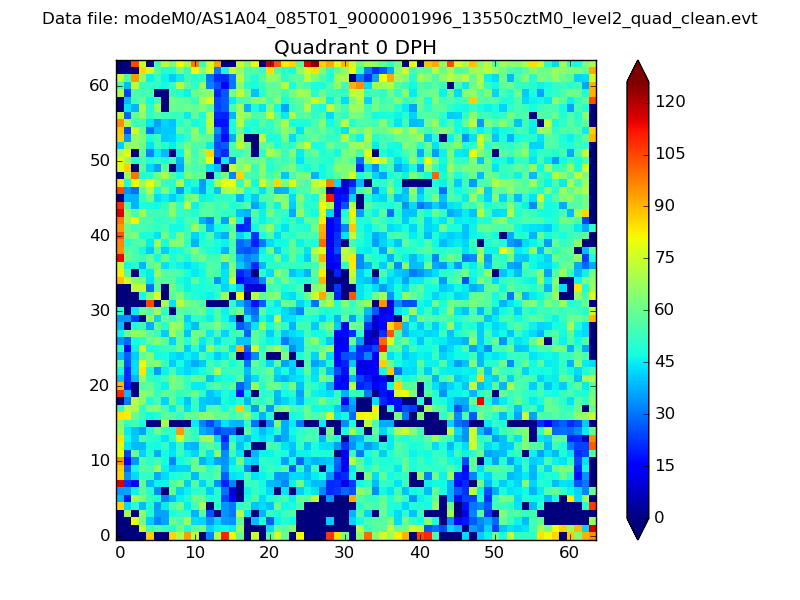 |
 |
Quadrant B |
|---|---|---|---|
| Quadrant D | 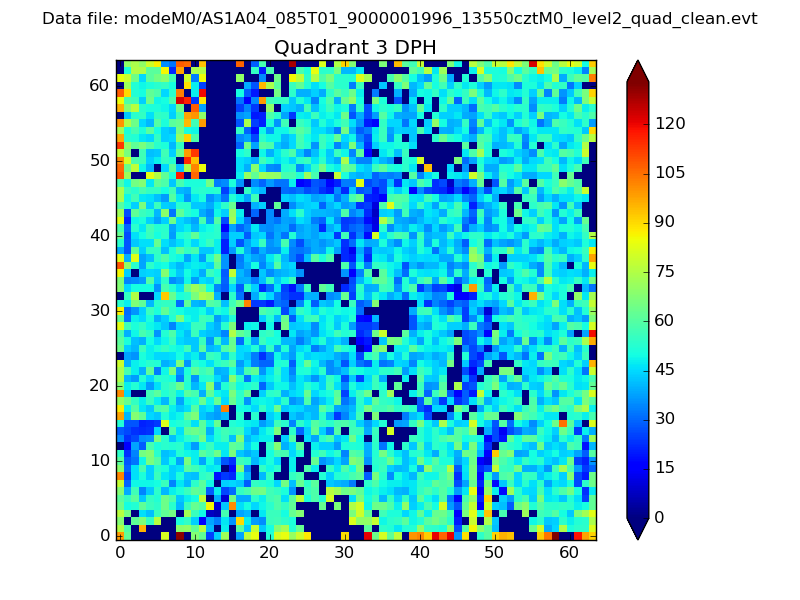 |
 |
Quadrant C |
| Plot type | Count rate plots | Images |
|---|---|---|
| Comparison with Poisson distribution Blue bars denote a histogram of data divided into 1 sec bins. Red curve is a Poisson curve with rate = median count rate of data. |
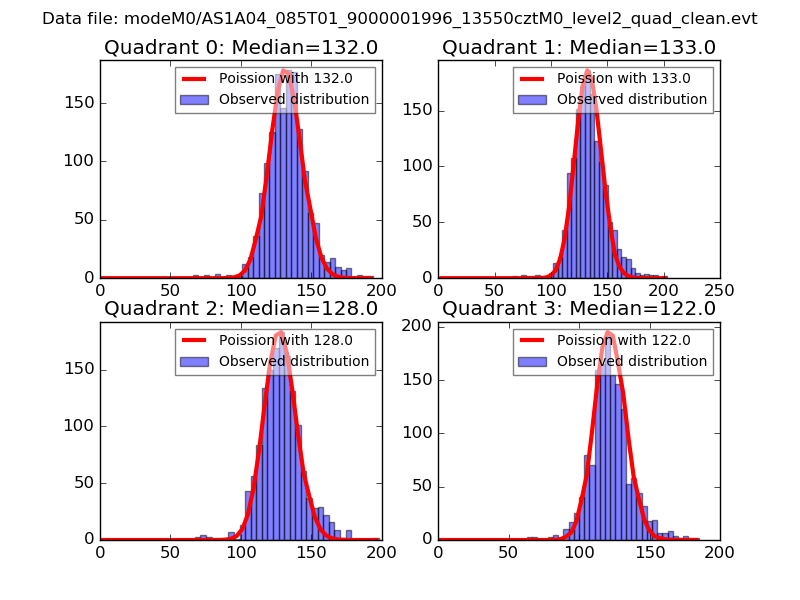 |
 |
| Quadrant-wise count rates Data is divided into 100 sec bins |
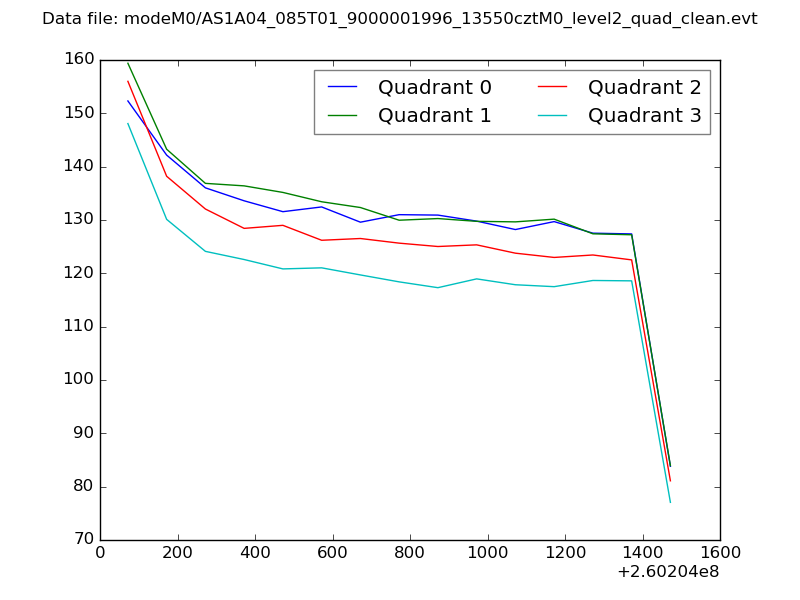 |
|
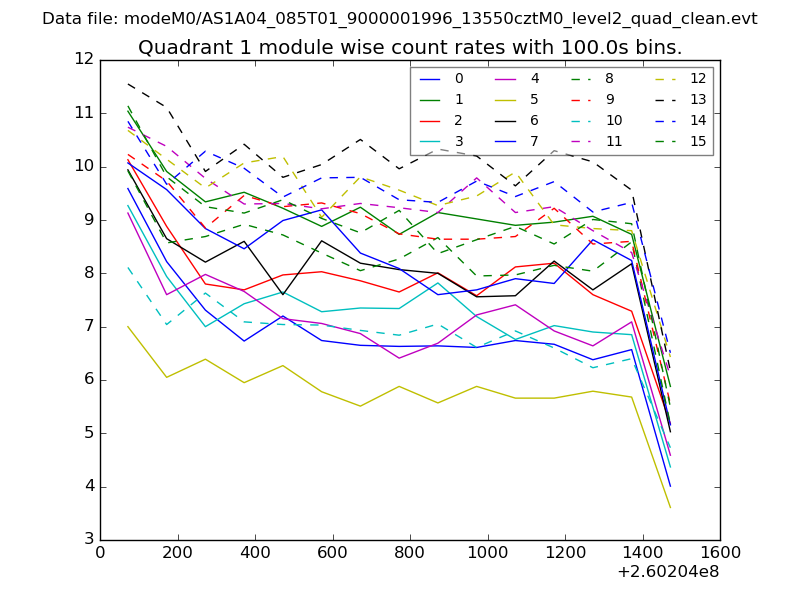
| Module-wise count rates for Quadrant A Data is divided into 100 sec bins |
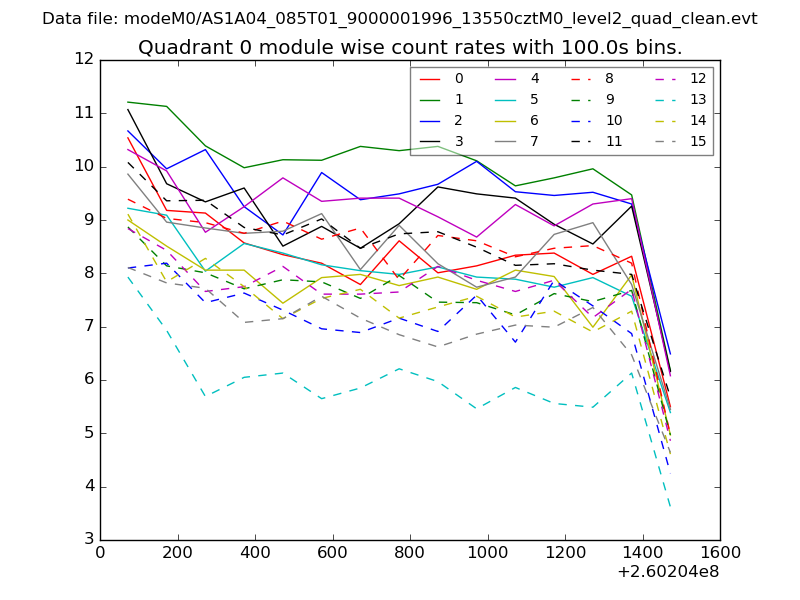 |
 |
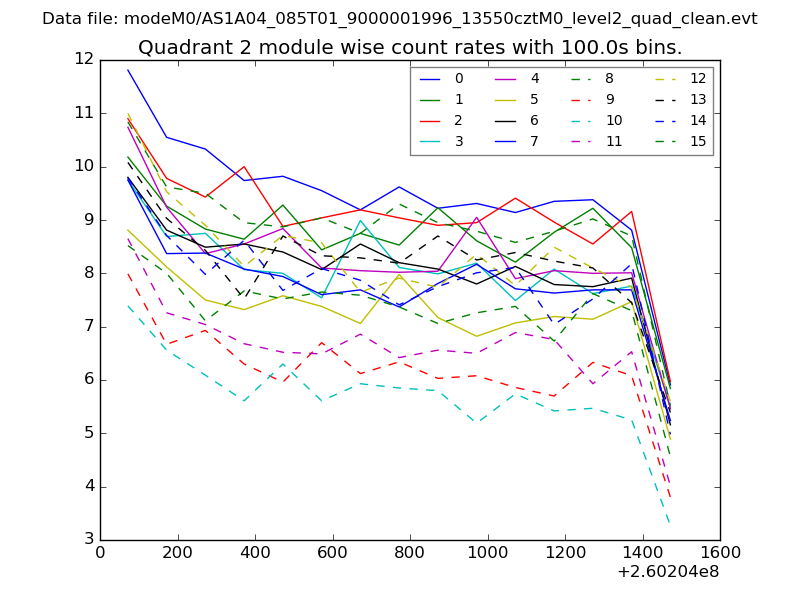
| Module-wise count rates for Quadrant B Data is divided into 100 sec bins |
 |
 |
| Module-wise count rates for Quadrant C Data is divided into 100 sec bins |
 |
 |
| Module-wise count rates for Quadrant D Data is divided into 100 sec bins |
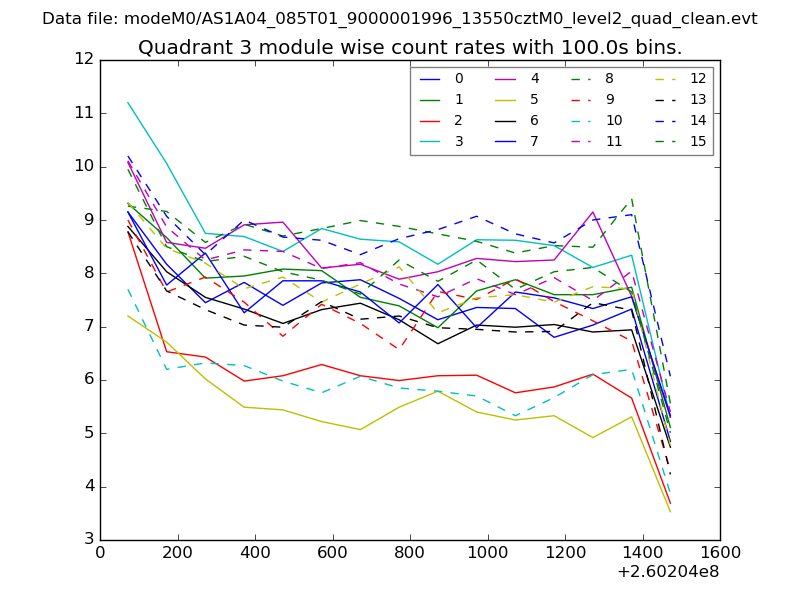 |
 |
| Parameter | Plot |
|---|---|
| CZT HV Monitor | 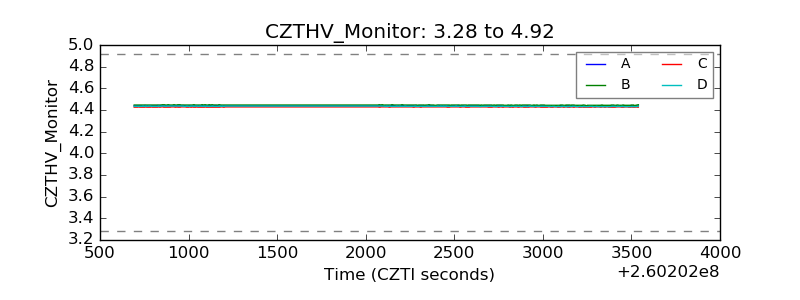 |
| D_VDD | 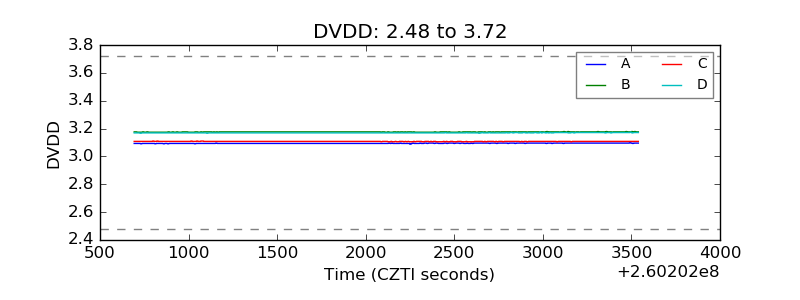 |
| Temperature 1 | 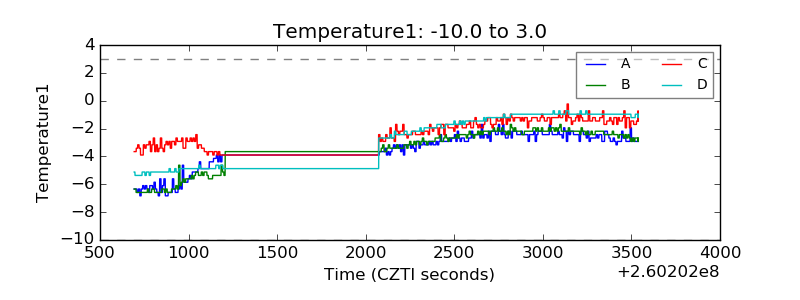 |
| Veto HV Monitor | 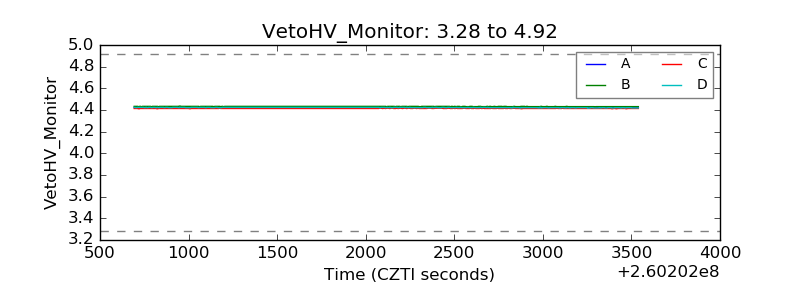 |
| Veto LLD | 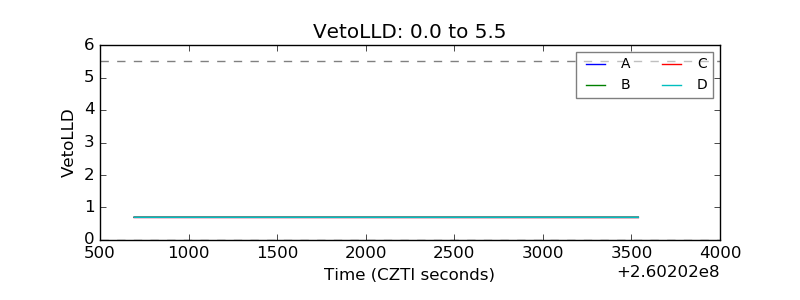 |
| Alpha Counter | 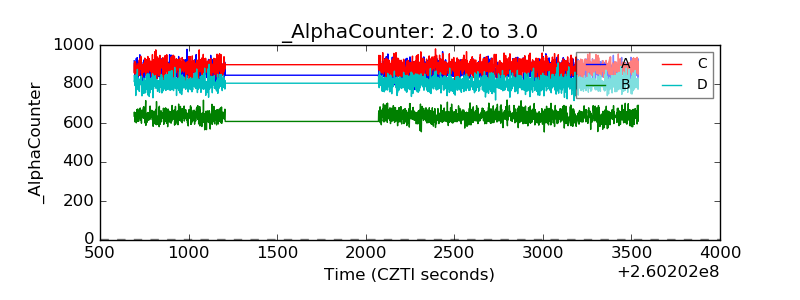 |
| _CPM_Rate | 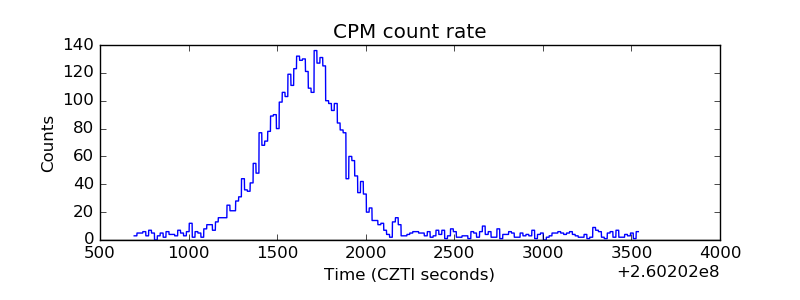 |
| CZT Counter | 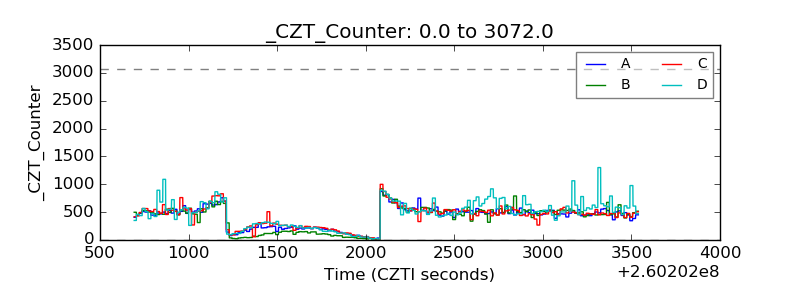 |
| +2.5 Volts monitor |  |
| +5 Volts monitor |  |
| _ROLL_ROT | 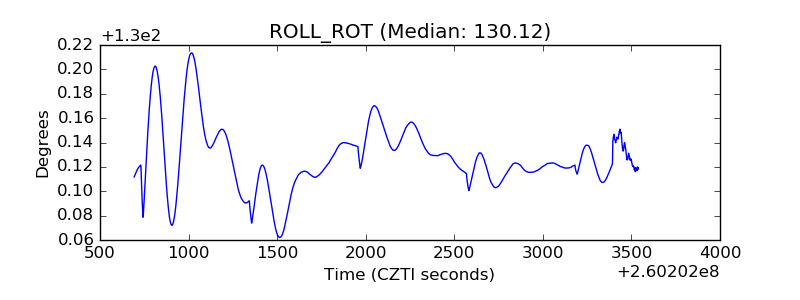 |
| _Roll_DEC | 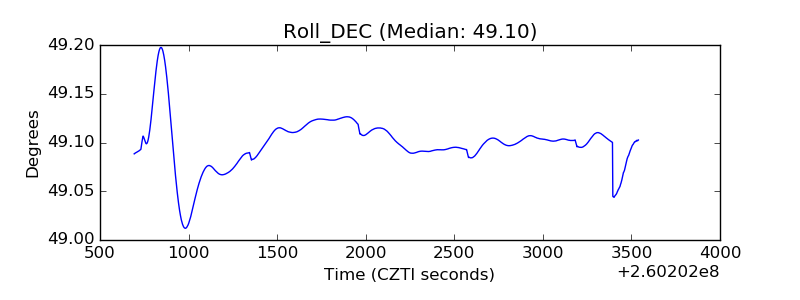 |
| _Roll_RA | 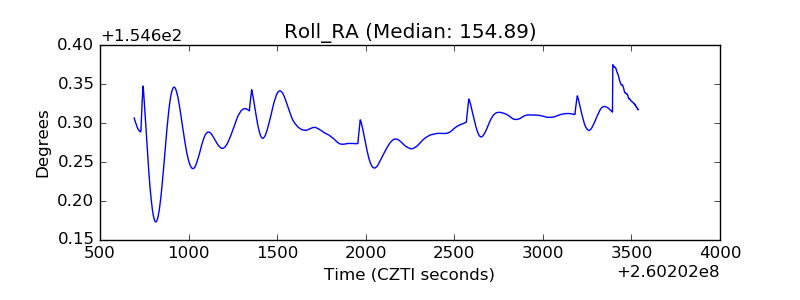 |
| Veto Counter | 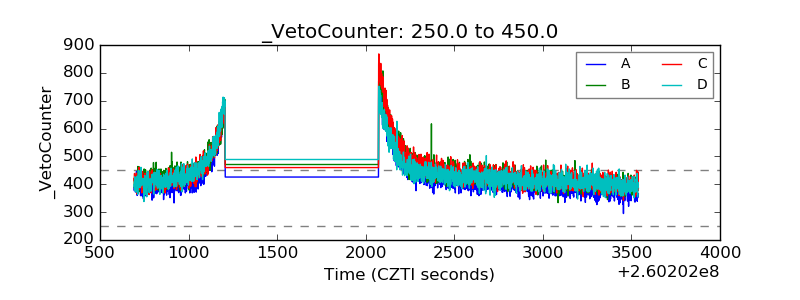 |