| Param | Original file | Final file |
|---|---|---|
| Filename | modeM0/AS1A04_085T01_9000001996_13551cztM0_level2.evt | modeM0/AS1A04_085T01_9000001996_13551cztM0_level2_quad_clean.evt |
| Size (bytes) | 523,241,280 | 99,898,560 |
| Size | 499.0 MB | 95.3 MB |
| Events in quadrant A | 3,325,633 | 652,065 |
| Events in quadrant B | 4,263,334 | 628,182 |
| Events in quadrant C | 3,356,666 | 642,493 |
| Events in quadrant D | 4,421,494 | 610,765 |
| Mode SS | |||
|---|---|---|---|
| Quadrant | BADHDUFLAG | Total packets | Discarded packets |
| A | 0 | 142 | 0 |
| B | 0 | 142 | 0 |
| C | 0 | 142 | 0 |
| D | 0 | 142 | 0 |
| Mode M9 | |||
|---|---|---|---|
| Quadrant | BADHDUFLAG | Total packets | Discarded packets |
| A | 0 | 5 | 0 |
| B | 0 | 5 | 0 |
| C | 0 | 5 | 0 |
| D | 0 | 5 | 0 |
| Mode M0 | |||
|---|---|---|---|
| Quadrant | BADHDUFLAG | Total packets | Discarded packets |
| A | 0 | 14618 | 2 |
| B | 0 | 17313 | 1 |
| C | 0 | 14542 | 1 |
| D | 0 | 17706 | 1 |
| Quadrant | Total seconds | Saturated seconds | Saturation percentage |
|---|---|---|---|
| A | 7064 | 60 | 0.849377% |
| B | 7064 | 460 | 6.511891% |
| C | 7064 | 48 | 0.679502% |
| D | 7064 | 206 | 2.916195% |
Noise dominated data is calculated using 1-second bins in cleaned event files. If a bin has >2000 counts, and if more than 50% of those come from <1% of pixels, then it is considered to be noise-dominated and hence unusable.
| Quadrant | # 1 sec bins | Bins with >0 counts | Bins with >2000 counts | High rate bins dominated by noise | Noise dominated (total time) | Noise dominated (detector-on time) | Marked lightcurve |
|---|---|---|---|---|---|---|---|
| A | 7550 | 7065 | 0 | 0 | 0.00% | 0.00% | 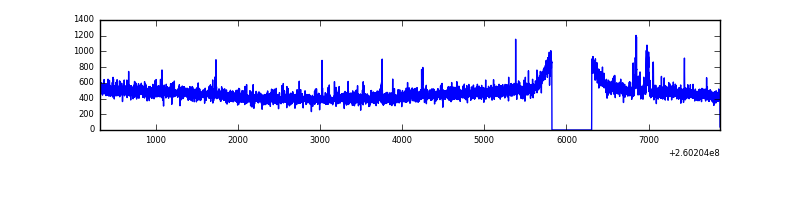 |
| B | 7550 | 7065 | 356 | 356 | 4.72% | 5.04% | 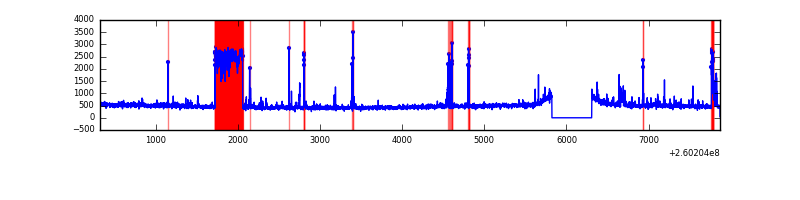 |
| C | 7550 | 7066 | 0 | 0 | 0.00% | 0.00% | 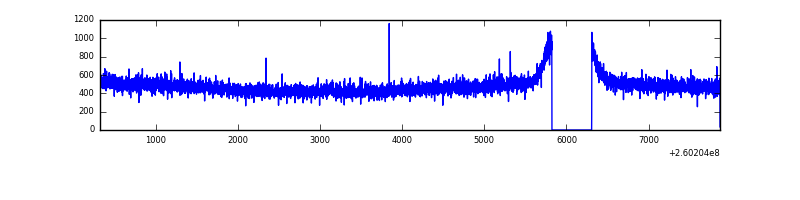 |
| D | 7550 | 7066 | 181 | 181 | 2.40% | 2.56% | 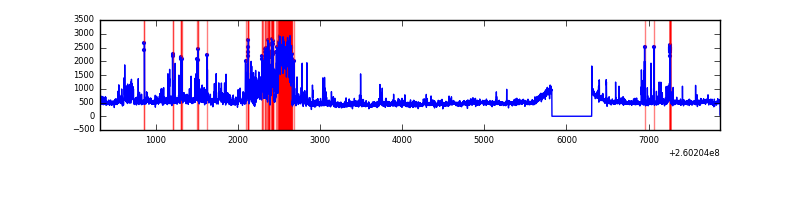 |
Top three noisy pixels from each quadrant. If the there are fewer than three noisy pixels in the level2.evt file, extra rows are filled as -1
| Pixel properties | Quadrant properties | ||||||
|---|---|---|---|---|---|---|---|
| Quadrant | DetID | PixID | Counts | Sigma | Mean | Median | Sigma |
| A | 14 | 238 | 43123 | 245.98 | 846 | 826 | 172.0 |
| A | 1 | 162 | 17106 | 94.68 | 846 | 826 | 172.0 |
| A | 0 | 226 | 7681 | 39.87 | 846 | 826 | 172.0 |
| B | 0 | 182 | 780242 | 5006.78 | 820 | 800 | 155.7 |
| B | 3 | 64 | 118011 | 752.91 | 820 | 800 | 155.7 |
| B | 4 | 80 | 56310 | 356.57 | 820 | 800 | 155.7 |
| C | 3 | 233 | 142048 | 742.41 | 824 | 827 | 190.2 |
| C | 13 | 61 | 5795 | 26.12 | 824 | 827 | 190.2 |
| C | 14 | 234 | 2907 | 10.93 | 824 | 827 | 190.2 |
| D | 13 | 122 | 619496 | 3136.04 | 821 | 799 | 197.3 |
| D | 5 | 222 | 266678 | 1347.68 | 821 | 799 | 197.3 |
| D | 8 | 195 | 244471 | 1235.12 | 821 | 799 | 197.3 |
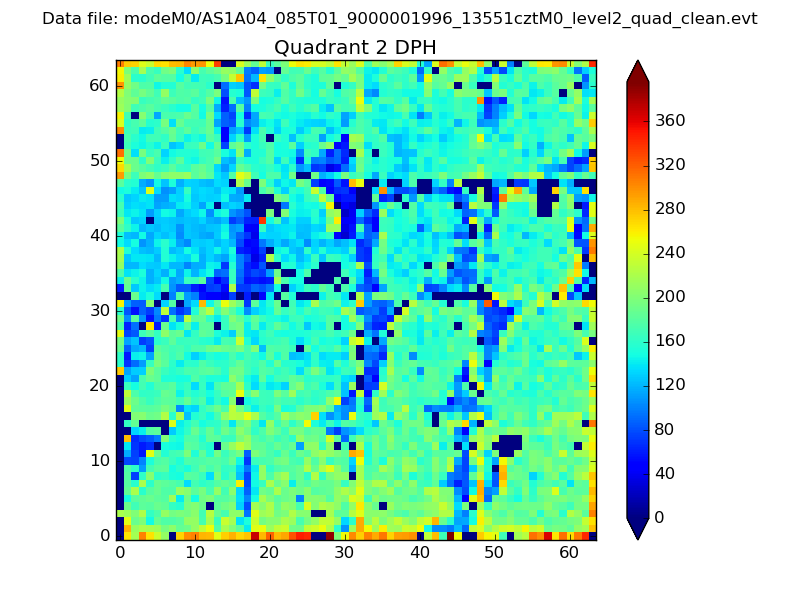
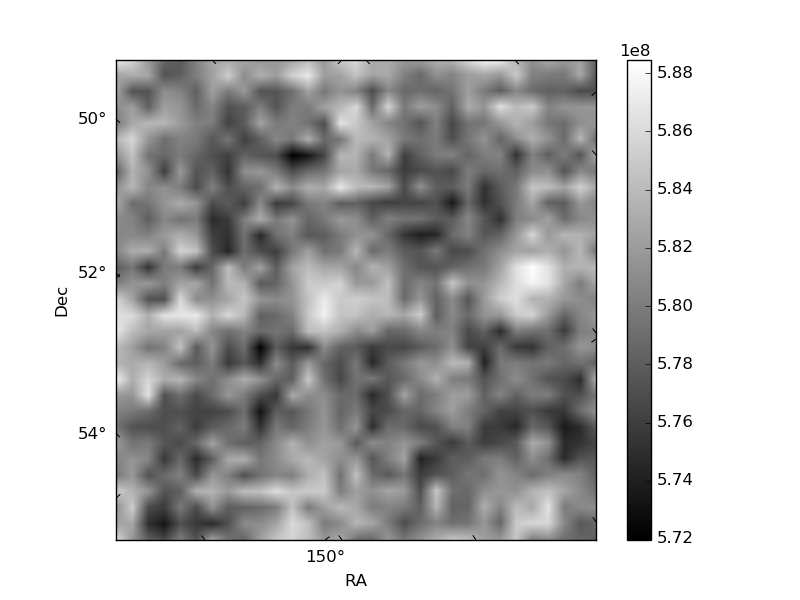
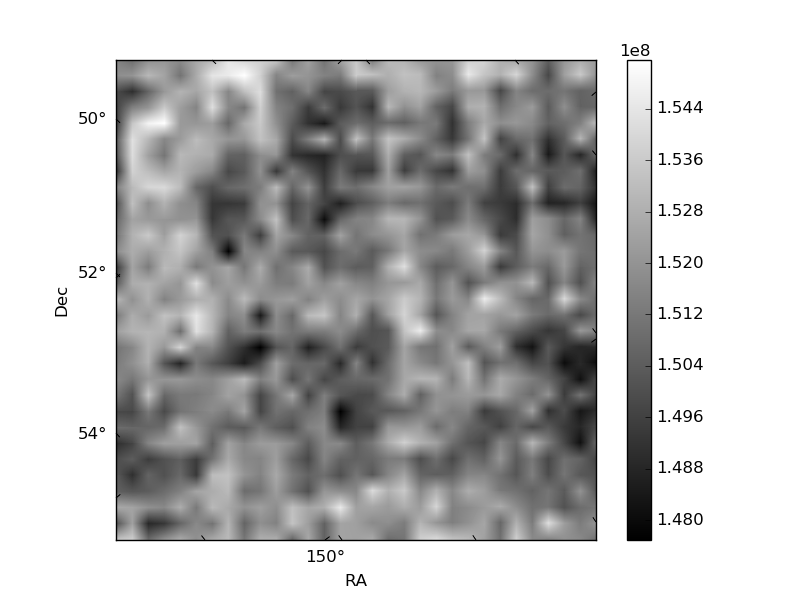
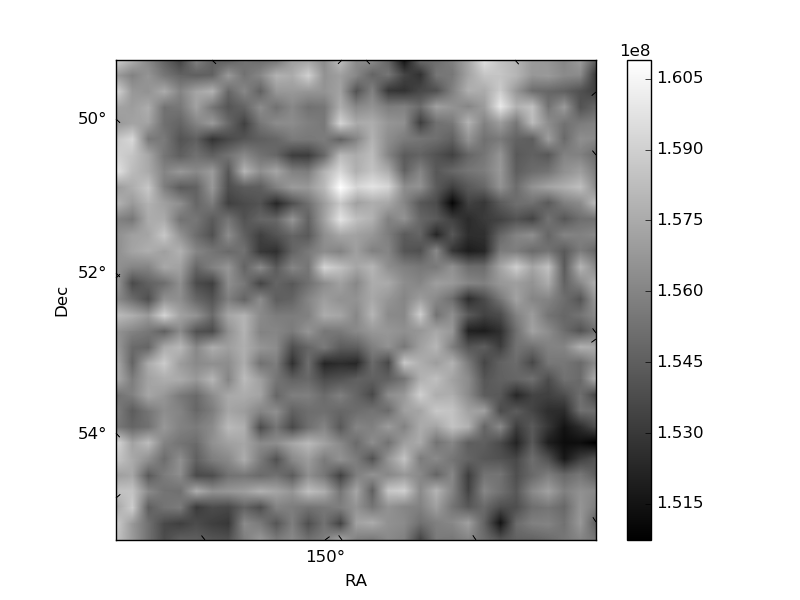
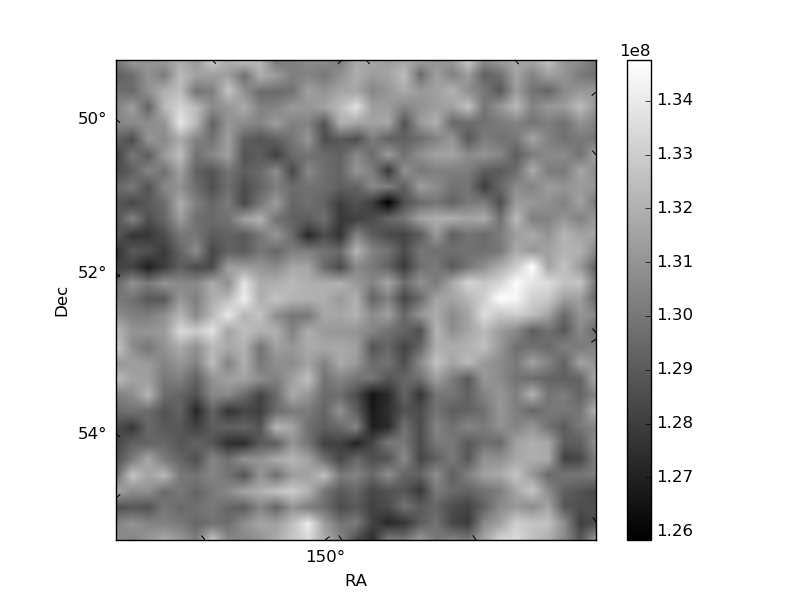
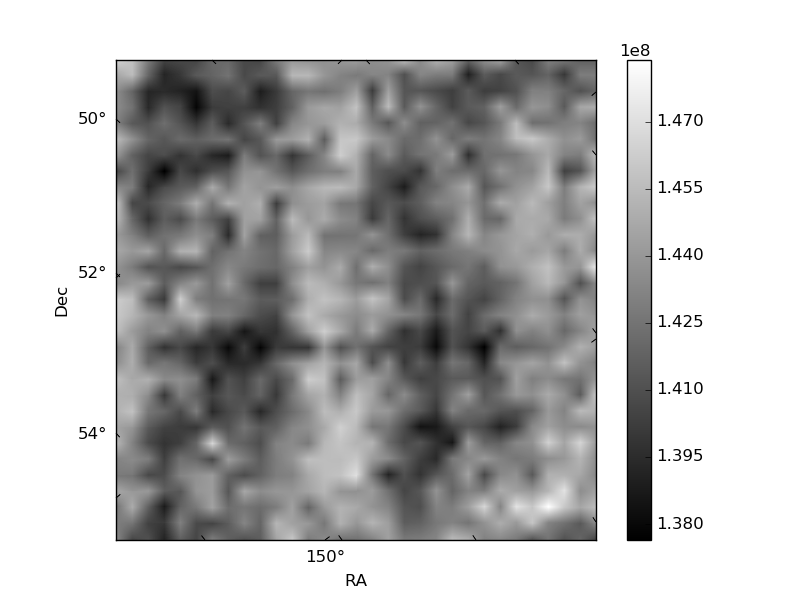
Histogram calculated using DETX and DETY for each event in the final _common_clean file
| Quadrant A | 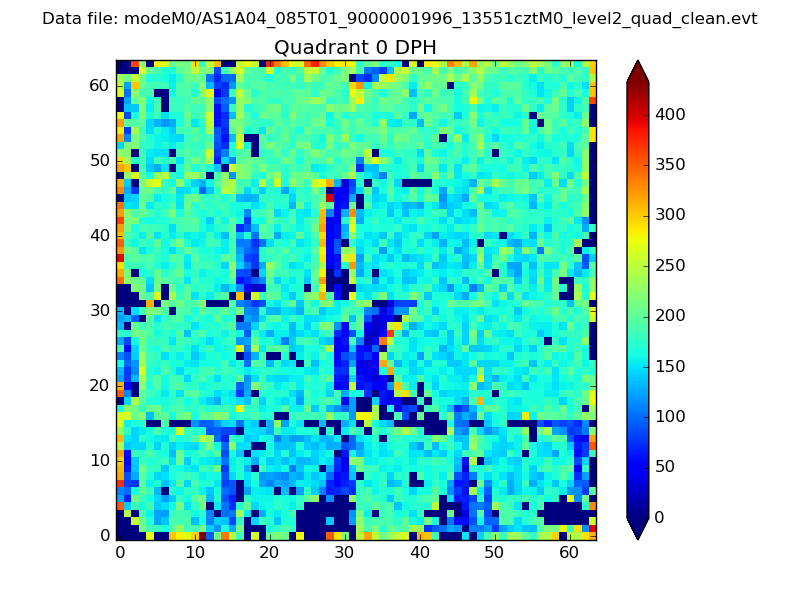 |
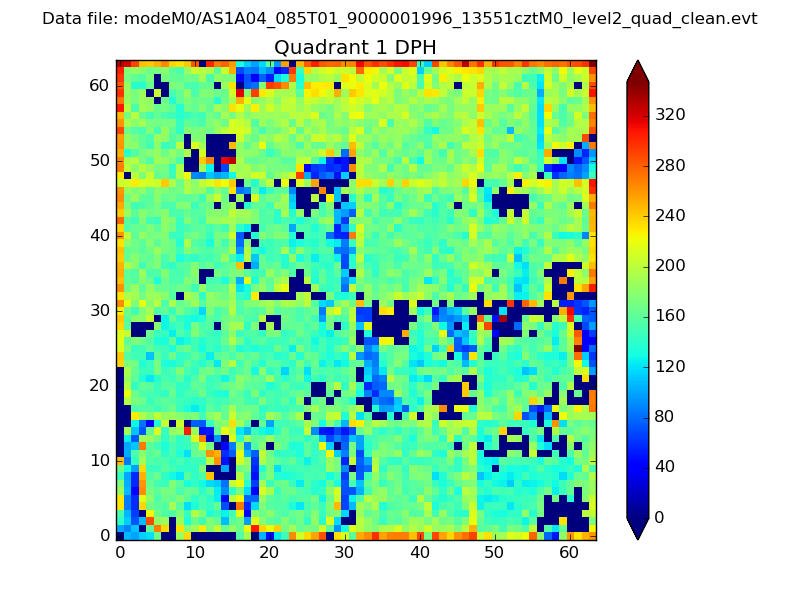 |
Quadrant B |
|---|---|---|---|
| Quadrant D | 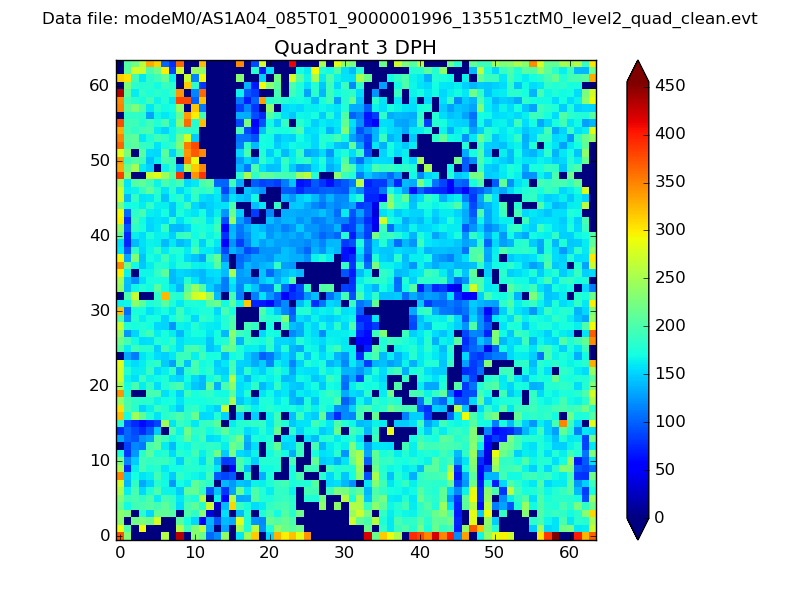 |
 |
Quadrant C |
| Plot type | Count rate plots | Images |
|---|---|---|
| Comparison with Poisson distribution Blue bars denote a histogram of data divided into 1 sec bins. Red curve is a Poisson curve with rate = median count rate of data. |
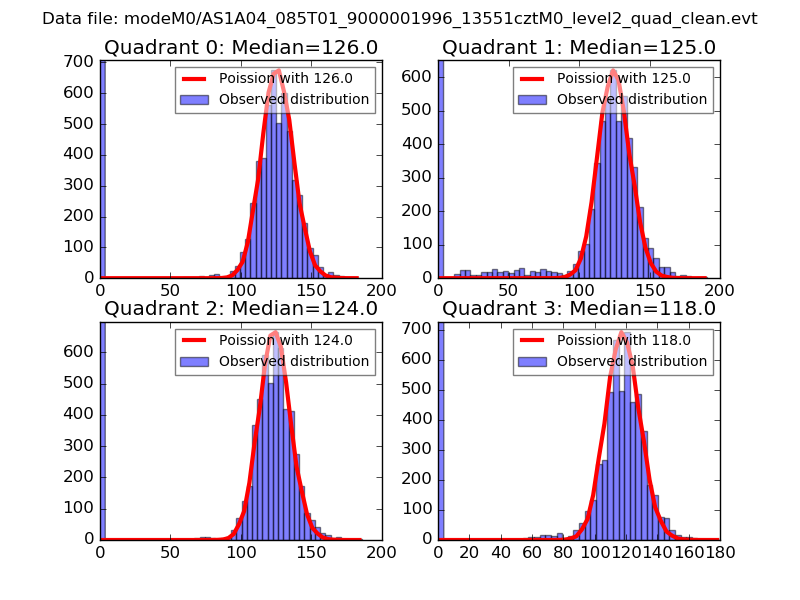 |
 |
| Quadrant-wise count rates Data is divided into 100 sec bins |
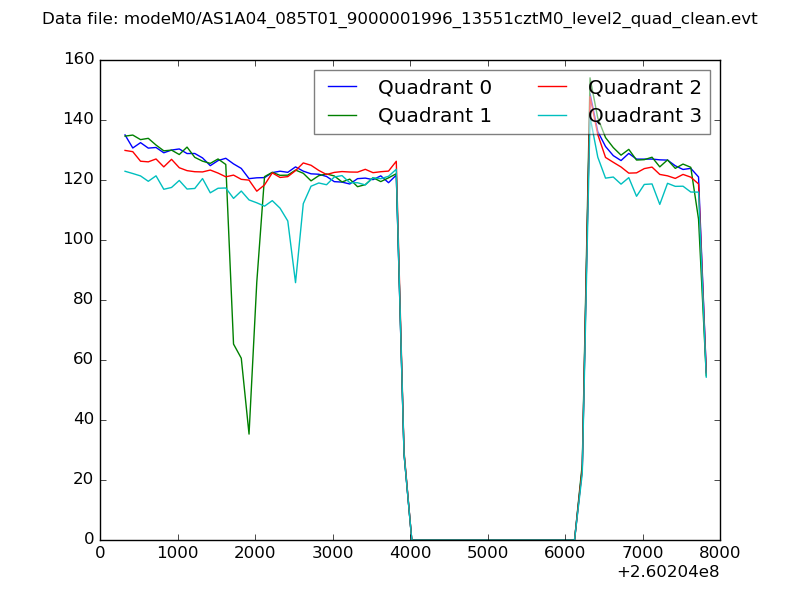 |
|
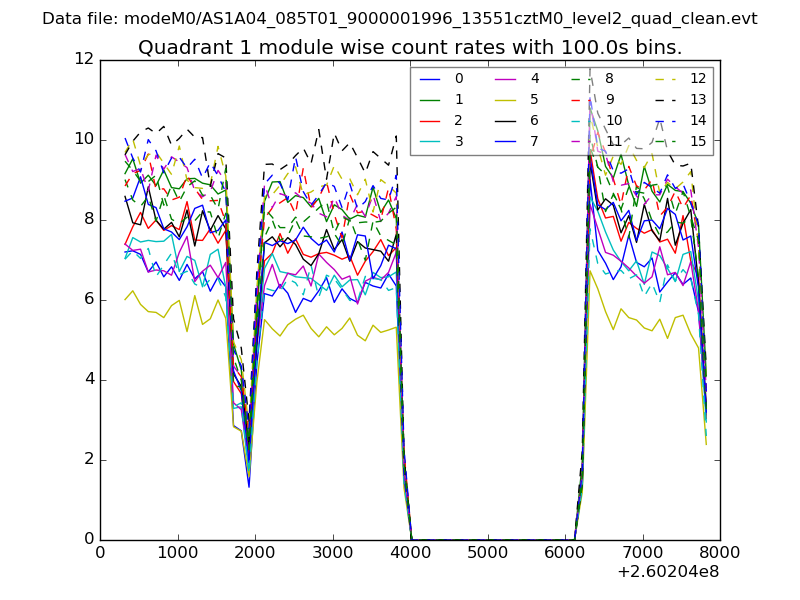
| Module-wise count rates for Quadrant A Data is divided into 100 sec bins |
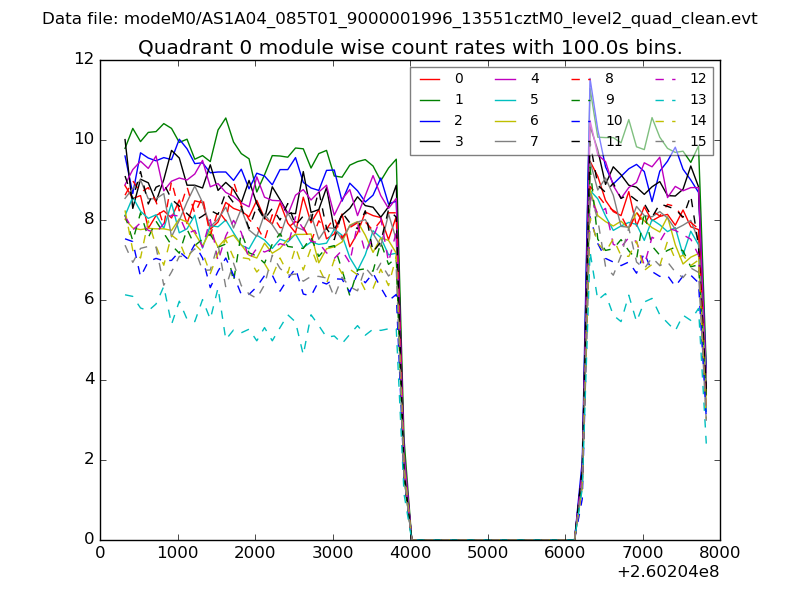 |
 |
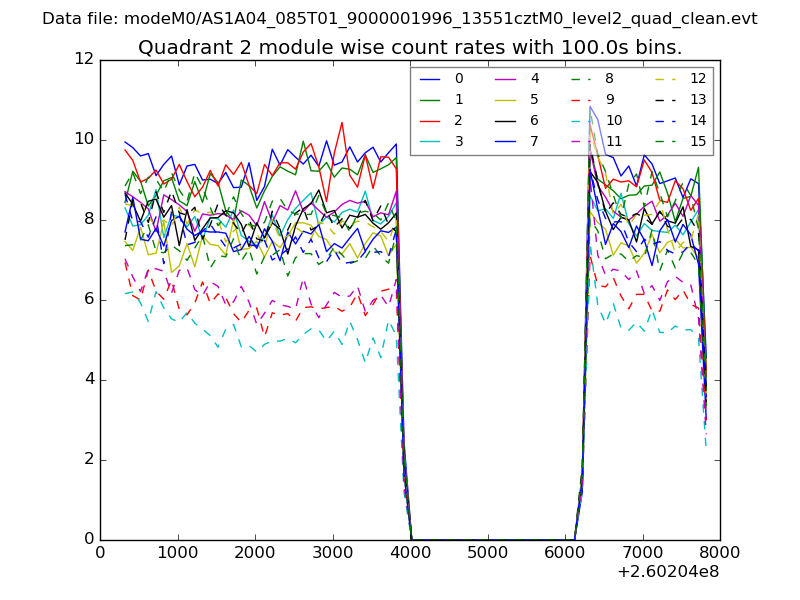
| Module-wise count rates for Quadrant B Data is divided into 100 sec bins |
 |
 |
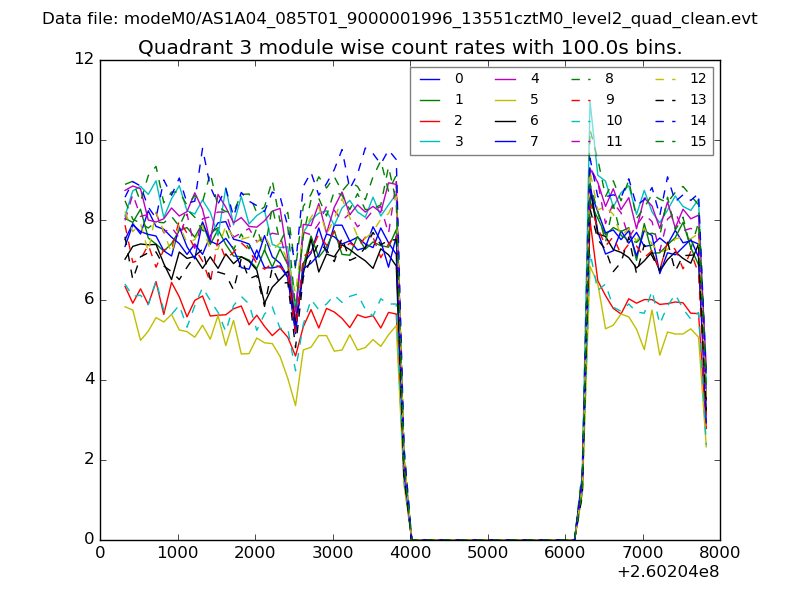
| Module-wise count rates for Quadrant C Data is divided into 100 sec bins |
 |
 |
| Module-wise count rates for Quadrant D Data is divided into 100 sec bins |
 |
 |
| Parameter | Plot |
|---|---|
| CZT HV Monitor | 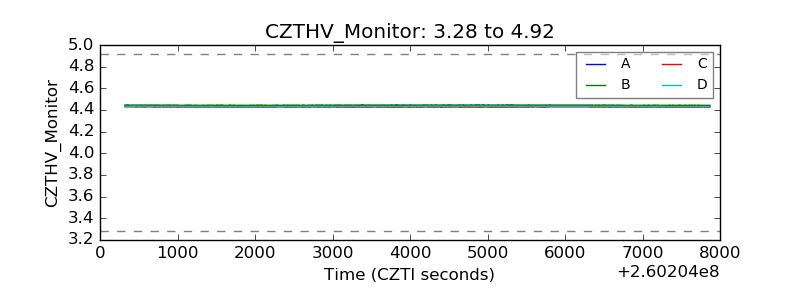 |
| D_VDD |  |
| Temperature 1 | 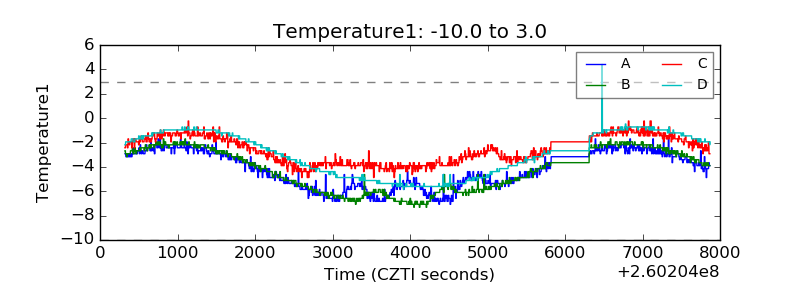 |
| Veto HV Monitor | 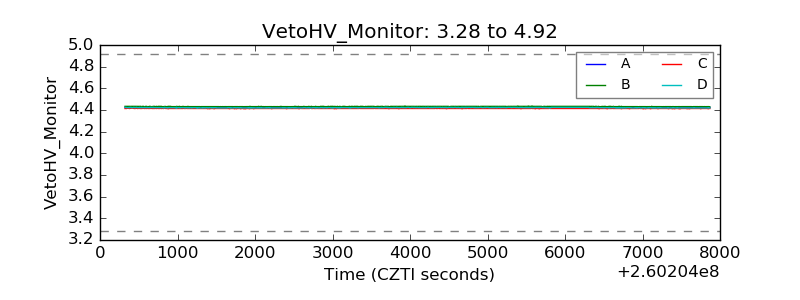 |
| Veto LLD | 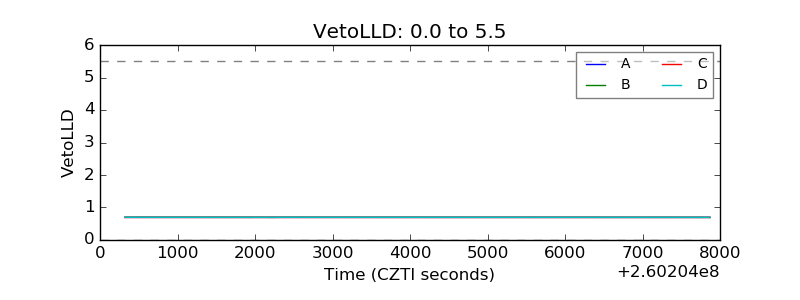 |
| Alpha Counter | 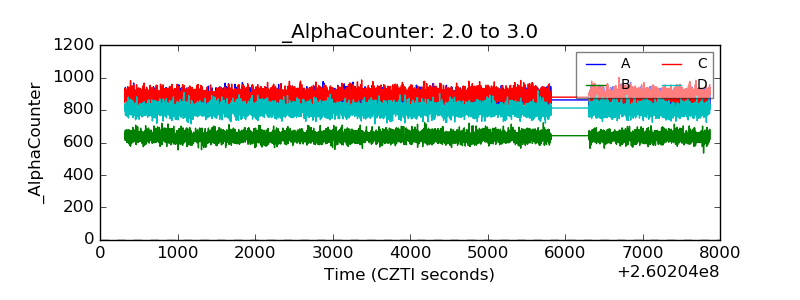 |
| _CPM_Rate | 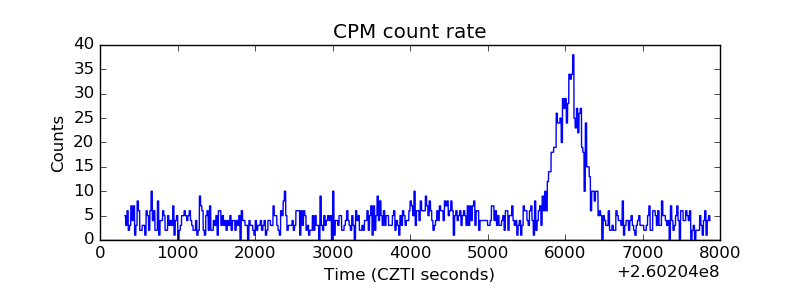 |
| CZT Counter | 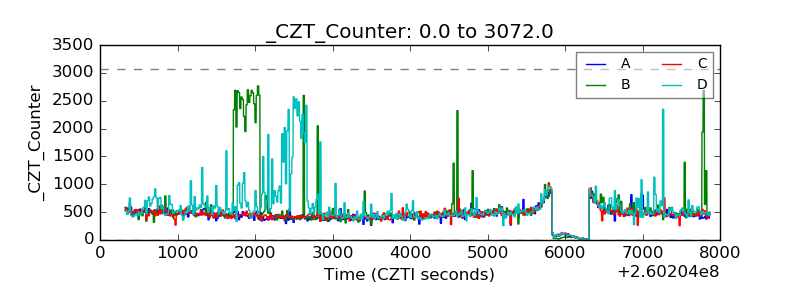 |
| +2.5 Volts monitor |  |
| +5 Volts monitor |  |
| _ROLL_ROT | 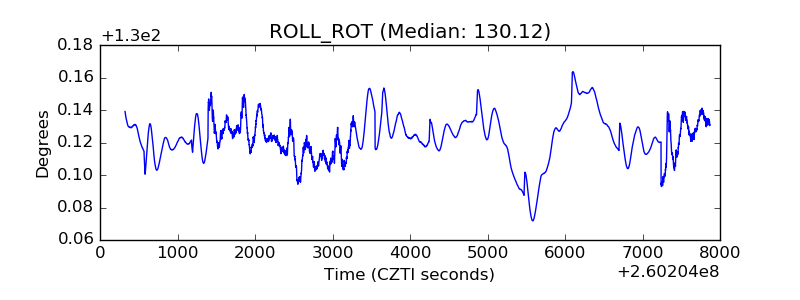 |
| _Roll_DEC | 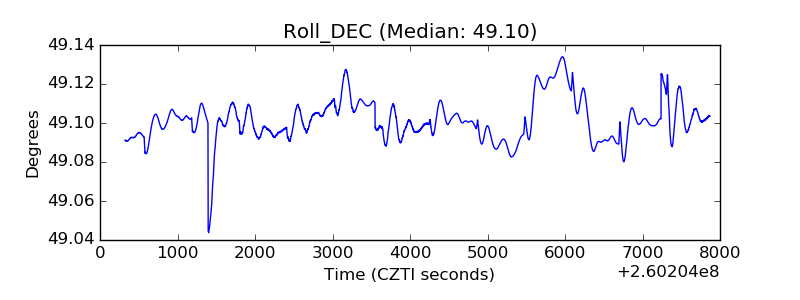 |
| _Roll_RA | 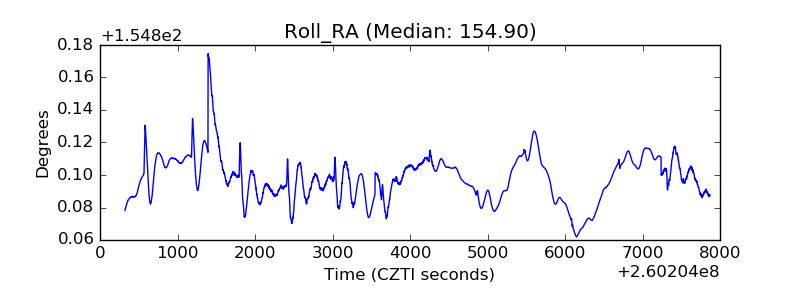 |
| Veto Counter | 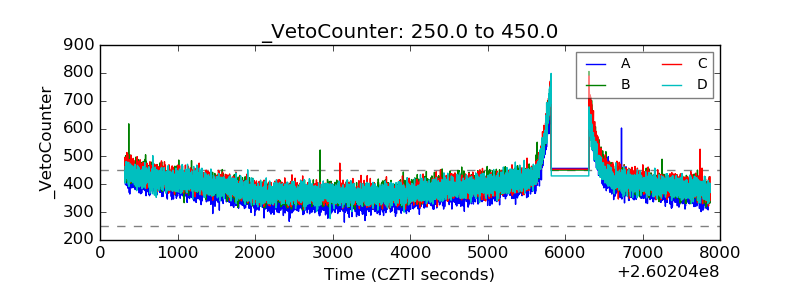 |