| Param | Original file | Final file |
|---|---|---|
| Filename | modeM0/AS1A04_085T01_9000001996_13553cztM0_level2.evt | modeM0/AS1A04_085T01_9000001996_13553cztM0_level2_quad_clean.evt |
| Size (bytes) | 197,066,880 | 43,467,840 |
| Size | 187.9 MB | 41.5 MB |
| Events in quadrant A | 1,141,159 | 293,254 |
| Events in quadrant B | 1,226,066 | 296,294 |
| Events in quadrant C | 1,191,962 | 291,399 |
| Events in quadrant D | 2,249,004 | 267,264 |
| Mode SS | |||
|---|---|---|---|
| Quadrant | BADHDUFLAG | Total packets | Discarded packets |
| A | 0 | 48 | 0 |
| B | 0 | 48 | 0 |
| C | 0 | 48 | 0 |
| D | 0 | 48 | 0 |
| Mode M9 | |||
|---|---|---|---|
| Quadrant | BADHDUFLAG | Total packets | Discarded packets |
| A | 0 | 2 | 0 |
| B | 0 | 2 | 0 |
| C | 0 | 2 | 0 |
| D | 0 | 2 | 0 |
| Mode M0 | |||
|---|---|---|---|
| Quadrant | BADHDUFLAG | Total packets | Discarded packets |
| A | 0 | 5058 | 1 |
| B | 0 | 5207 | 1 |
| C | 0 | 5086 | 1 |
| D | 0 | 8360 | 1 |
| Quadrant | Total seconds | Saturated seconds | Saturation percentage |
|---|---|---|---|
| A | 2328 | 75 | 3.221649% |
| B | 2328 | 97 | 4.166667% |
| C | 2328 | 59 | 2.534364% |
| D | 2328 | 220 | 9.450172% |
Noise dominated data is calculated using 1-second bins in cleaned event files. If a bin has >2000 counts, and if more than 50% of those come from <1% of pixels, then it is considered to be noise-dominated and hence unusable.
| Quadrant | # 1 sec bins | Bins with >0 counts | Bins with >2000 counts | High rate bins dominated by noise | Noise dominated (total time) | Noise dominated (detector-on time) | Marked lightcurve |
|---|---|---|---|---|---|---|---|
| A | 2524 | 2330 | 0 | 0 | 0.00% | 0.00% | 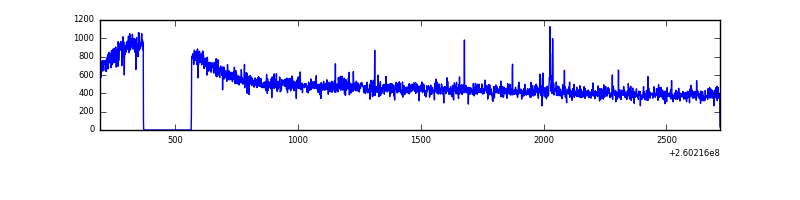 |
| B | 2524 | 2329 | 1 | 1 | 0.04% | 0.04% | 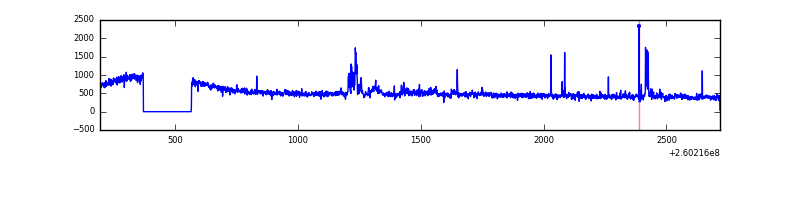 |
| C | 2524 | 2330 | 2 | 2 | 0.08% | 0.09% |  |
| D | 2524 | 2329 | 88 | 88 | 3.49% | 3.78% | 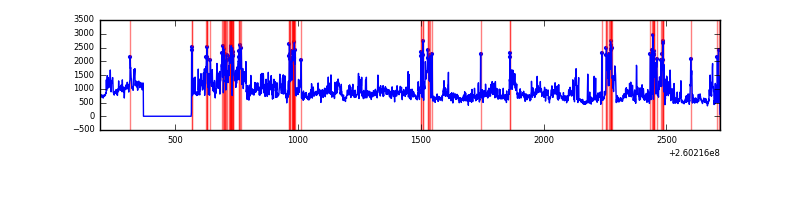 |
Top three noisy pixels from each quadrant. If the there are fewer than three noisy pixels in the level2.evt file, extra rows are filled as -1
| Pixel properties | Quadrant properties | ||||||
|---|---|---|---|---|---|---|---|
| Quadrant | DetID | PixID | Counts | Sigma | Mean | Median | Sigma |
| A | 1 | 162 | 3302 | 48.76 | 294 | 287 | 61.8 |
| A | 15 | 69 | 3232 | 47.62 | 294 | 287 | 61.8 |
| A | 0 | 226 | 2695 | 38.94 | 294 | 287 | 61.8 |
| B | 0 | 182 | 59594 | 1011.15 | 292 | 284 | 58.7 |
| B | 3 | 209 | 14989 | 250.7 | 292 | 284 | 58.7 |
| B | 12 | 111 | 6276 | 102.16 | 292 | 284 | 58.7 |
| C | 3 | 233 | 50596 | 724.47 | 290 | 291 | 69.4 |
| C | 14 | 234 | 7816 | 108.37 | 290 | 291 | 69.4 |
| C | 13 | 61 | 2124 | 26.4 | 290 | 291 | 69.4 |
| D | 13 | 122 | 673586 | 9535.55 | 283 | 274 | 70.6 |
| D | 8 | 195 | 404616 | 5726.35 | 283 | 274 | 70.6 |
| D | 2 | 14 | 73863 | 1042.18 | 283 | 274 | 70.6 |
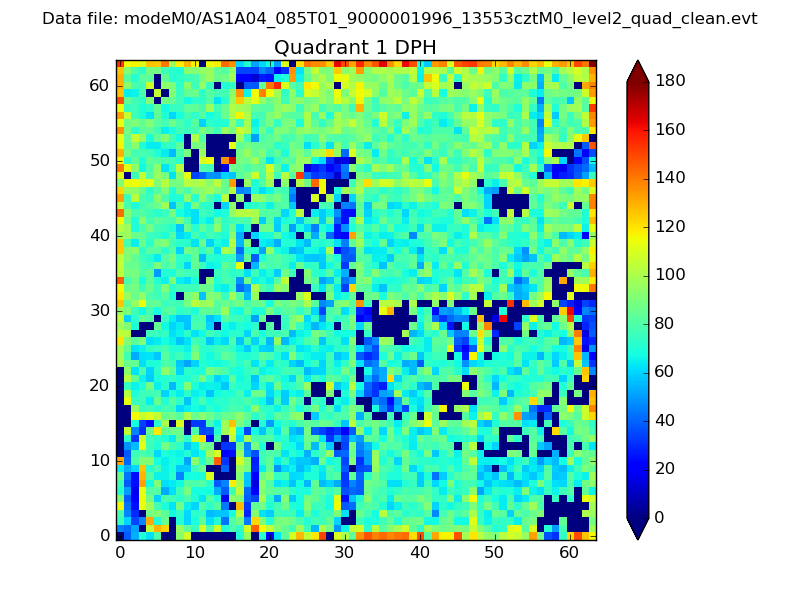
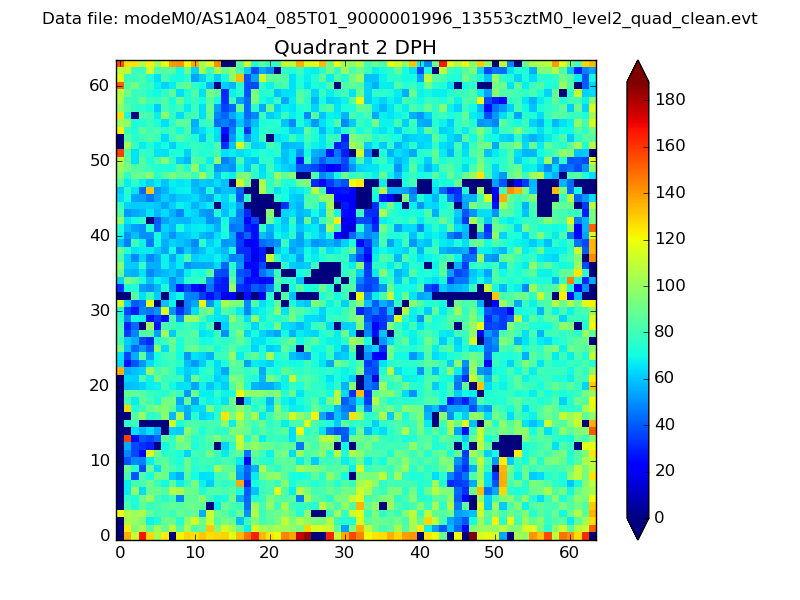
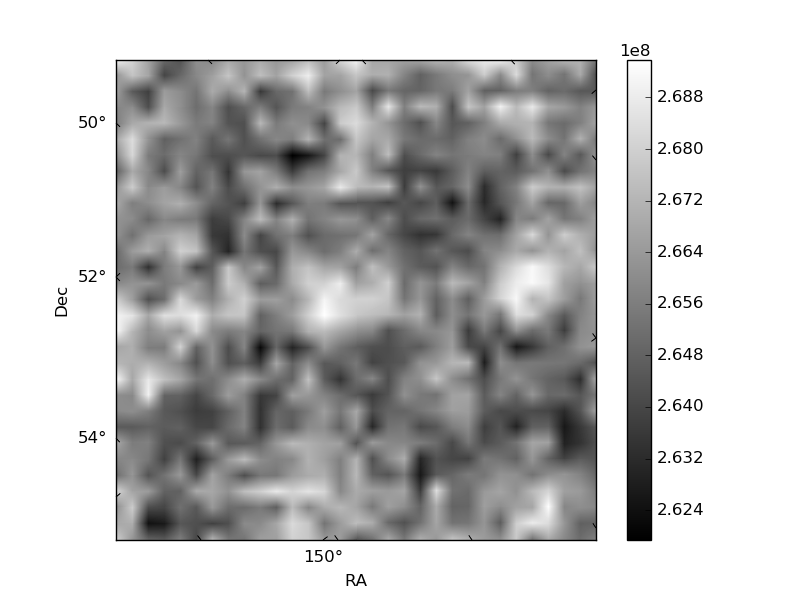
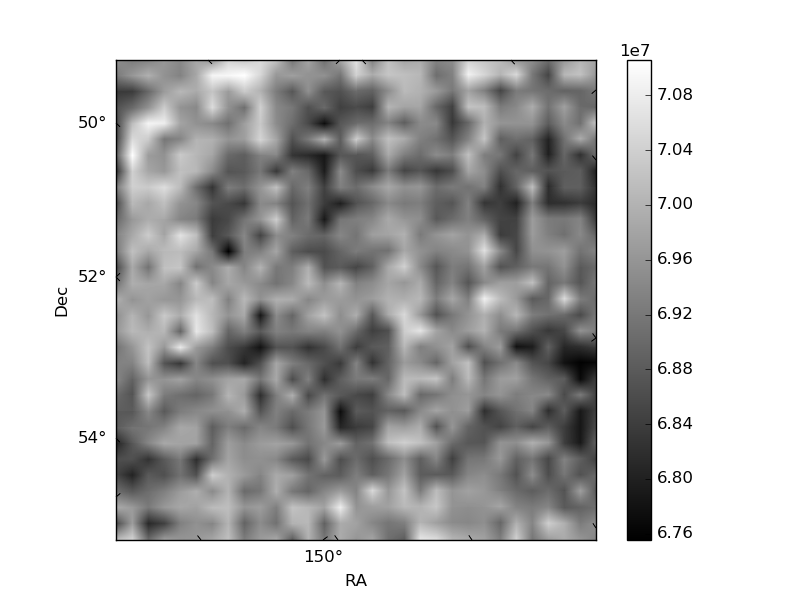
Histogram calculated using DETX and DETY for each event in the final _common_clean file
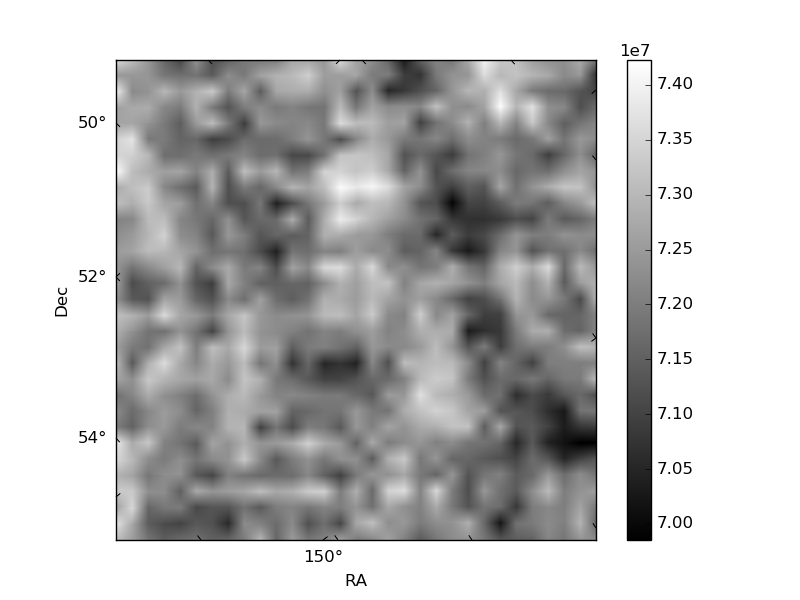
| Quadrant A | 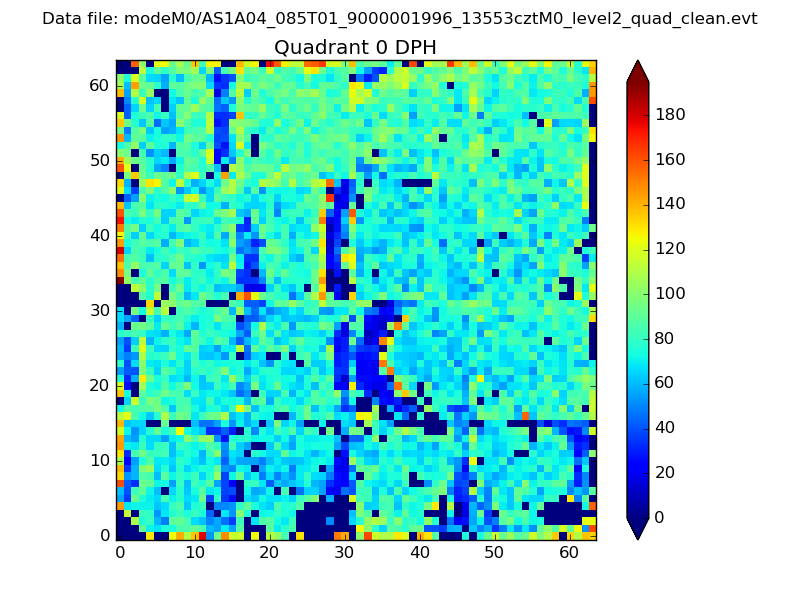 |
 |
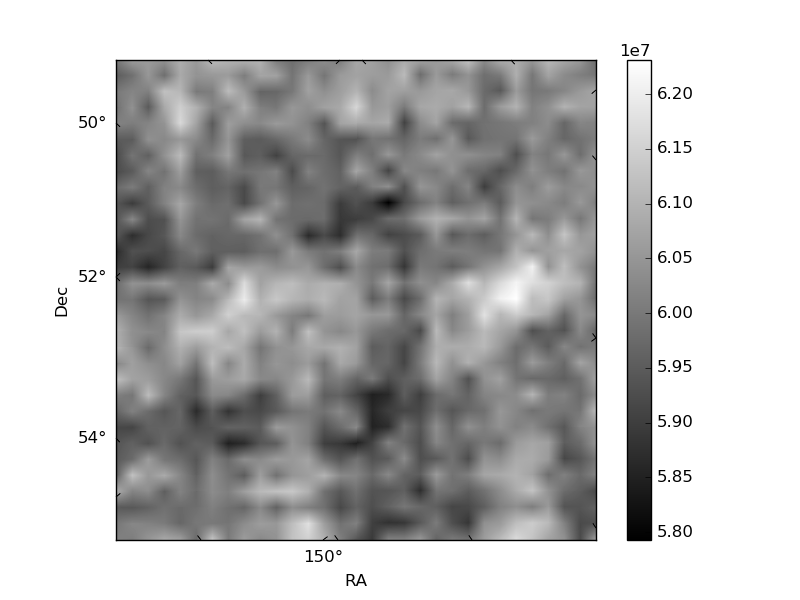
Quadrant B |
|---|---|---|---|
| Quadrant D | 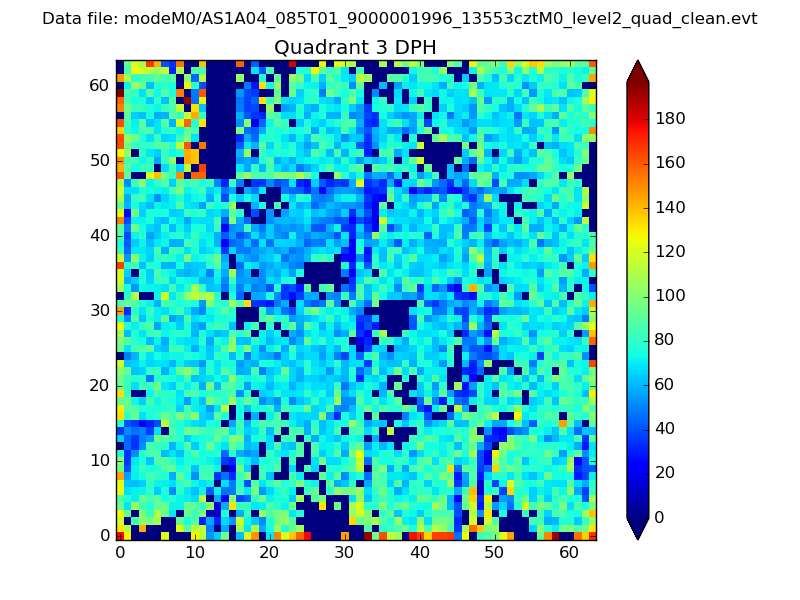 |
 |
Quadrant C |
| Plot type | Count rate plots | Images |
|---|---|---|
| Comparison with Poisson distribution Blue bars denote a histogram of data divided into 1 sec bins. Red curve is a Poisson curve with rate = median count rate of data. |
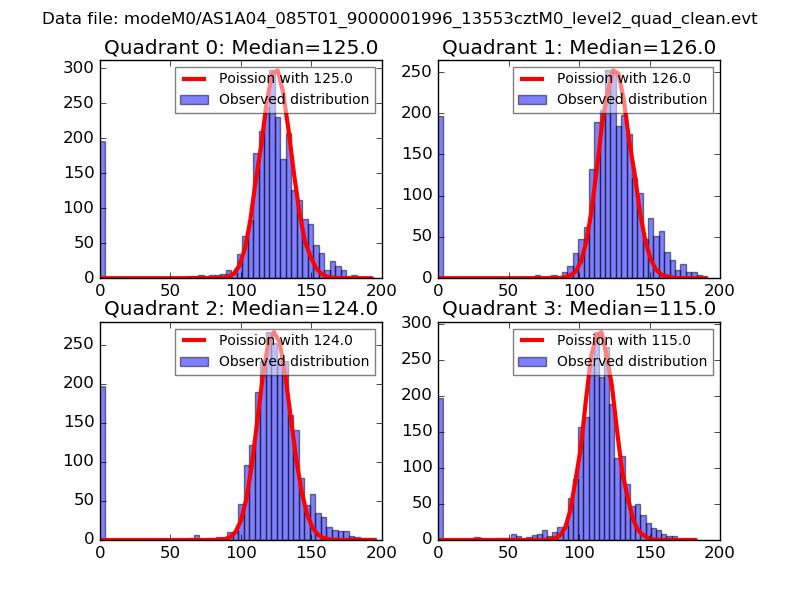 |
 |
| Quadrant-wise count rates Data is divided into 100 sec bins |
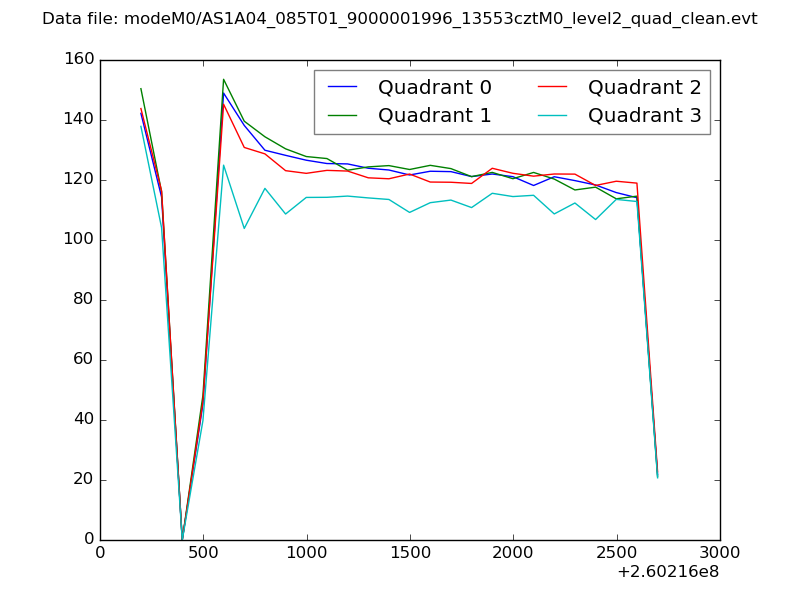 |
|
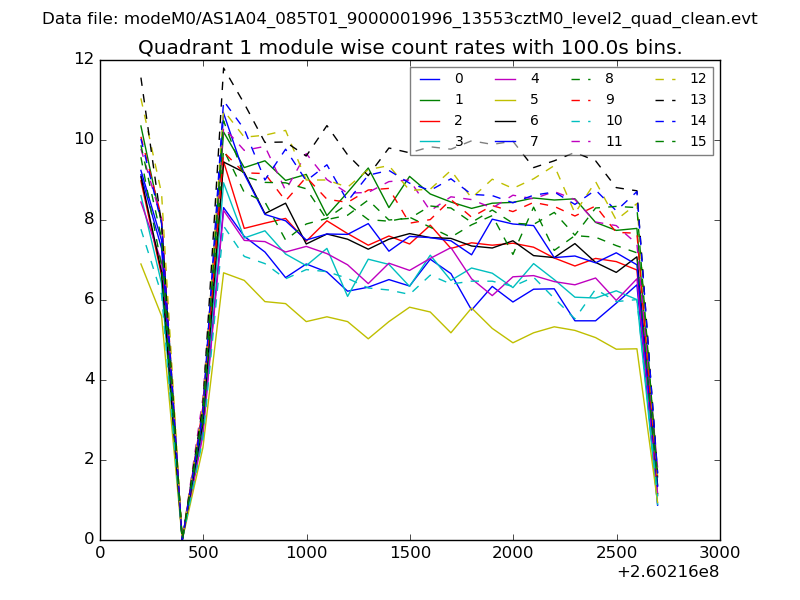
| Module-wise count rates for Quadrant A Data is divided into 100 sec bins |
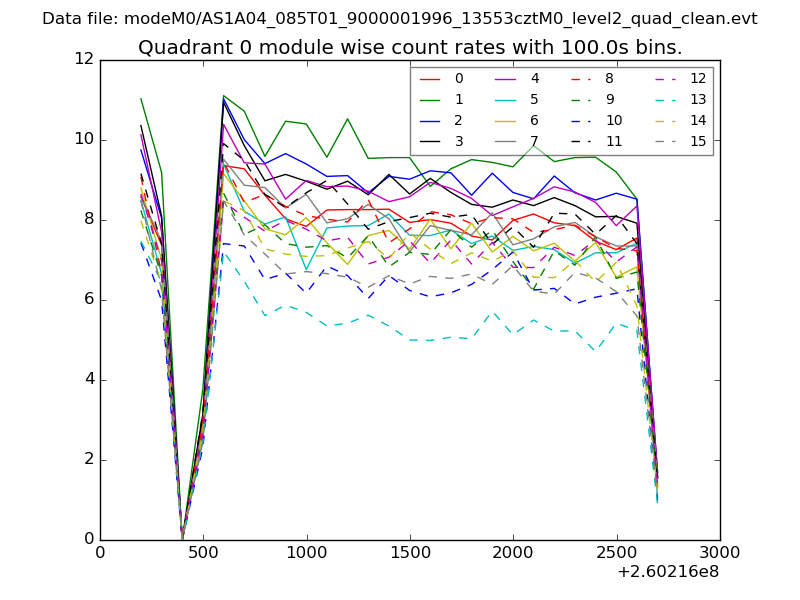 |
 |
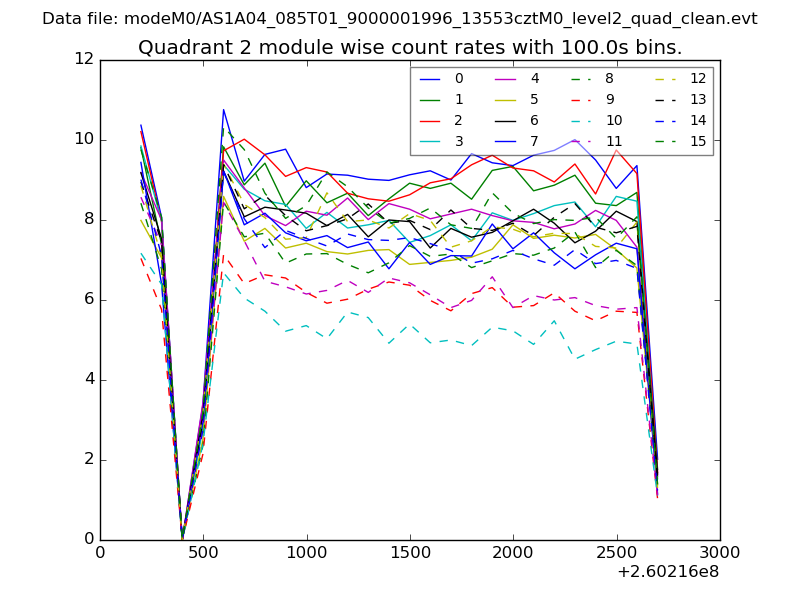
| Module-wise count rates for Quadrant B Data is divided into 100 sec bins |
 |
 |
| Module-wise count rates for Quadrant C Data is divided into 100 sec bins |
 |
 |
| Module-wise count rates for Quadrant D Data is divided into 100 sec bins |
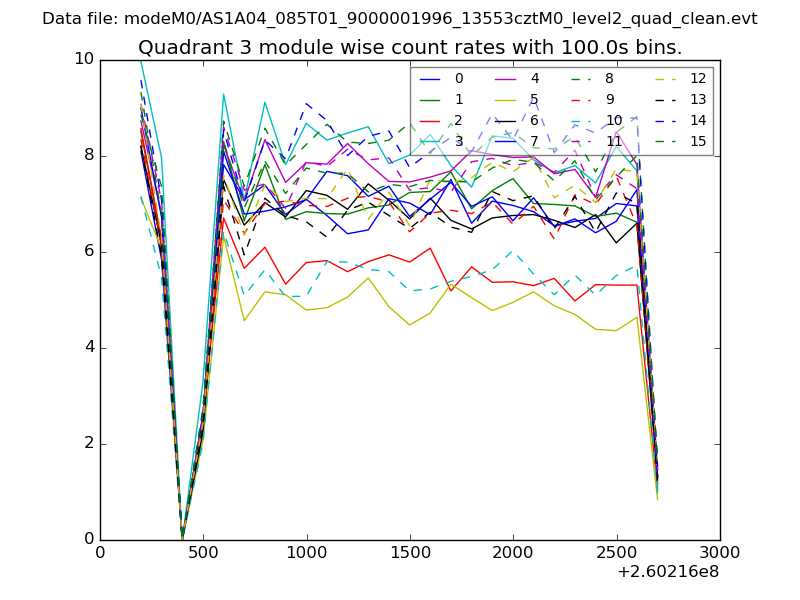 |
 |
| Parameter | Plot |
|---|---|
| CZT HV Monitor | 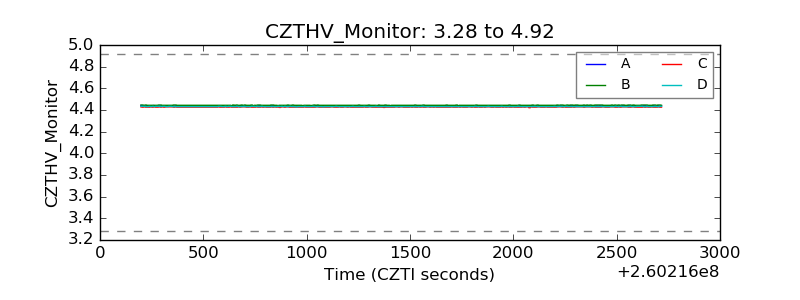 |
| D_VDD | 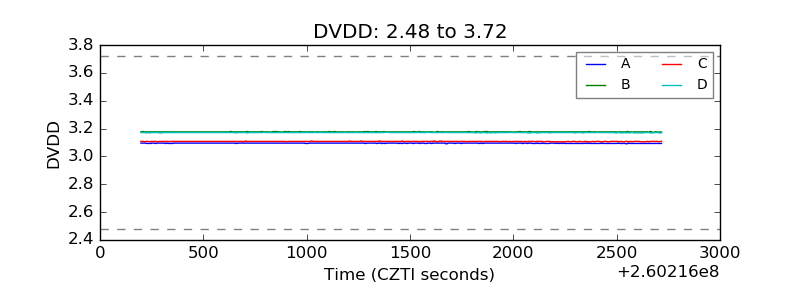 |
| Temperature 1 | 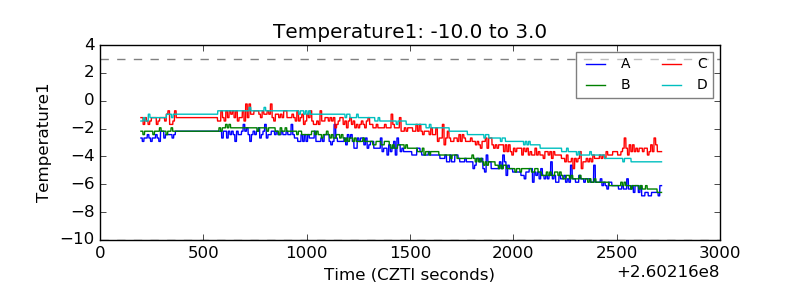 |
| Veto HV Monitor | 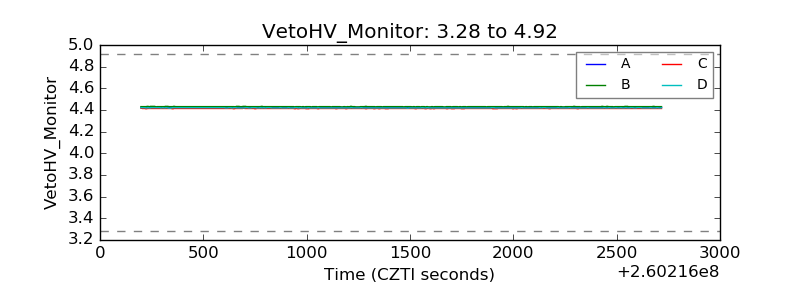 |
| Veto LLD | 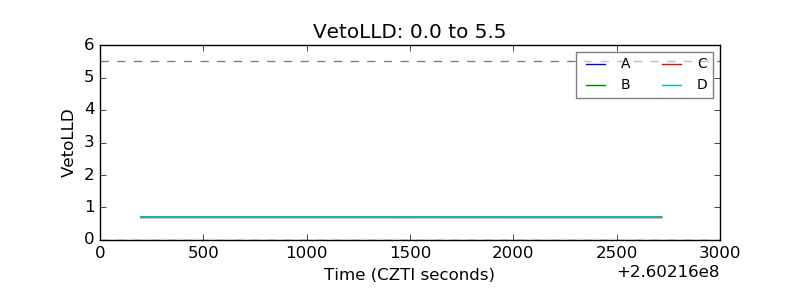 |
| Alpha Counter | 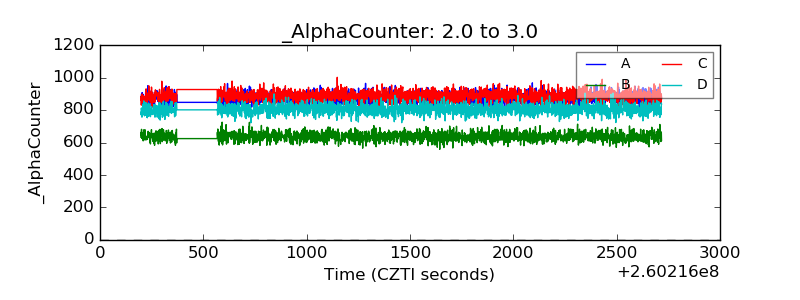 |
| _CPM_Rate | 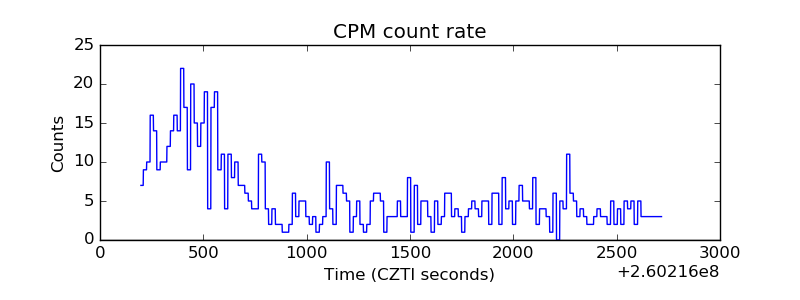 |
| CZT Counter | 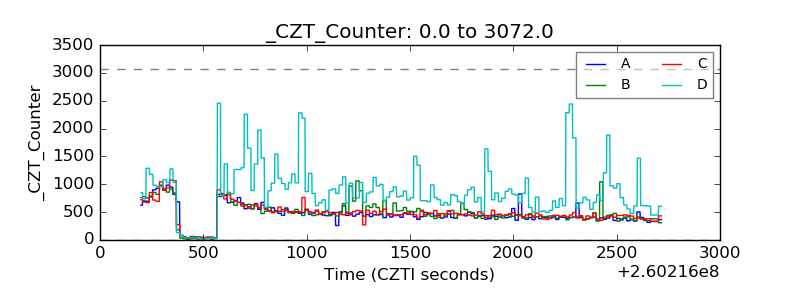 |
| +2.5 Volts monitor |  |
| +5 Volts monitor |  |
| _ROLL_ROT | 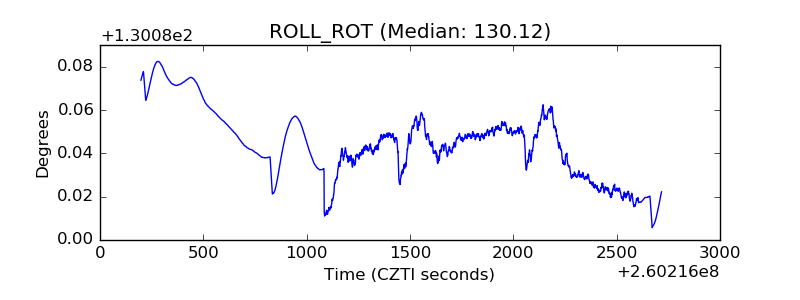 |
| _Roll_DEC | 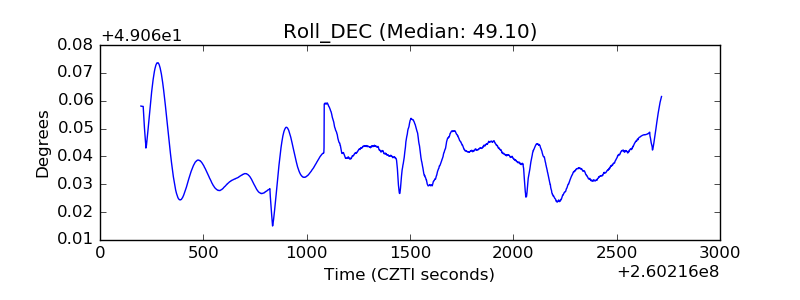 |
| _Roll_RA | 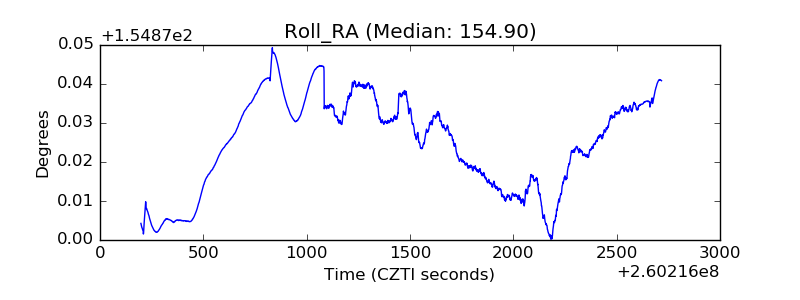 |
| Veto Counter | 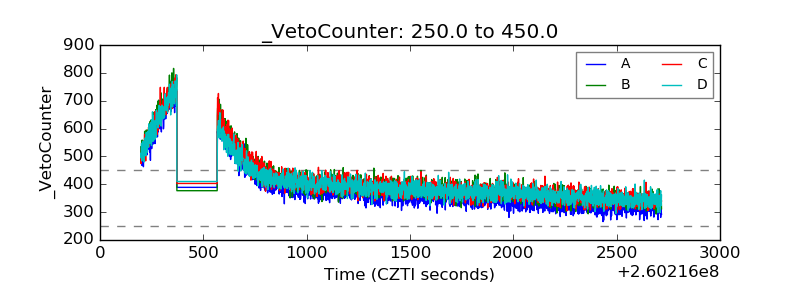 |