| Param | Original file | Final file |
|---|---|---|
| Filename | modeM0/AS1G08_032T01_9000001998cztM0_level2.fits | modeM0/AS1G08_032T01_9000001998cztM0_level2_quad_clean.evt |
| Size (bytes) | 201,706,560 | 245,047,680 |
| Size | 192.4 MB | 233.7 MB |
| Events in quadrant A | 1,208,738 | 1,492,022 |
| Events in quadrant B | 1,153,066 | 1,458,041 |
| Events in quadrant C | 1,205,132 | 1,549,730 |
| Events in quadrant D | 1,027,260 | 1,407,758 |
| Mode SS | |||
|---|---|---|---|
| Quadrant | BADHDUFLAG | Total packets | Discarded packets |
| A | 0 | 454 | 0 |
| B | 0 | 450 | 0 |
| C | 0 | 448 | 0 |
| D | 0 | 446 | 0 |
| Mode M0 | |||
|---|---|---|---|
| Quadrant | BADHDUFLAG | Total packets | Discarded packets |
| A | 0 | 45153 | 0 |
| B | 0 | 46571 | 0 |
| C | 0 | 45126 | 0 |
| D | 0 | 55664 | 0 |
| Mode M9 | |||
|---|---|---|---|
| Quadrant | BADHDUFLAG | Total packets | Discarded packets |
| A | 0 | 23 | 0 |
| B | 0 | 23 | 0 |
| C | 0 | 23 | 0 |
| D | 0 | 23 | 0 |
| Quadrant | Total seconds | Saturated seconds | Saturation percentage |
|---|---|---|---|
| A | 22012 | 146 | 0.663275% |
| B | 22012 | 242 | 1.099400% |
| C | 21982 | 125 | 0.568647% |
| D | 21966 | 881 | 4.010744% |
Noise dominated data is calculated using 1-second bins in cleaned event files. If a bin has >2000 counts, and if more than 50% of those come from <1% of pixels, then it is considered to be noise-dominated and hence unusable.
| Quadrant | # 1 sec bins | Bins with >0 counts | Bins with >2000 counts | High rate bins dominated by noise | Noise dominated (total time) | Noise dominated (detector-on time) | Marked lightcurve |
|---|---|---|---|---|---|---|---|
| A | 26149 | 22307 | 0 | 0 | 0.00% | 0.00% |  |
| B | 26149 | 22277 | 0 | 0 | 0.00% | 0.00% |  |
| C | 26149 | 22259 | 0 | 0 | 0.00% | 0.00% |  |
| D | 26148 | 22224 | 0 | 0 | 0.00% | 0.00% |  |
Top three noisy pixels from each quadrant. If the there are fewer than three noisy pixels in the level2.evt file, extra rows are filled as -1
| Pixel properties | Quadrant properties | ||||||
|---|---|---|---|---|---|---|---|
| Quadrant | DetID | PixID | Counts | Sigma | Mean | Median | Sigma |
| A | 0 | 29 | 1119 | 10.18 | 314 | 294 | 81.0 |
| A | 7 | 110 | 1000 | 8.71 | 314 | 294 | 81.0 |
| A | 9 | 19 | 960 | 8.22 | 314 | 294 | 81.0 |
| B | 2 | 9 | 987 | 11.23 | 304 | 288 | 62.2 |
| B | 14 | 254 | 808 | 8.36 | 304 | 288 | 62.2 |
| B | 3 | 17 | 790 | 8.07 | 304 | 288 | 62.2 |
| C | 1 | 81 | 969 | 8.13 | 316 | 295 | 82.9 |
| C | 1 | 80 | 960 | 8.02 | 316 | 295 | 82.9 |
| C | 12 | 250 | 868 | 6.91 | 316 | 295 | 82.9 |
| D | 6 | 231 | 835 | 6.92 | 293 | 265 | 82.4 |
| D | 4 | 246 | 807 | 6.58 | 293 | 265 | 82.4 |
| D | 4 | 160 | 741 | 5.78 | 293 | 265 | 82.4 |
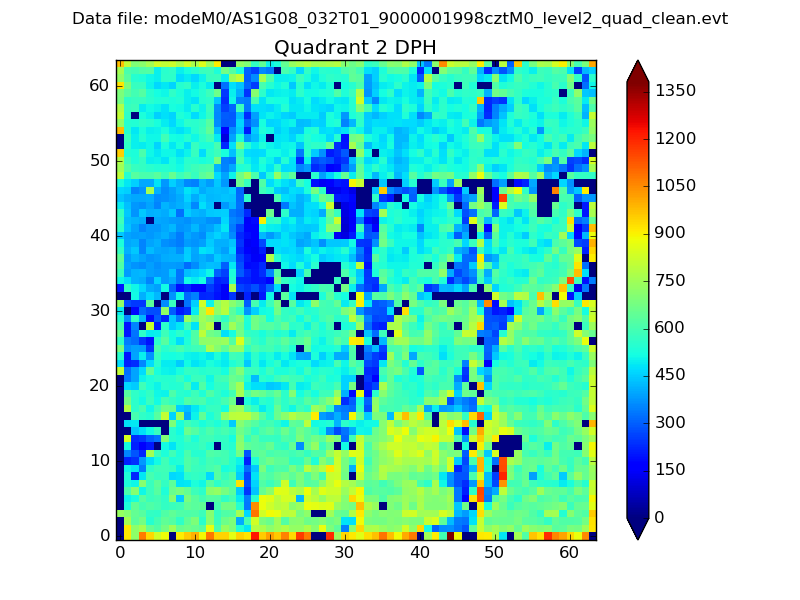
Histogram calculated using DETX and DETY for each event in the final _common_clean file
| Quadrant A |  |
 |
Quadrant B |
|---|---|---|---|
| Quadrant D |  |
 |
Quadrant C |
| Plot type | Count rate plots | Images |
|---|---|---|
| Comparison with Poisson distribution Blue bars denote a histogram of data divided into 1 sec bins. Red curve is a Poisson curve with rate = median count rate of data. |
 |
 |
| Quadrant-wise count rates Data is divided into 100 sec bins |
 |
|
| Module-wise count rates for Quadrant A Data is divided into 100 sec bins |
 |
 |
| Module-wise count rates for Quadrant B Data is divided into 100 sec bins |
 |
 |
| Module-wise count rates for Quadrant C Data is divided into 100 sec bins |
 |
 |
| Module-wise count rates for Quadrant D Data is divided into 100 sec bins |
 |
 |
| Parameter | Plot |
|---|---|
| CZT HV Monitor |  |
| D_VDD | 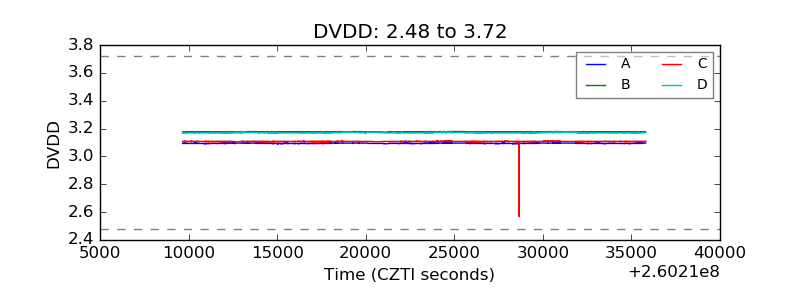 |
| Temperature 1 |  |
| Veto HV Monitor |  |
| Veto LLD | 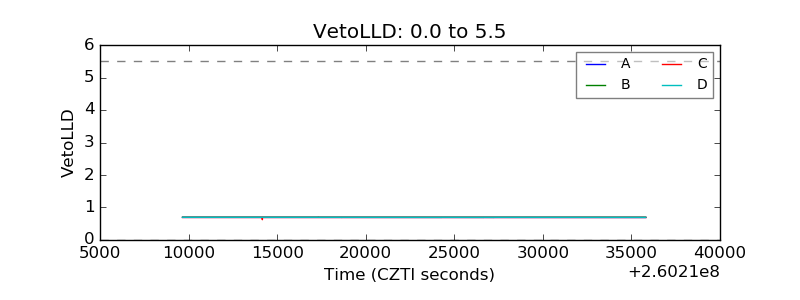 |
| Alpha Counter |  |
| _CPM_Rate | 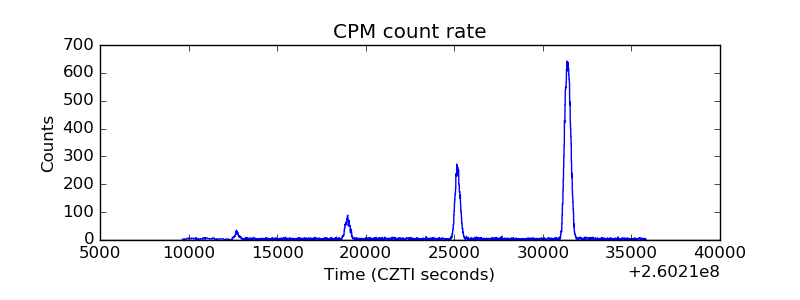 |
| CZT Counter |  |
| +2.5 Volts monitor |  |
| +5 Volts monitor |  |
| _ROLL_ROT |  |
| _Roll_DEC |  |
| _Roll_RA |  |
| Veto Counter |  |