| Param | Original file | Final file |
|---|---|---|
| Filename | modeM0/AS1G08_032T01_9000001998_13553cztM0_level2.evt | modeM0/AS1G08_032T01_9000001998_13553cztM0_level2_quad_clean.evt |
| Size (bytes) | 345,755,520 | 58,017,600 |
| Size | 329.7 MB | 55.3 MB |
| Events in quadrant A | 2,151,310 | 355,217 |
| Events in quadrant B | 2,268,308 | 350,941 |
| Events in quadrant C | 2,235,472 | 373,409 |
| Events in quadrant D | 3,508,085 | 359,135 |
| Mode SS | |||
|---|---|---|---|
| Quadrant | BADHDUFLAG | Total packets | Discarded packets |
| A | 0 | 94 | 0 |
| B | 0 | 94 | 0 |
| C | 0 | 94 | 0 |
| D | 0 | 94 | 0 |
| Mode M0 | |||
|---|---|---|---|
| Quadrant | BADHDUFLAG | Total packets | Discarded packets |
| A | 0 | 9372 | 2 |
| B | 0 | 9697 | 1 |
| C | 0 | 9365 | 1 |
| D | 0 | 13409 | 1 |
| Mode M9 | |||
|---|---|---|---|
| Quadrant | BADHDUFLAG | Total packets | Discarded packets |
| A | 0 | 3 | 0 |
| B | 0 | 3 | 0 |
| C | 0 | 3 | 0 |
| D | 0 | 3 | 0 |
| Quadrant | Total seconds | Saturated seconds | Saturation percentage |
|---|---|---|---|
| A | 4521 | 77 | 1.703163% |
| B | 4521 | 99 | 2.189781% |
| C | 4521 | 65 | 1.437735% |
| D | 4521 | 400 | 8.847600% |
Noise dominated data is calculated using 1-second bins in cleaned event files. If a bin has >2000 counts, and if more than 50% of those come from <1% of pixels, then it is considered to be noise-dominated and hence unusable.
| Quadrant | # 1 sec bins | Bins with >0 counts | Bins with >2000 counts | High rate bins dominated by noise | Noise dominated (total time) | Noise dominated (detector-on time) | Marked lightcurve |
|---|---|---|---|---|---|---|---|
| A | 4817 | 4522 | 0 | 0 | 0.00% | 0.00% | 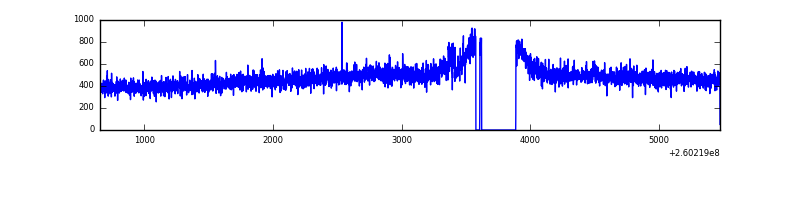 |
| B | 4817 | 4522 | 11 | 11 | 0.23% | 0.24% | 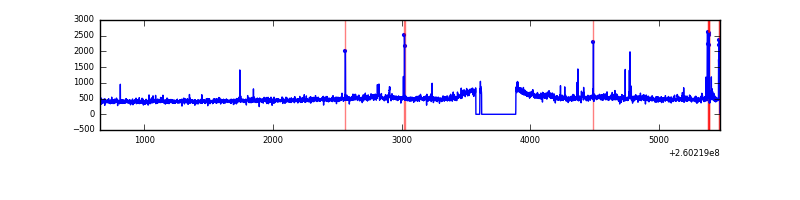 |
| C | 4817 | 4522 | 0 | 0 | 0.00% | 0.00% | 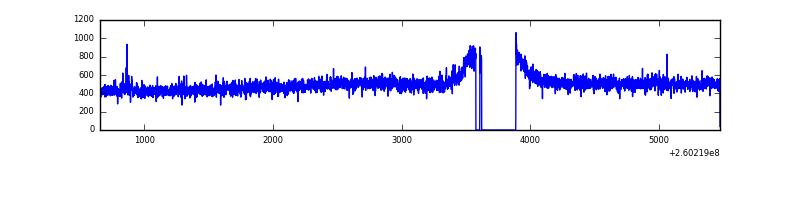 |
| D | 4817 | 4522 | 267 | 267 | 5.54% | 5.90% | 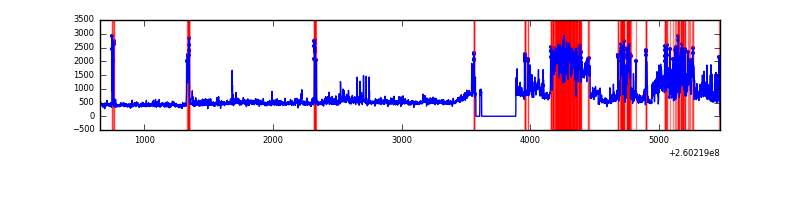 |
Top three noisy pixels from each quadrant. If the there are fewer than three noisy pixels in the level2.evt file, extra rows are filled as -1
| Pixel properties | Quadrant properties | ||||||
|---|---|---|---|---|---|---|---|
| Quadrant | DetID | PixID | Counts | Sigma | Mean | Median | Sigma |
| A | 10 | 229 | 15366 | 129.67 | 552 | 541 | 114.3 |
| A | 1 | 162 | 7125 | 57.59 | 552 | 541 | 114.3 |
| A | 0 | 226 | 5006 | 39.05 | 552 | 541 | 114.3 |
| B | 3 | 64 | 59875 | 559.77 | 546 | 530 | 106.0 |
| B | 3 | 209 | 24724 | 228.21 | 546 | 530 | 106.0 |
| B | 4 | 173 | 19021 | 174.42 | 546 | 530 | 106.0 |
| C | 3 | 233 | 122048 | 975.08 | 539 | 540 | 124.6 |
| C | 4 | 175 | 5294 | 38.15 | 539 | 540 | 124.6 |
| C | 12 | 4 | 3997 | 27.74 | 539 | 540 | 124.6 |
| D | 13 | 122 | 1152256 | 8959.65 | 529 | 513 | 128.5 |
| D | 8 | 195 | 189681 | 1471.57 | 529 | 513 | 128.5 |
| D | 2 | 136 | 52675 | 405.78 | 529 | 513 | 128.5 |
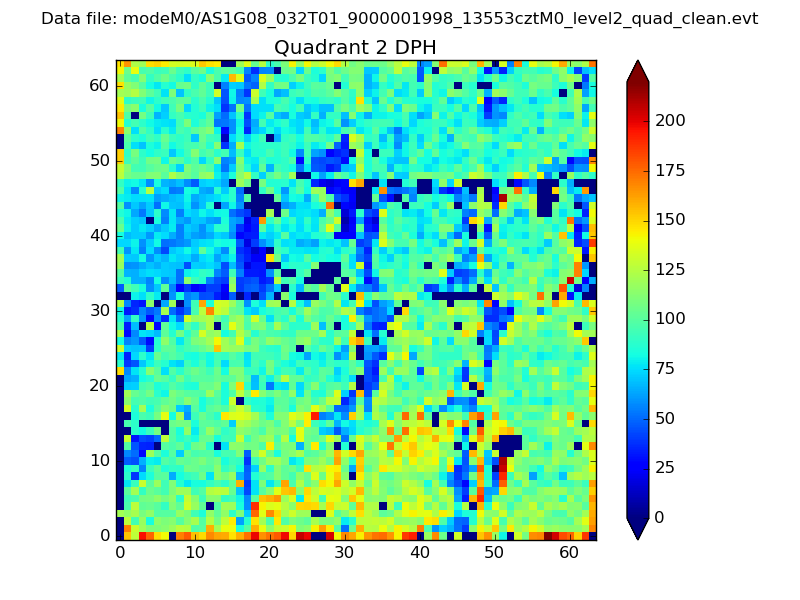
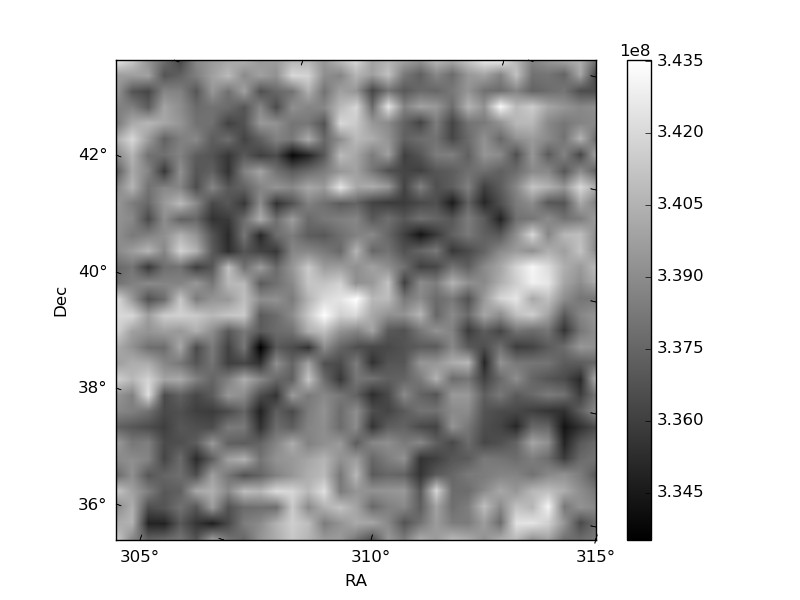
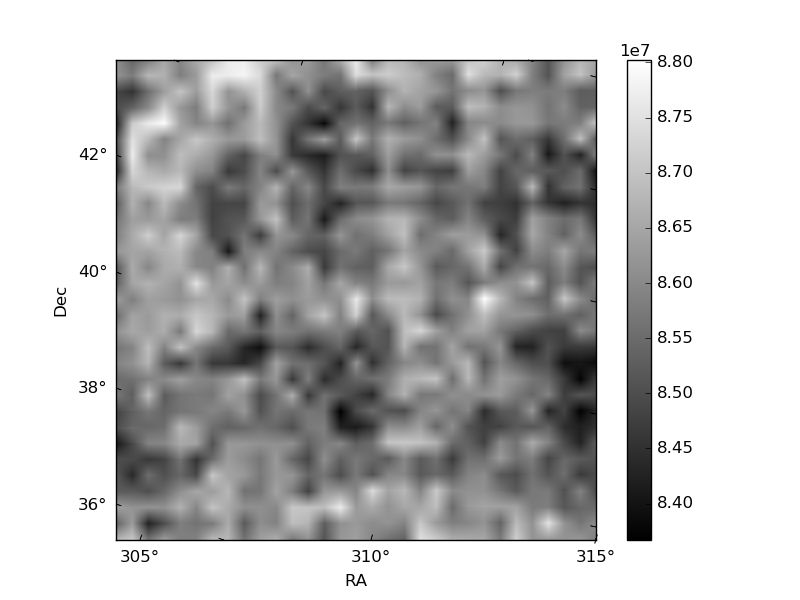
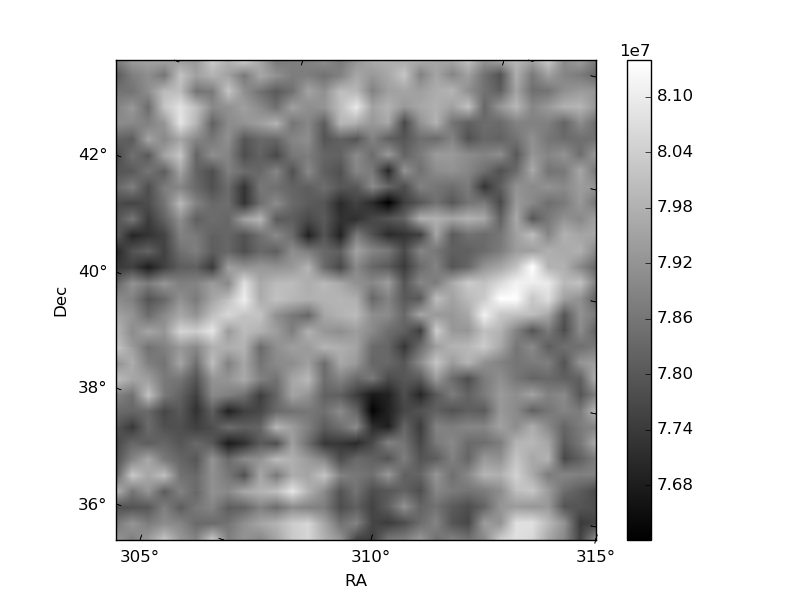
Histogram calculated using DETX and DETY for each event in the final _common_clean file
| Quadrant A | 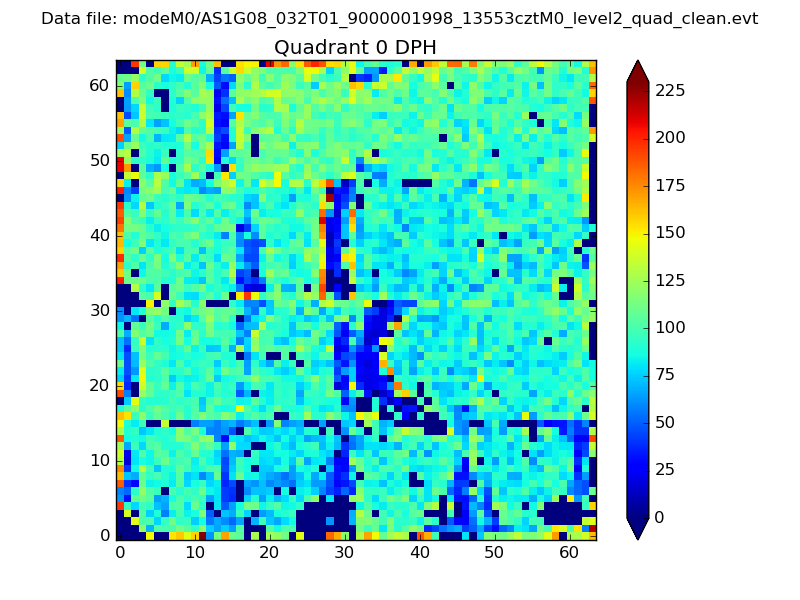 |
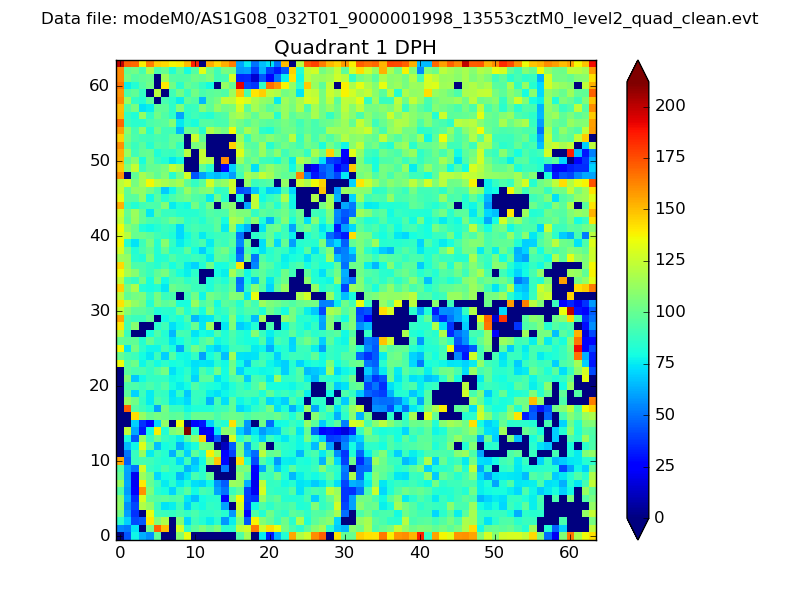 |
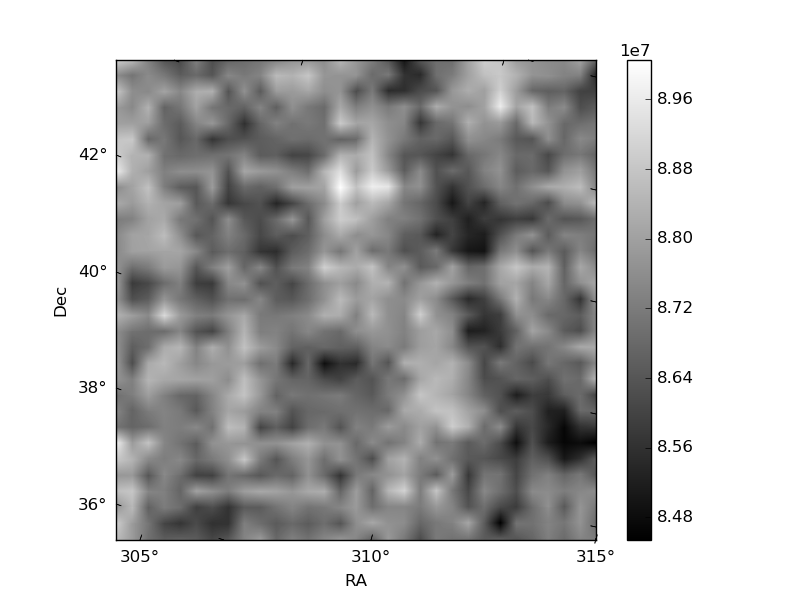
Quadrant B |
|---|---|---|---|
| Quadrant D | 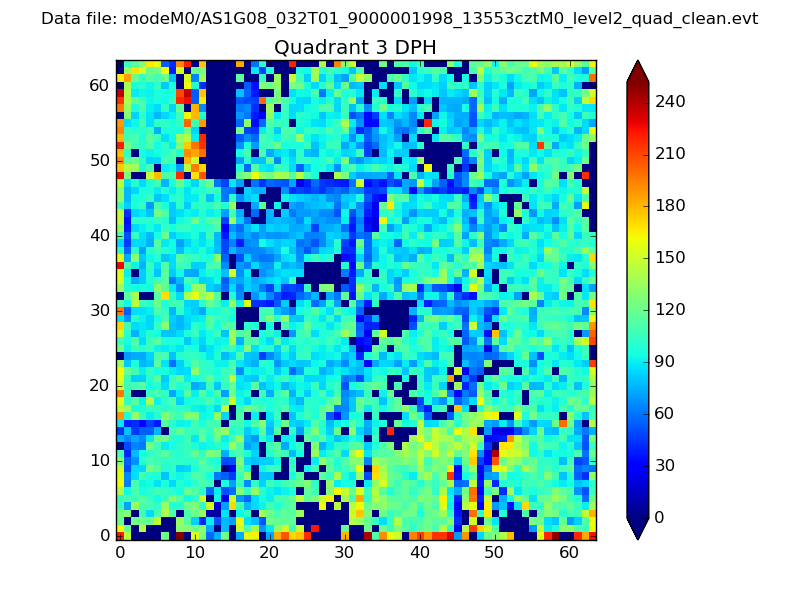 |
 |
Quadrant C |
| Plot type | Count rate plots | Images |
|---|---|---|
| Comparison with Poisson distribution Blue bars denote a histogram of data divided into 1 sec bins. Red curve is a Poisson curve with rate = median count rate of data. |
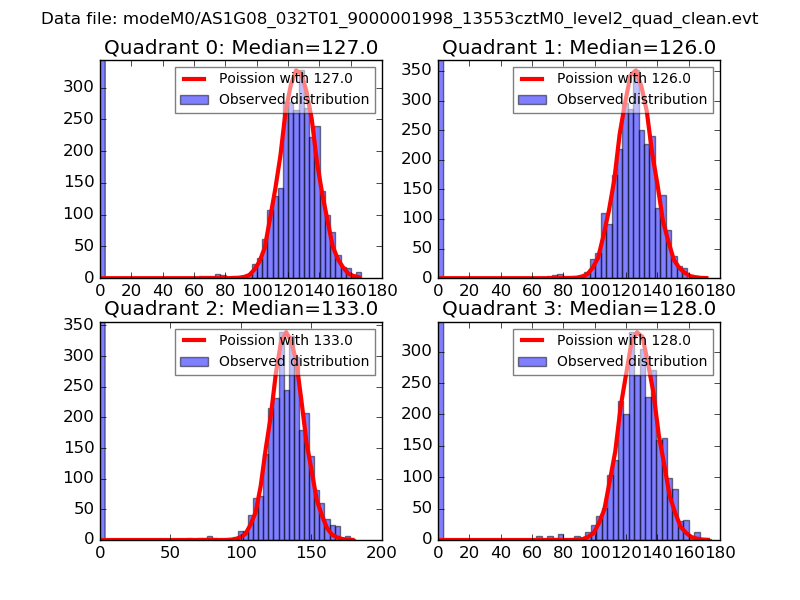 |
 |
| Quadrant-wise count rates Data is divided into 100 sec bins |
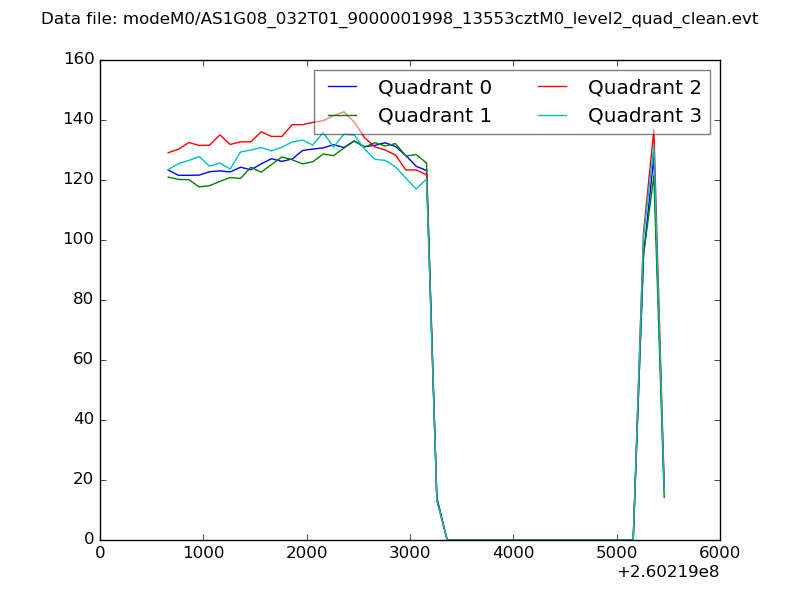 |
|
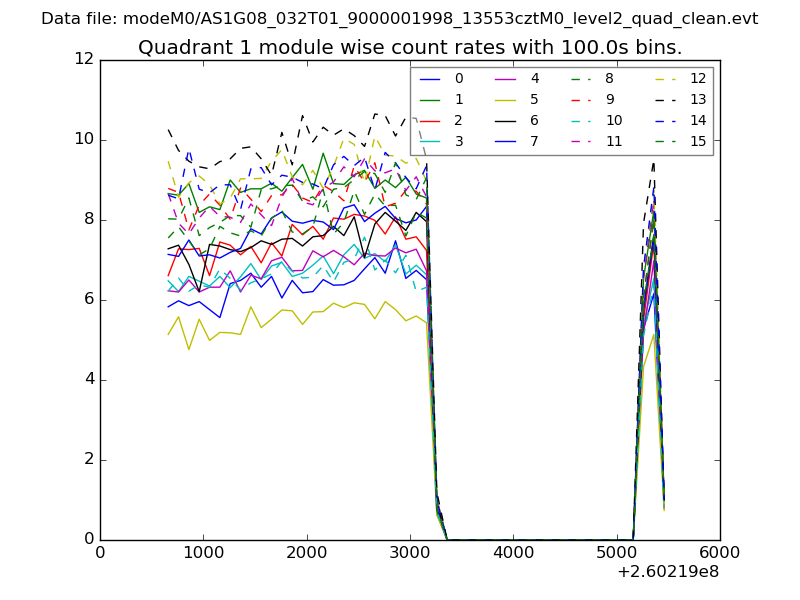
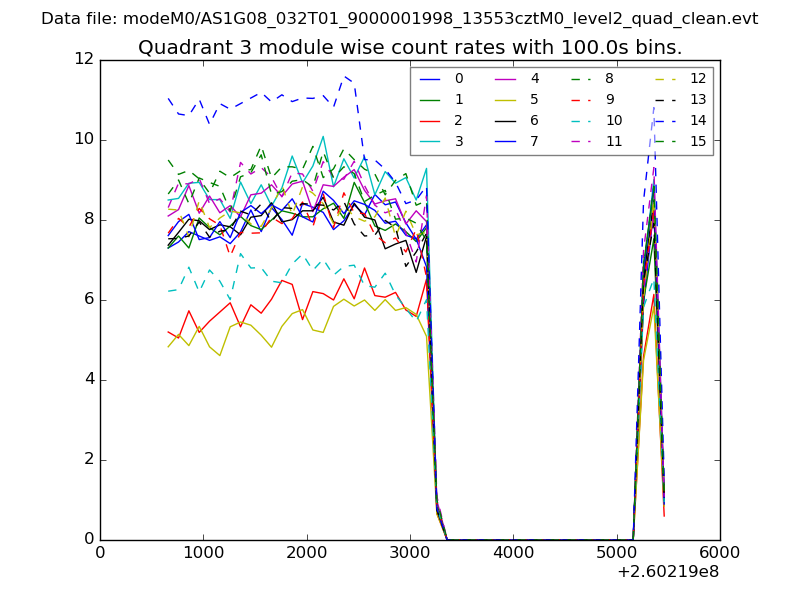
| Module-wise count rates for Quadrant A Data is divided into 100 sec bins |
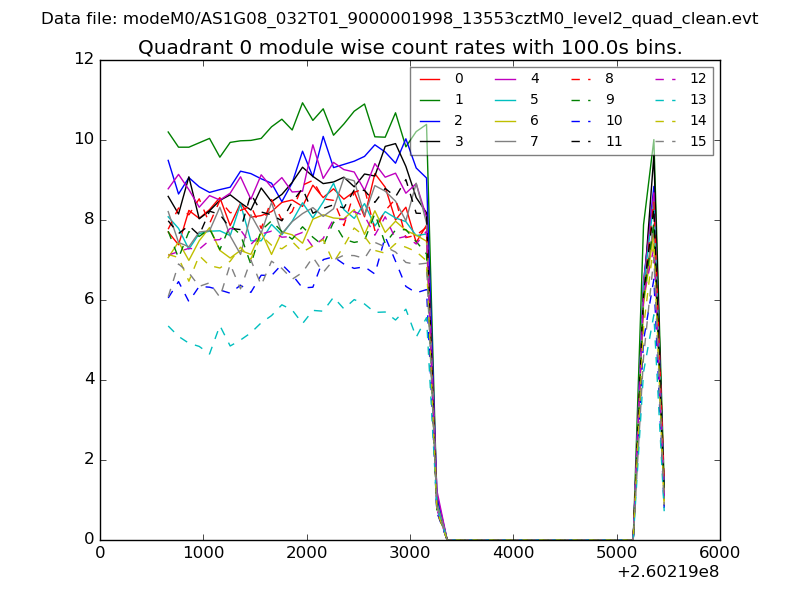 |
 |
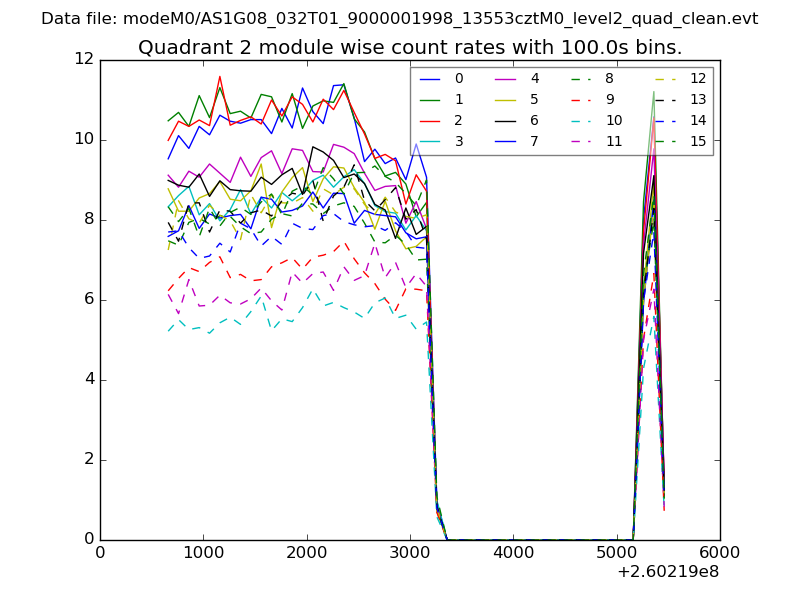
| Module-wise count rates for Quadrant B Data is divided into 100 sec bins |
 |
 |
| Module-wise count rates for Quadrant C Data is divided into 100 sec bins |
 |
 |
| Module-wise count rates for Quadrant D Data is divided into 100 sec bins |
 |
 |
| Parameter | Plot |
|---|---|
| CZT HV Monitor |  |
| D_VDD | 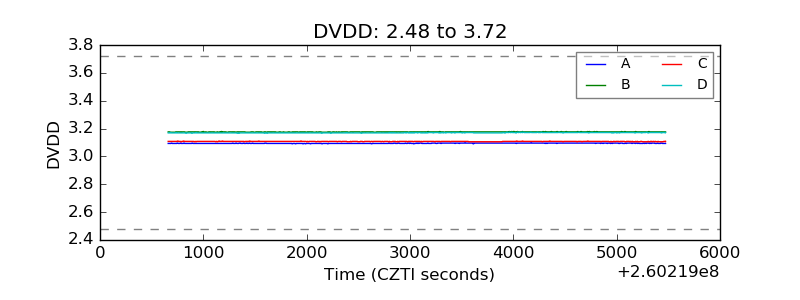 |
| Temperature 1 | 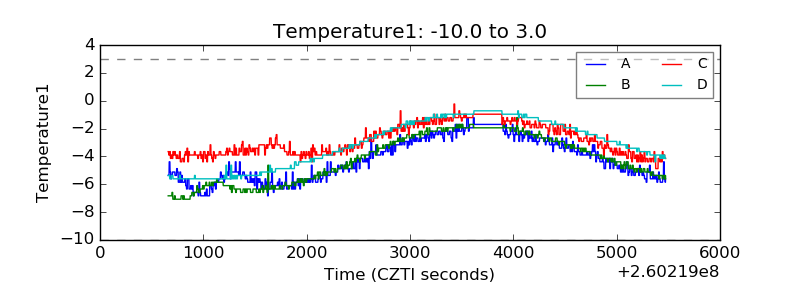 |
| Veto HV Monitor | 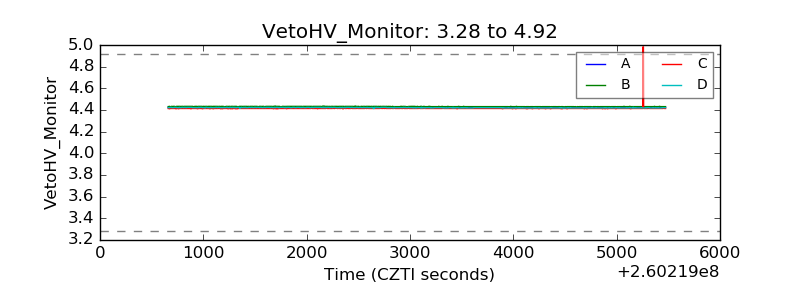 |
| Veto LLD | 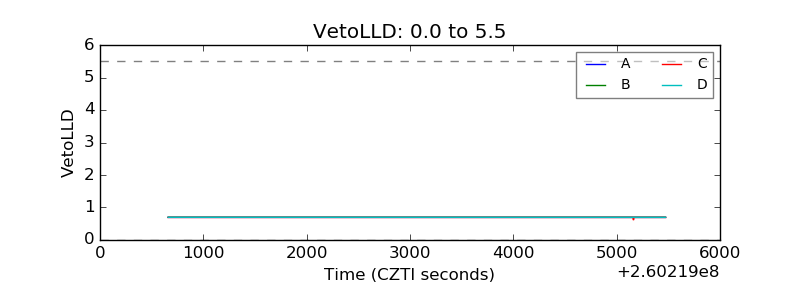 |
| Alpha Counter | 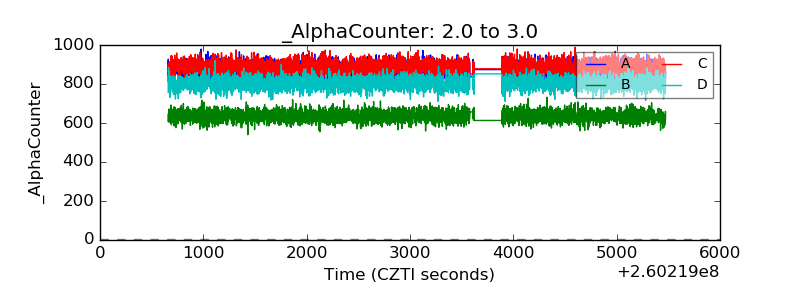 |
| _CPM_Rate | 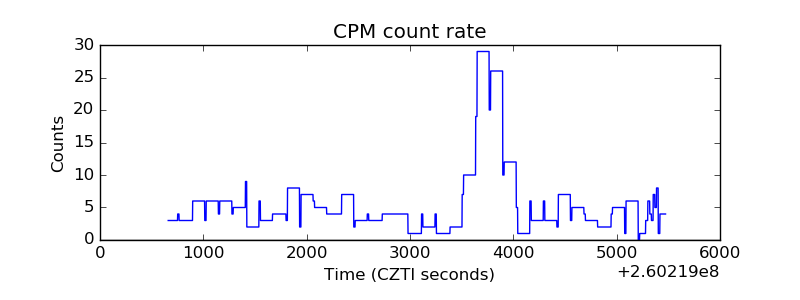 |
| CZT Counter | 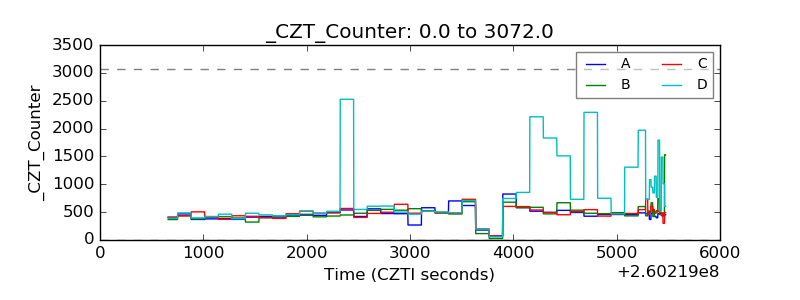 |
| +2.5 Volts monitor |  |
| +5 Volts monitor | 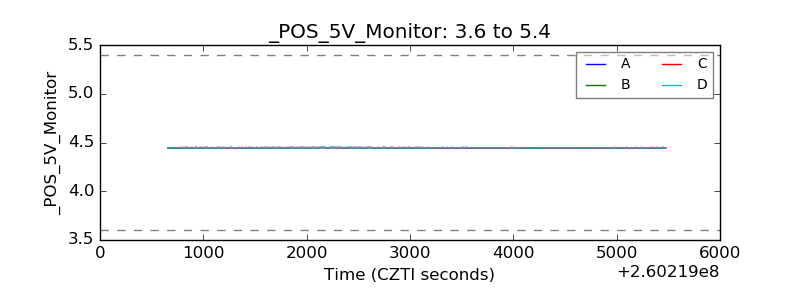 |
| _ROLL_ROT | 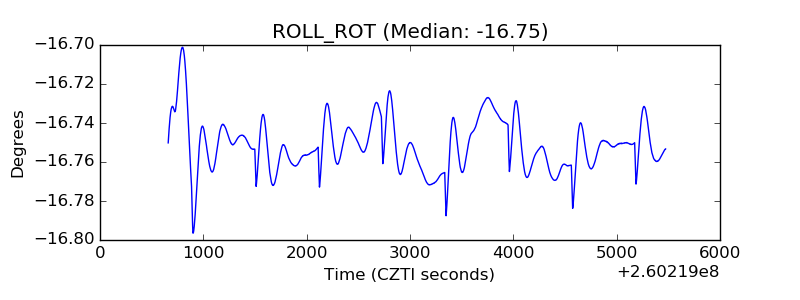 |
| _Roll_DEC | 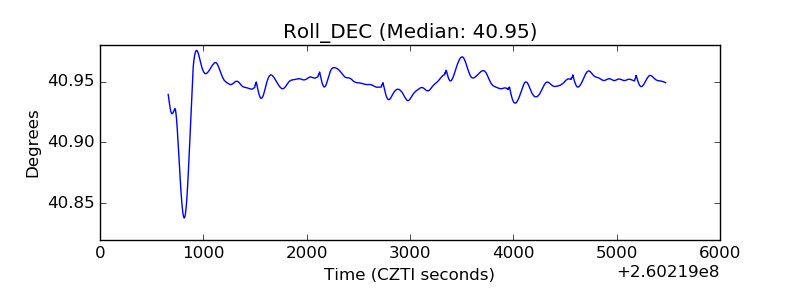 |
| _Roll_RA | 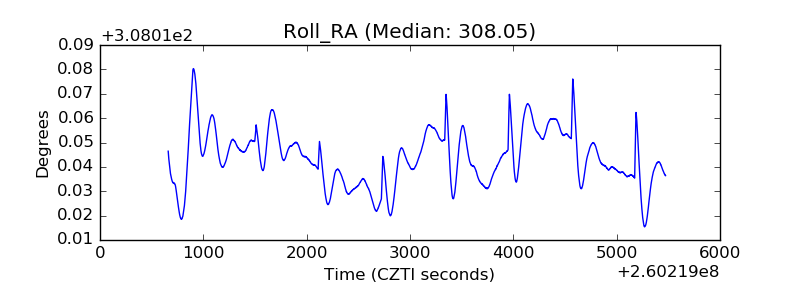 |
| Veto Counter | 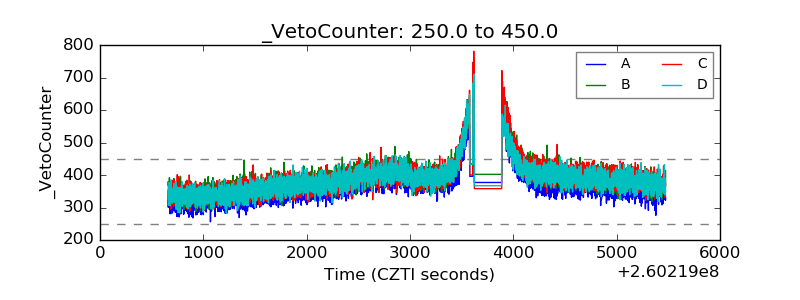 |