| Param | Original file | Final file |
|---|---|---|
| Filename | modeM0/AS1G08_032T01_9000001998_13556cztM0_level2.evt | modeM0/AS1G08_032T01_9000001998_13556cztM0_level2_quad_clean.evt |
| Size (bytes) | 1,002,562,560 | 198,325,440 |
| Size | 956.1 MB | 189.1 MB |
| Events in quadrant A | 6,562,017 | 1,228,546 |
| Events in quadrant B | 6,956,044 | 1,214,481 |
| Events in quadrant C | 6,886,738 | 1,310,281 |
| Events in quadrant D | 8,979,750 | 1,255,916 |
| Mode SS | |||
|---|---|---|---|
| Quadrant | BADHDUFLAG | Total packets | Discarded packets |
| A | 0 | 331 | 35 |
| B | 0 | 330 | 38 |
| C | 0 | 330 | 40 |
| D | 0 | 330 | 42 |
| Mode M0 | |||
|---|---|---|---|
| Quadrant | BADHDUFLAG | Total packets | Discarded packets |
| A | 0 | 33089 | 3607 |
| B | 0 | 34212 | 3759 |
| C | 0 | 33262 | 3713 |
| D | 0 | 41100 | 4215 |
| Mode M9 | |||
|---|---|---|---|
| Quadrant | BADHDUFLAG | Total packets | Discarded packets |
| A | 0 | 12 | 0 |
| B | 0 | 12 | 0 |
| C | 0 | 12 | 0 |
| D | 0 | 12 | 0 |
| Quadrant | Total seconds | Saturated seconds | Saturation percentage |
|---|---|---|---|
| A | 14473 | 59 | 0.407656% |
| B | 14473 | 103 | 0.711670% |
| C | 14443 | 51 | 0.353112% |
| D | 14427 | 466 | 3.230055% |
Noise dominated data is calculated using 1-second bins in cleaned event files. If a bin has >2000 counts, and if more than 50% of those come from <1% of pixels, then it is considered to be noise-dominated and hence unusable.
| Quadrant | # 1 sec bins | Bins with >0 counts | Bins with >2000 counts | High rate bins dominated by noise | Noise dominated (total time) | Noise dominated (detector-on time) | Marked lightcurve |
|---|---|---|---|---|---|---|---|
| A | 17466 | 14796 | 0 | 0 | 0.00% | 0.00% | 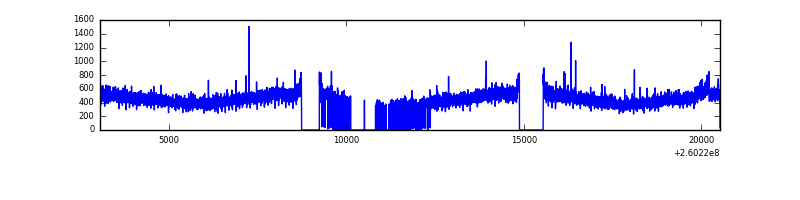 |
| B | 17466 | 14784 | 23 | 23 | 0.13% | 0.16% | 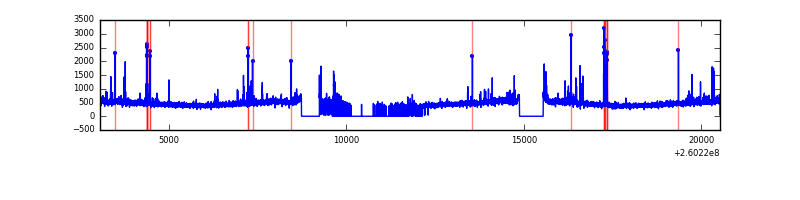 |
| C | 17466 | 14751 | 1 | 1 | 0.01% | 0.01% | 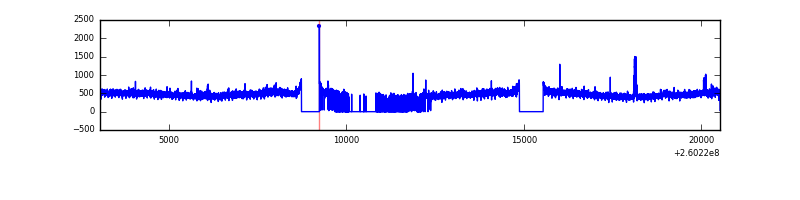 |
| D | 17466 | 14753 | 321 | 321 | 1.84% | 2.18% | 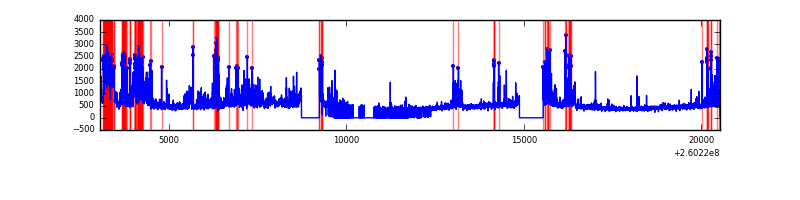 |
Top three noisy pixels from each quadrant. If the there are fewer than three noisy pixels in the level2.evt file, extra rows are filled as -1
| Pixel properties | Quadrant properties | ||||||
|---|---|---|---|---|---|---|---|
| Quadrant | DetID | PixID | Counts | Sigma | Mean | Median | Sigma |
| A | 14 | 238 | 39422 | 110.52 | 1685 | 1646 | 341.8 |
| A | 1 | 162 | 27969 | 77.01 | 1685 | 1646 | 341.8 |
| A | 0 | 226 | 15206 | 39.67 | 1685 | 1646 | 341.8 |
| B | 3 | 64 | 173281 | 545.89 | 1669 | 1631 | 314.4 |
| B | 3 | 209 | 94516 | 295.4 | 1669 | 1631 | 314.4 |
| B | 4 | 142 | 41841 | 127.88 | 1669 | 1631 | 314.4 |
| C | 3 | 233 | 365796 | 960.26 | 1656 | 1668 | 379.2 |
| C | 7 | 238 | 32368 | 80.96 | 1656 | 1668 | 379.2 |
| C | 13 | 61 | 11868 | 26.9 | 1656 | 1668 | 379.2 |
| D | 13 | 122 | 1649632 | 4179.11 | 1640 | 1597 | 394.4 |
| D | 5 | 222 | 304882 | 769.07 | 1640 | 1597 | 394.4 |
| D | 8 | 195 | 292074 | 736.6 | 1640 | 1597 | 394.4 |
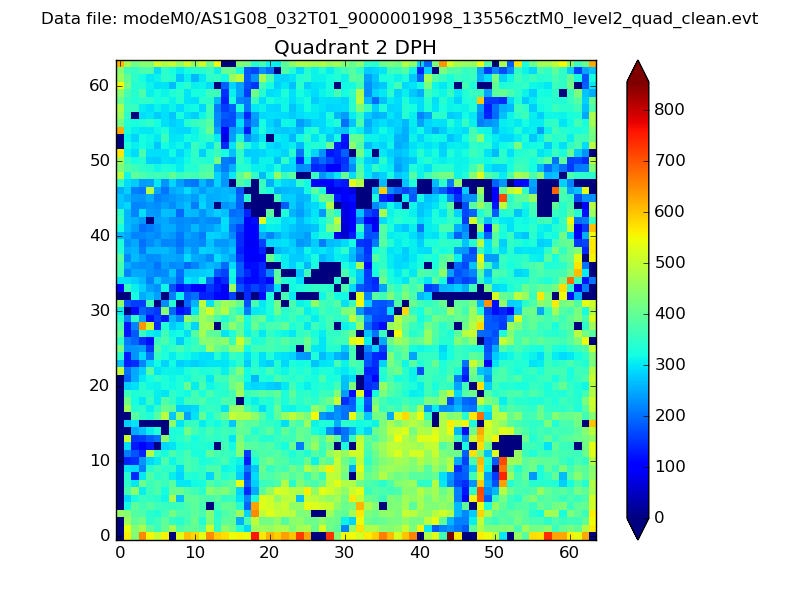
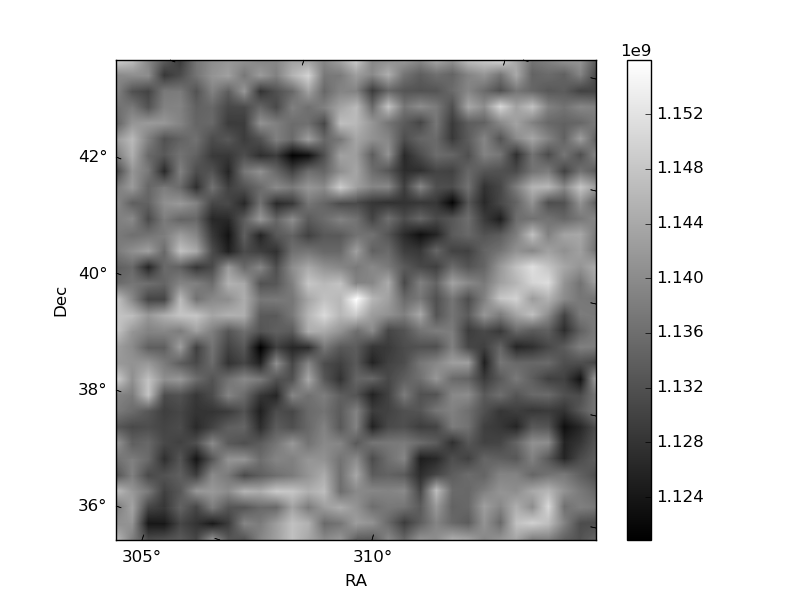
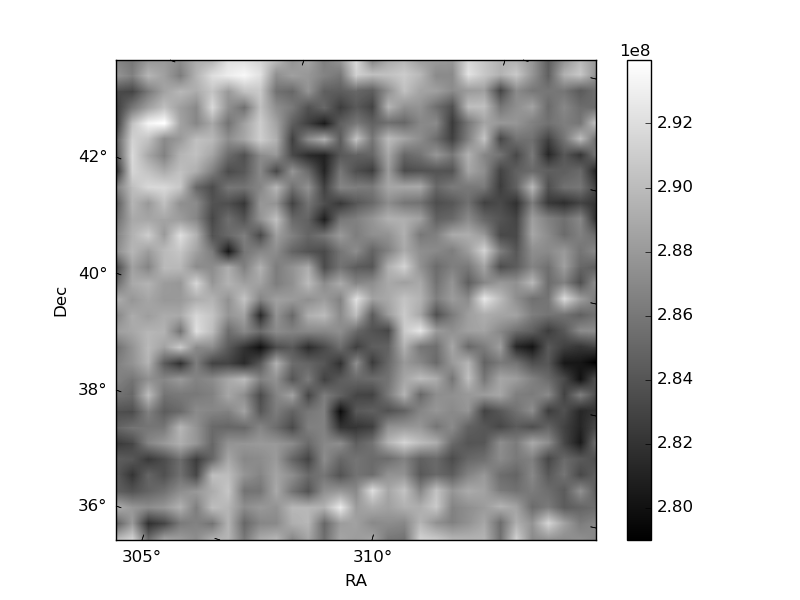
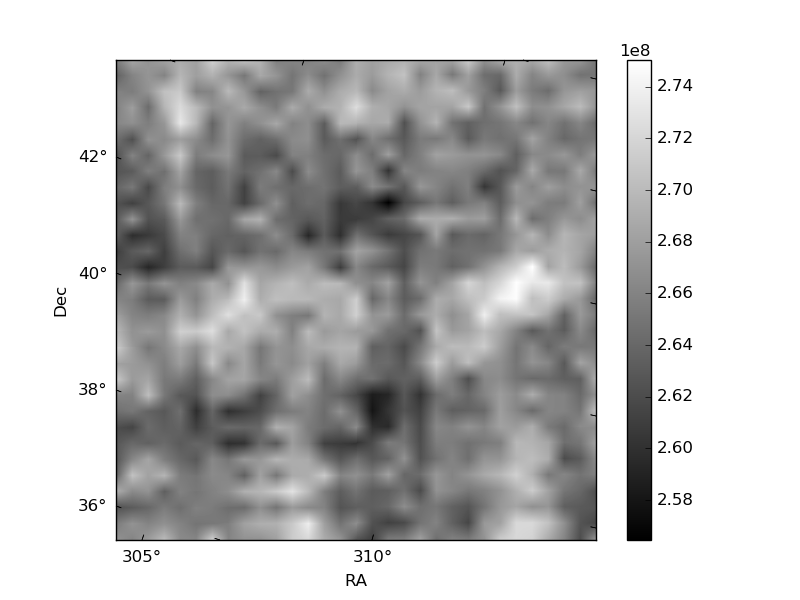
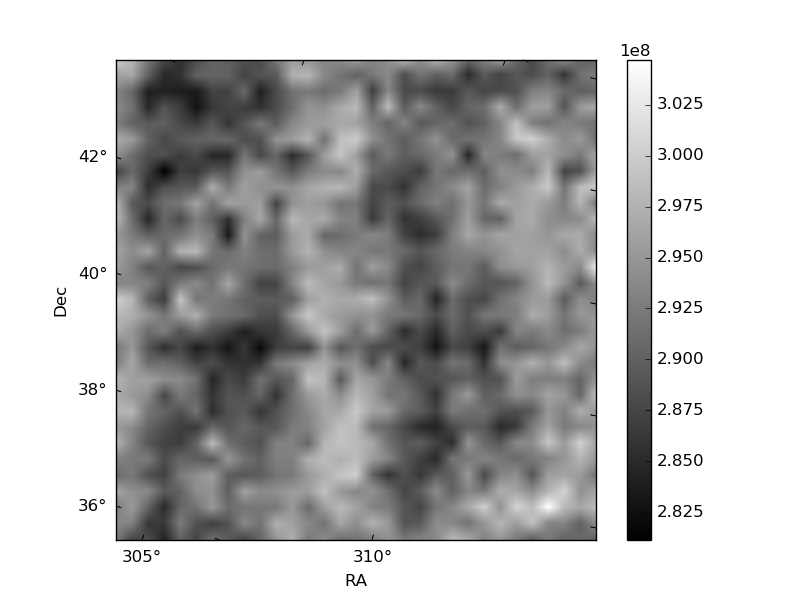
Histogram calculated using DETX and DETY for each event in the final _common_clean file
| Quadrant A | 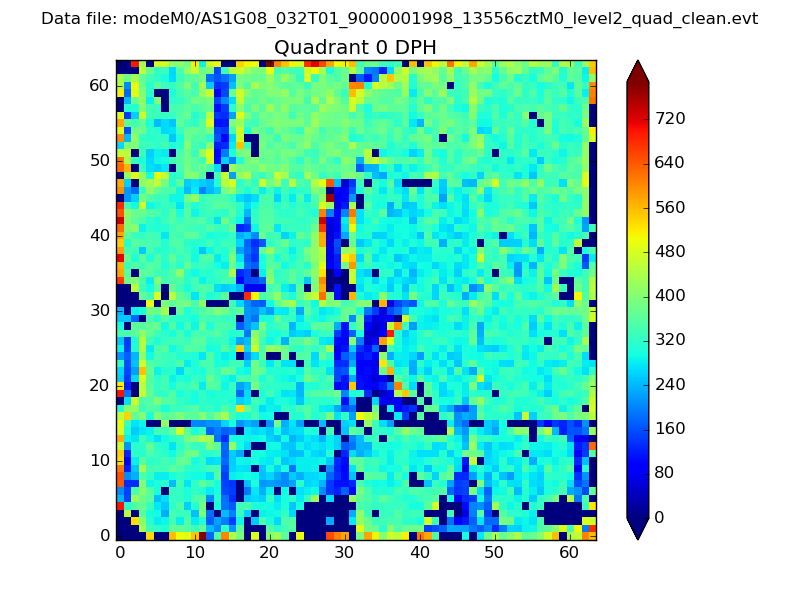 |
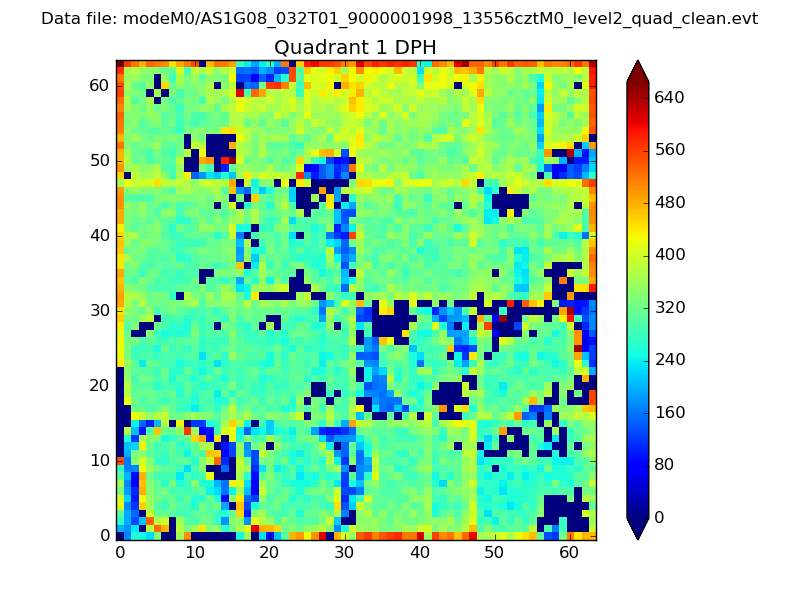 |
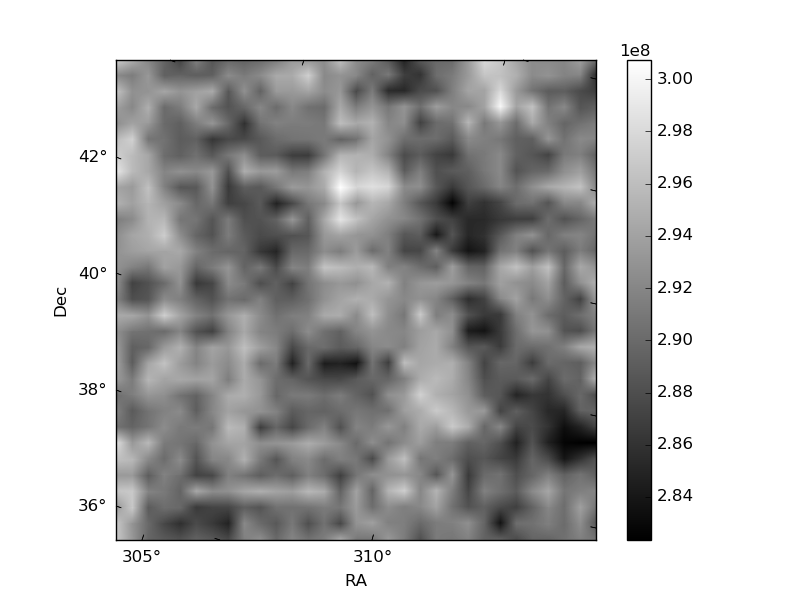
Quadrant B |
|---|---|---|---|
| Quadrant D | 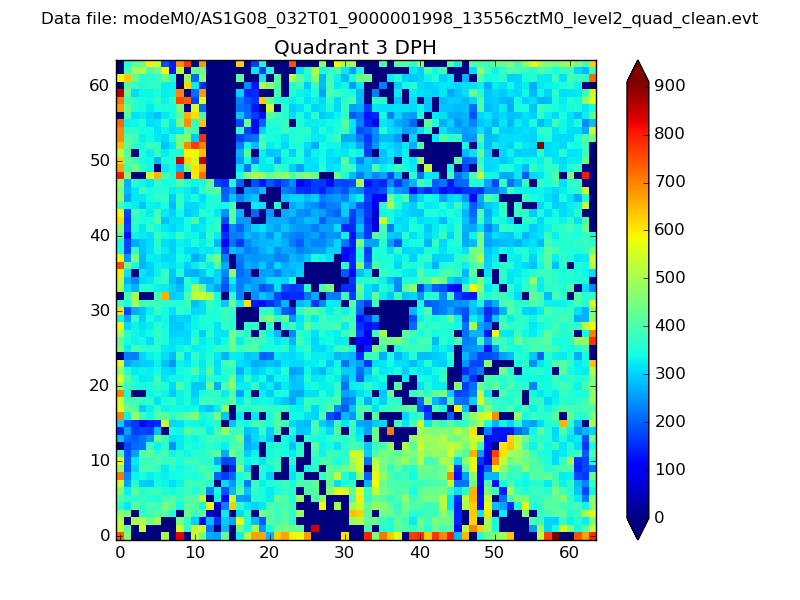 |
 |
Quadrant C |
| Plot type | Count rate plots | Images |
|---|---|---|
| Comparison with Poisson distribution Blue bars denote a histogram of data divided into 1 sec bins. Red curve is a Poisson curve with rate = median count rate of data. |
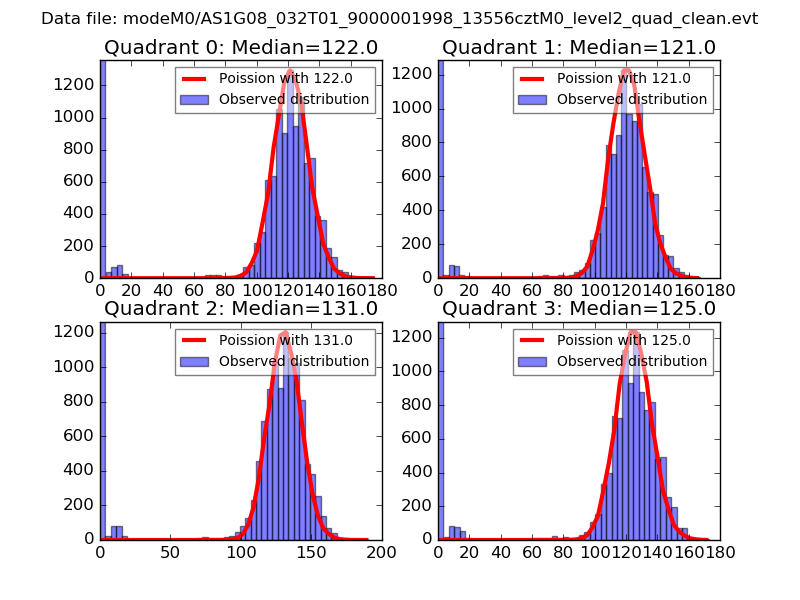 |
 |
| Quadrant-wise count rates Data is divided into 100 sec bins |
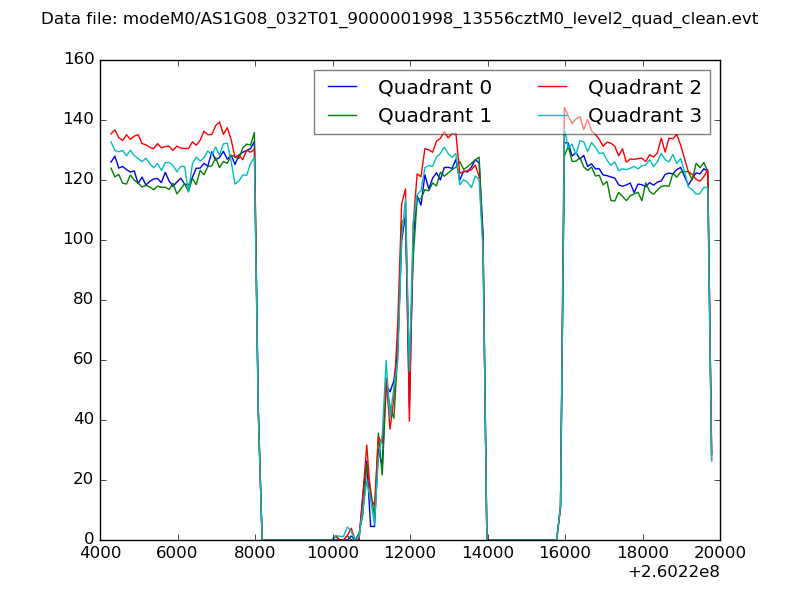 |
|
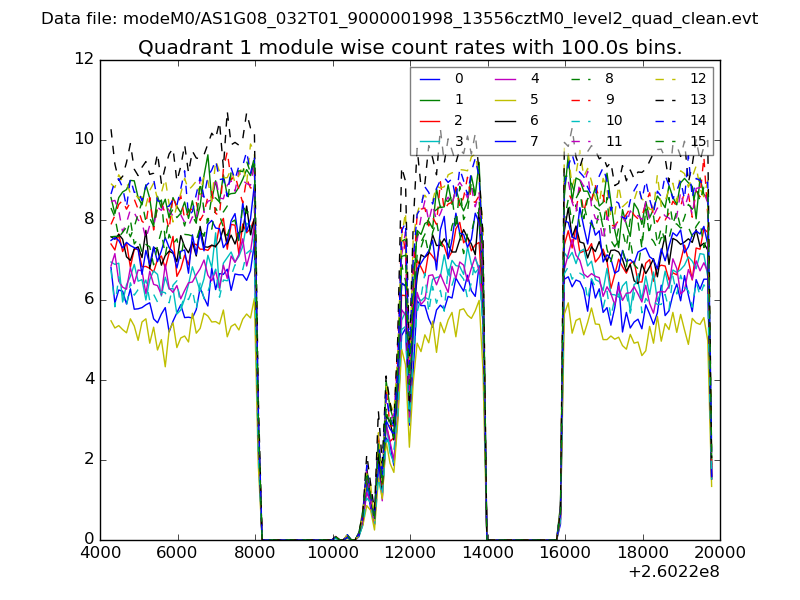
| Module-wise count rates for Quadrant A Data is divided into 100 sec bins |
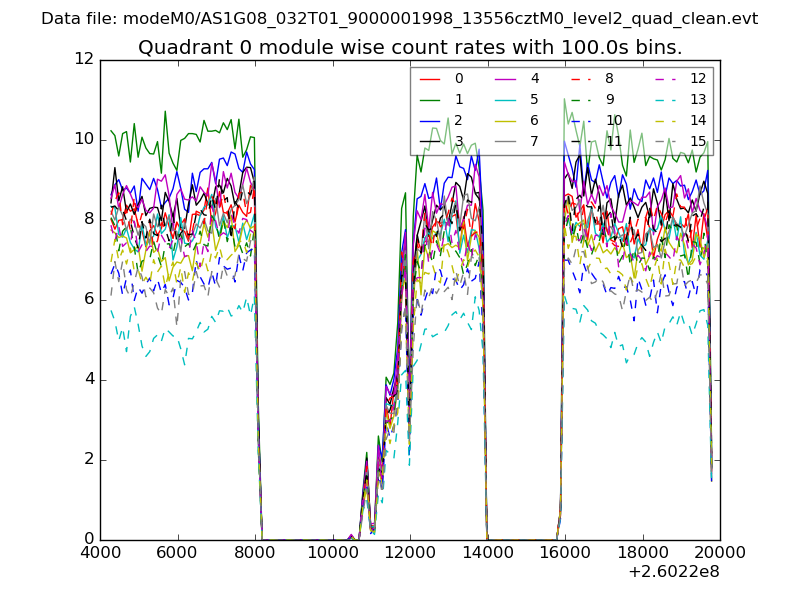 |
 |
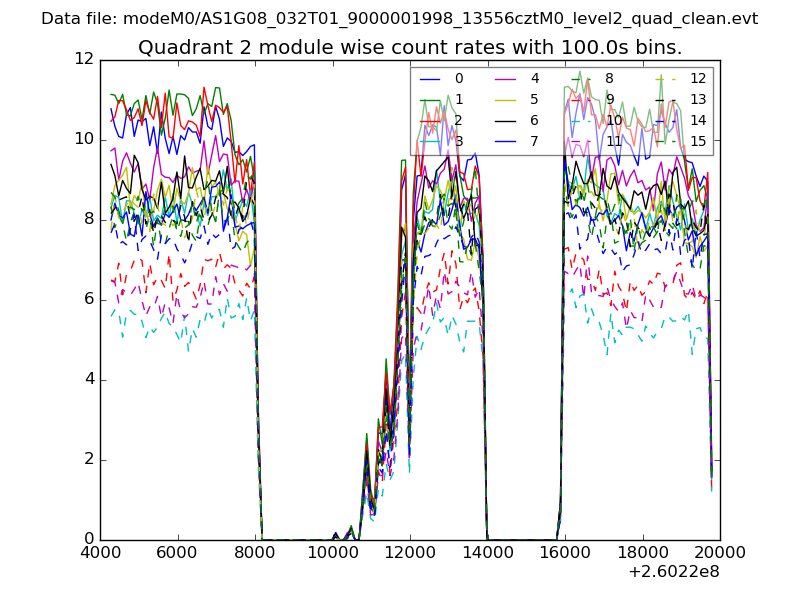
| Module-wise count rates for Quadrant B Data is divided into 100 sec bins |
 |
 |
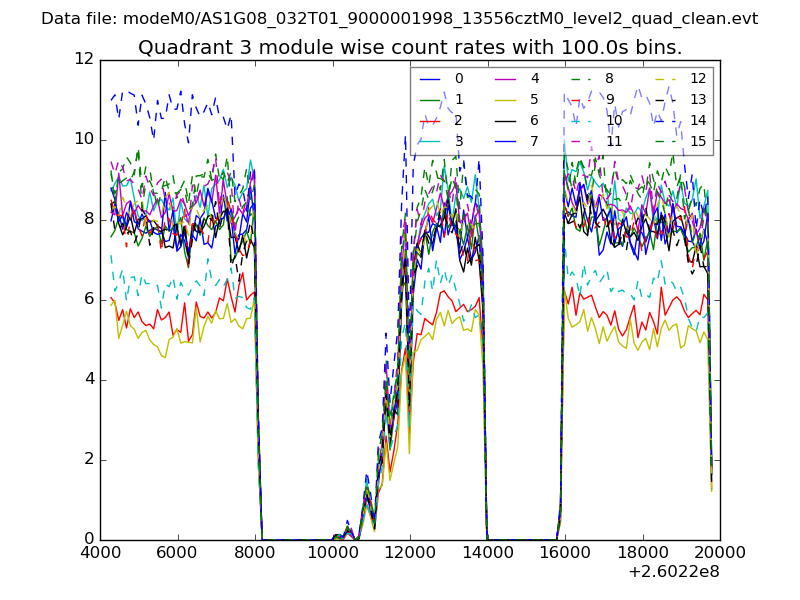
| Module-wise count rates for Quadrant C Data is divided into 100 sec bins |
 |
 |
| Module-wise count rates for Quadrant D Data is divided into 100 sec bins |
 |
 |
| Parameter | Plot |
|---|---|
| CZT HV Monitor | 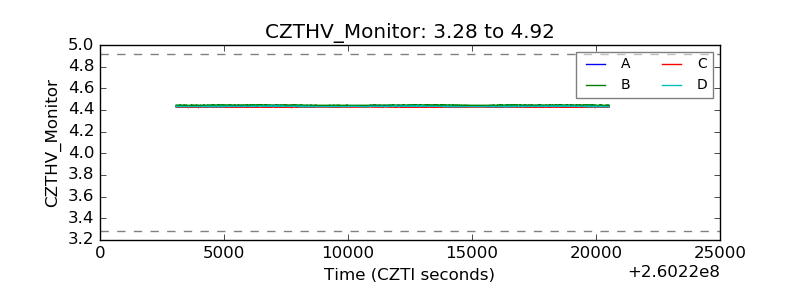 |
| D_VDD | 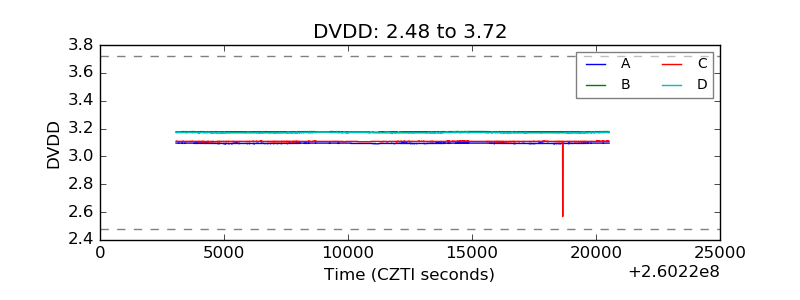 |
| Temperature 1 | 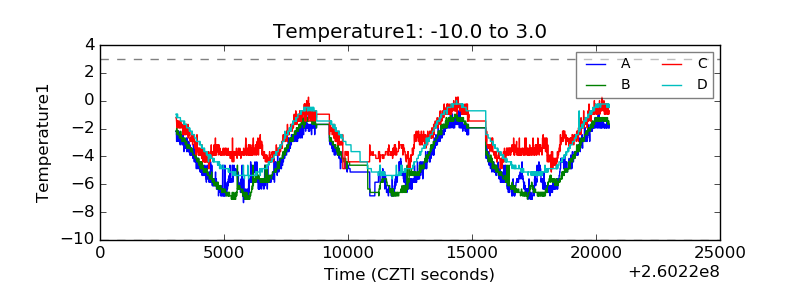 |
| Veto HV Monitor | 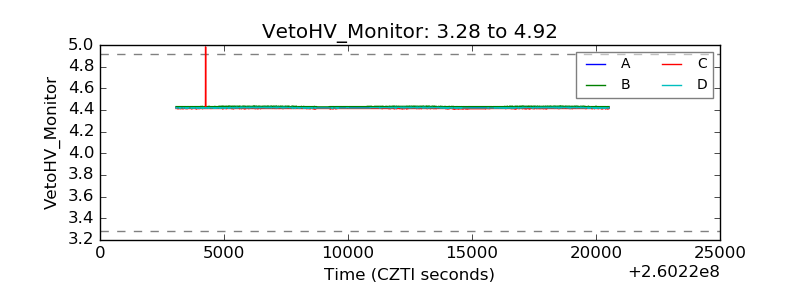 |
| Veto LLD | 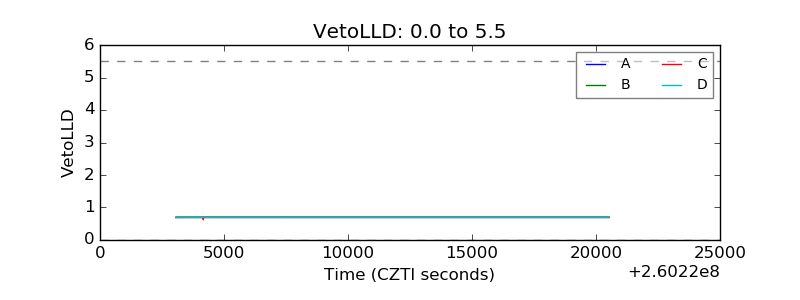 |
| Alpha Counter | 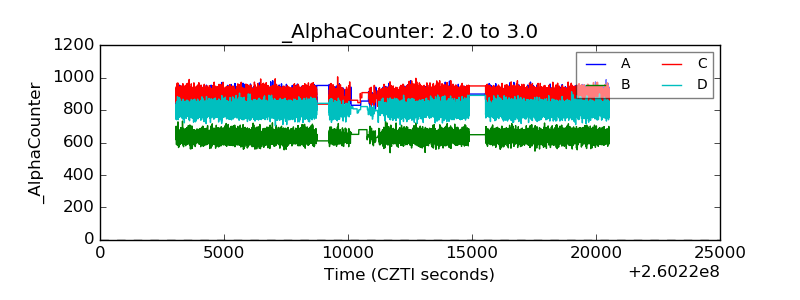 |
| _CPM_Rate | 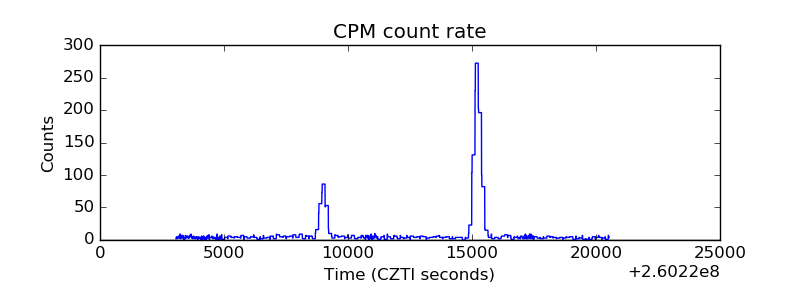 |
| CZT Counter | 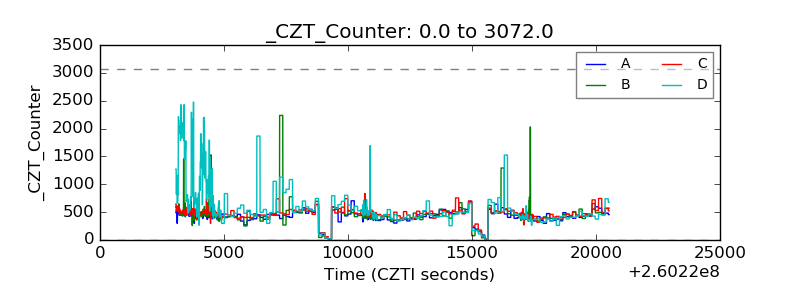 |
| +2.5 Volts monitor |  |
| +5 Volts monitor |  |
| _ROLL_ROT | 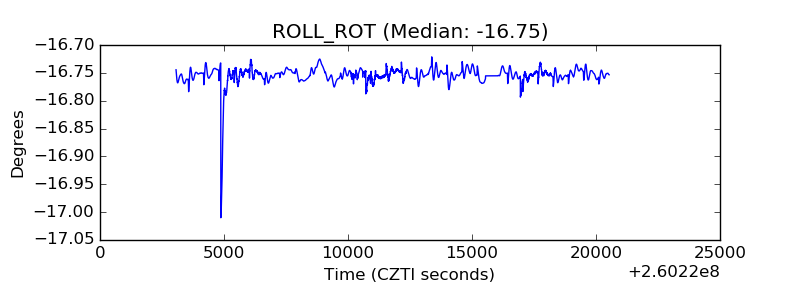 |
| _Roll_DEC | 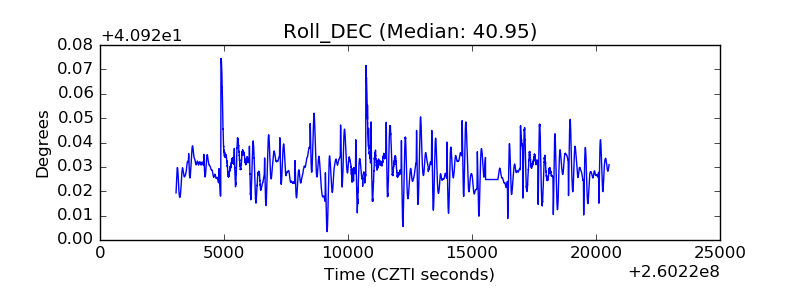 |
| _Roll_RA | 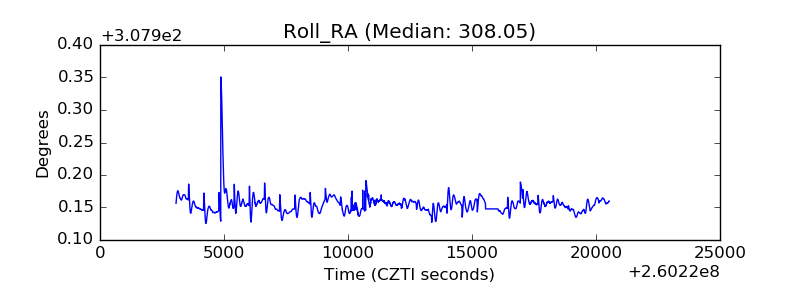 |
| Veto Counter | 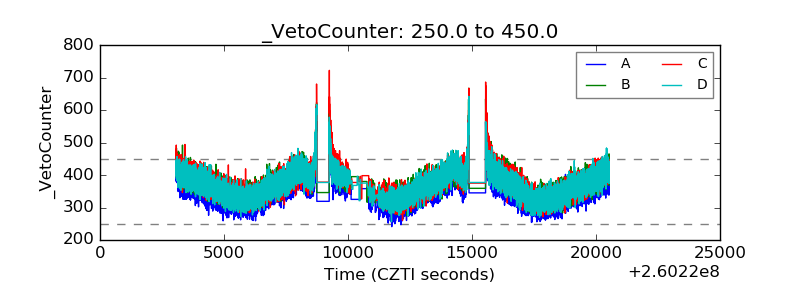 |