| Param | Original file | Final file |
|---|---|---|
| Filename | modeM0/AS1G08_032T01_9000001998_13557cztM0_level2.evt | modeM0/AS1G08_032T01_9000001998_13557cztM0_level2_quad_clean.evt |
| Size (bytes) | 768,905,280 | 154,860,480 |
| Size | 733.3 MB | 147.7 MB |
| Events in quadrant A | 4,963,407 | 971,947 |
| Events in quadrant B | 5,286,303 | 964,861 |
| Events in quadrant C | 5,121,117 | 1,040,566 |
| Events in quadrant D | 7,184,308 | 965,421 |
| Mode SS | |||
|---|---|---|---|
| Quadrant | BADHDUFLAG | Total packets | Discarded packets |
| A | 0 | 220 | 0 |
| B | 0 | 220 | 0 |
| C | 0 | 220 | 0 |
| D | 0 | 220 | 0 |
| Mode M0 | |||
|---|---|---|---|
| Quadrant | BADHDUFLAG | Total packets | Discarded packets |
| A | 0 | 22194 | 3 |
| B | 0 | 23039 | 2 |
| C | 0 | 22113 | 2 |
| D | 0 | 28928 | 2 |
| Mode M9 | |||
|---|---|---|---|
| Quadrant | BADHDUFLAG | Total packets | Discarded packets |
| A | 0 | 13 | 0 |
| B | 0 | 13 | 0 |
| C | 0 | 13 | 0 |
| D | 0 | 13 | 0 |
| Quadrant | Total seconds | Saturated seconds | Saturation percentage |
|---|---|---|---|
| A | 10795 | 49 | 0.453914% |
| B | 10795 | 106 | 0.981936% |
| C | 10795 | 40 | 0.370542% |
| D | 10795 | 475 | 4.400185% |
Noise dominated data is calculated using 1-second bins in cleaned event files. If a bin has >2000 counts, and if more than 50% of those come from <1% of pixels, then it is considered to be noise-dominated and hence unusable.
| Quadrant | # 1 sec bins | Bins with >0 counts | Bins with >2000 counts | High rate bins dominated by noise | Noise dominated (total time) | Noise dominated (detector-on time) | Marked lightcurve |
|---|---|---|---|---|---|---|---|
| A | 22002 | 10799 | 0 | 0 | 0.00% | 0.00% | 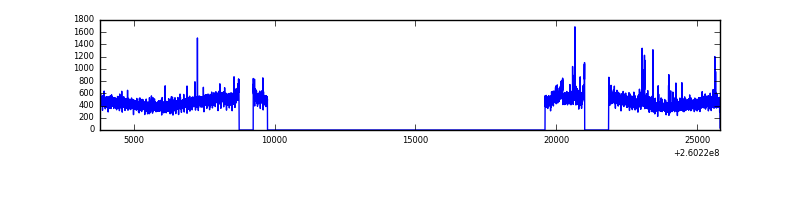 |
| B | 22002 | 10797 | 34 | 34 | 0.15% | 0.31% | 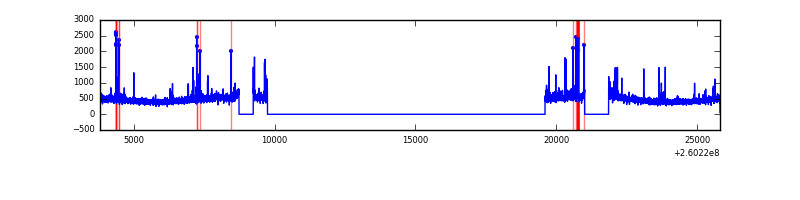 |
| C | 22002 | 10797 | 1 | 1 | 0.00% | 0.01% | 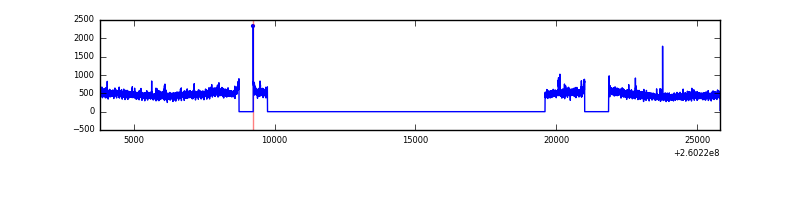 |
| D | 22002 | 10798 | 371 | 371 | 1.69% | 3.44% | 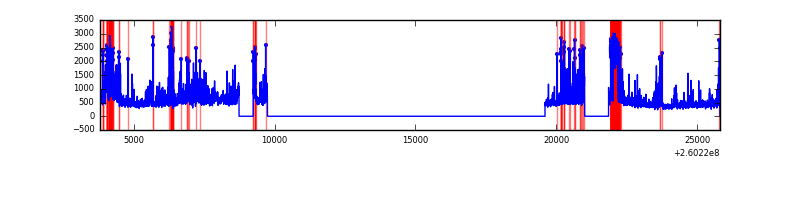 |
Top three noisy pixels from each quadrant. If the there are fewer than three noisy pixels in the level2.evt file, extra rows are filled as -1
| Pixel properties | Quadrant properties | ||||||
|---|---|---|---|---|---|---|---|
| Quadrant | DetID | PixID | Counts | Sigma | Mean | Median | Sigma |
| A | 14 | 238 | 86269 | 332.03 | 1260 | 1234 | 256.1 |
| A | 1 | 162 | 16735 | 60.53 | 1260 | 1234 | 256.1 |
| A | 4 | 2 | 11660 | 40.71 | 1260 | 1234 | 256.1 |
| B | 4 | 142 | 107403 | 448.6 | 1247 | 1215 | 236.7 |
| B | 3 | 64 | 100527 | 419.55 | 1247 | 1215 | 236.7 |
| B | 3 | 209 | 66170 | 274.41 | 1247 | 1215 | 236.7 |
| C | 3 | 233 | 251430 | 880.33 | 1241 | 1252 | 284.2 |
| C | 13 | 61 | 8935 | 27.03 | 1241 | 1252 | 284.2 |
| C | 7 | 237 | 6707 | 19.2 | 1241 | 1252 | 284.2 |
| D | 13 | 122 | 967401 | 3294.43 | 1215 | 1182 | 293.3 |
| D | 5 | 222 | 703793 | 2395.63 | 1215 | 1182 | 293.3 |
| D | 8 | 195 | 261742 | 888.41 | 1215 | 1182 | 293.3 |
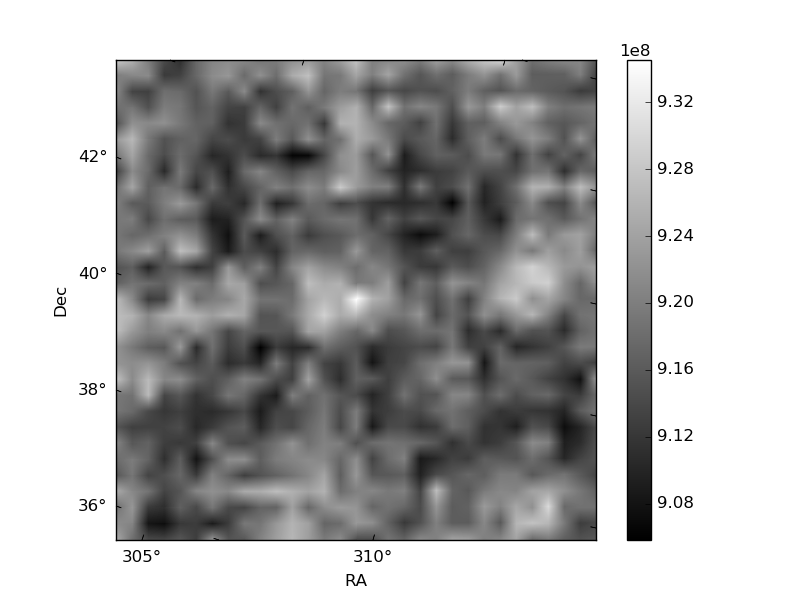
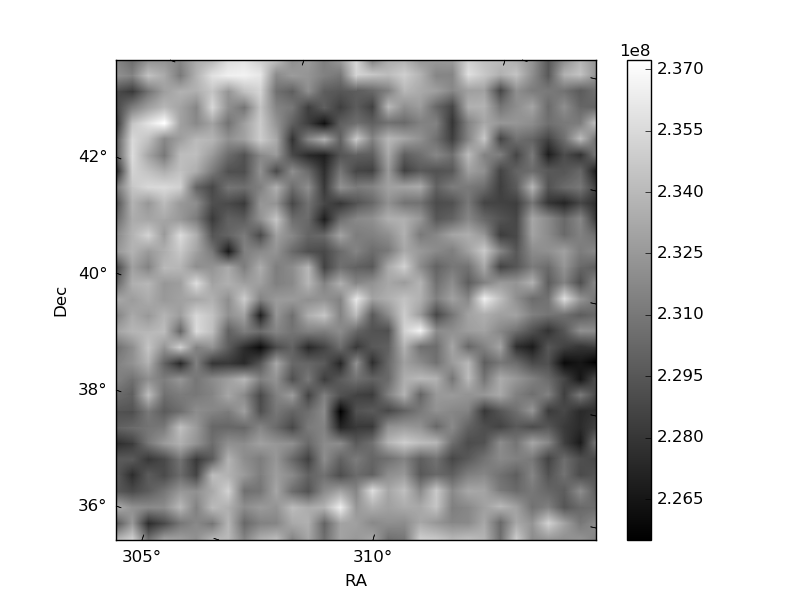
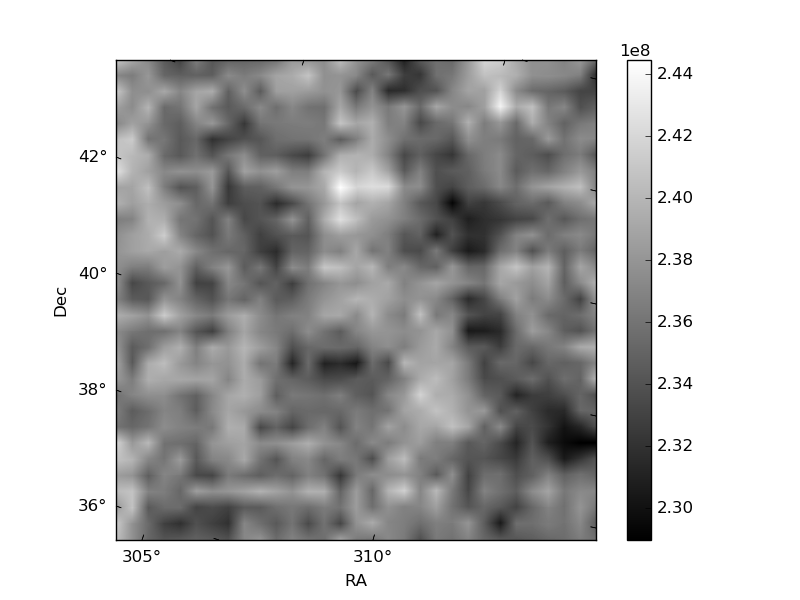
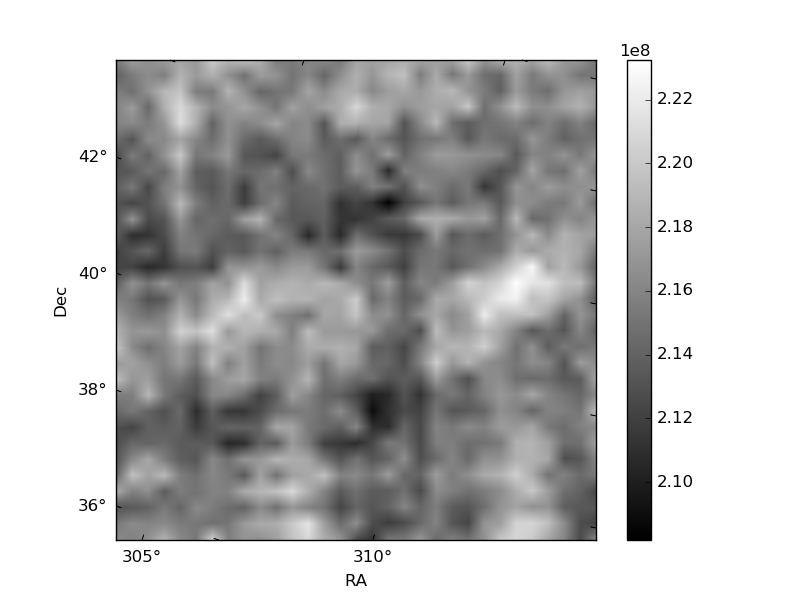
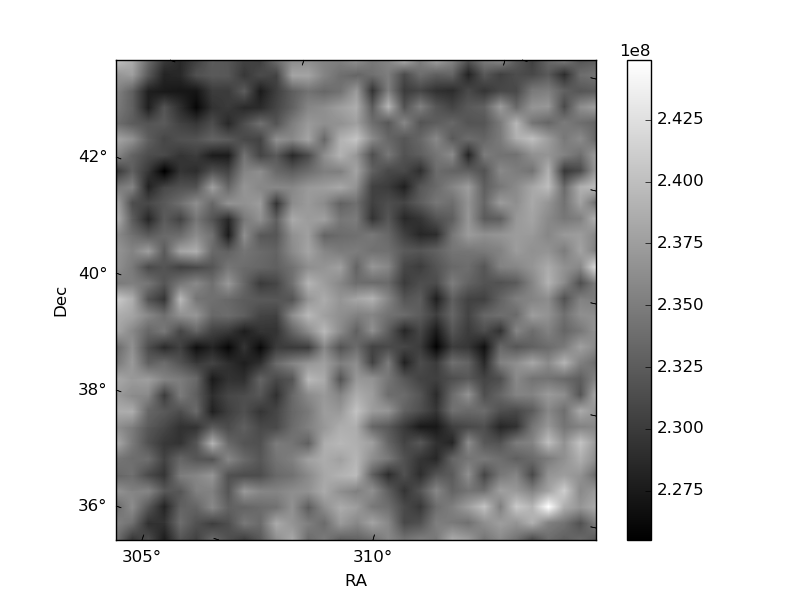
Histogram calculated using DETX and DETY for each event in the final _common_clean file
| Quadrant A | 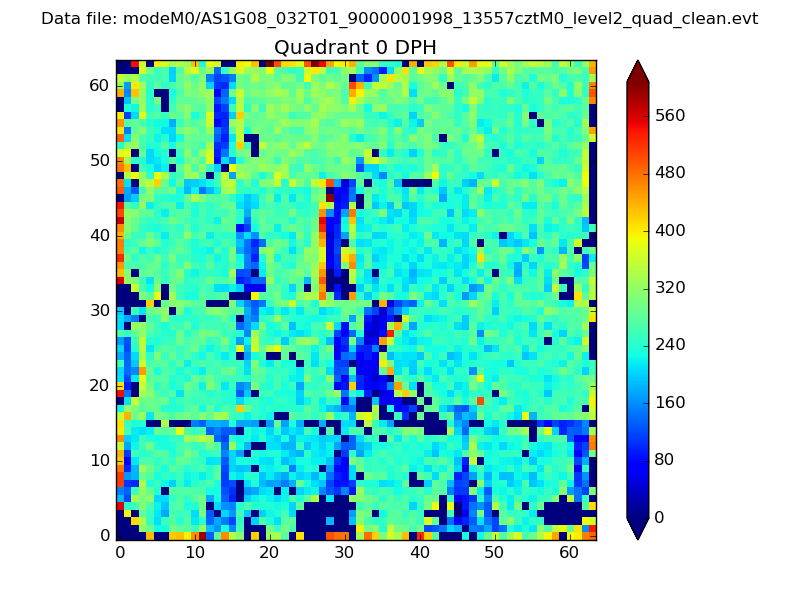 |
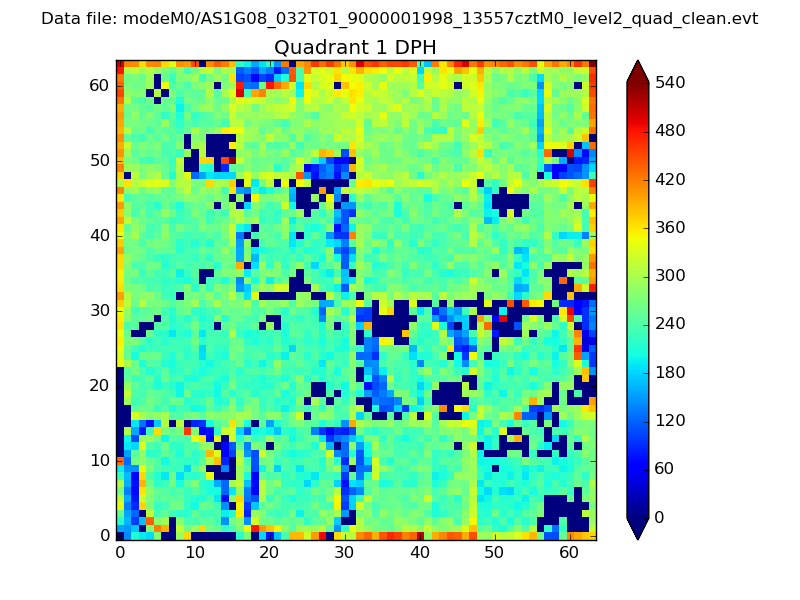 |
Quadrant B |
|---|---|---|---|
| Quadrant D | 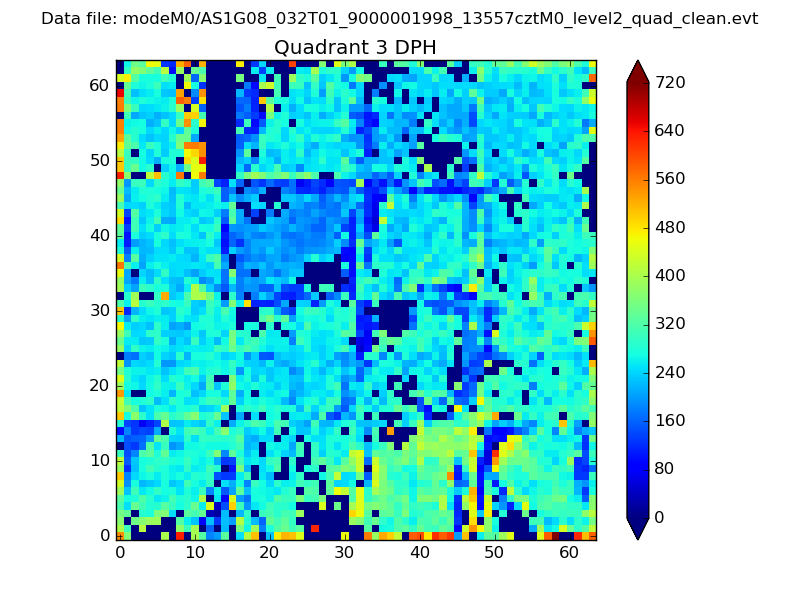 |
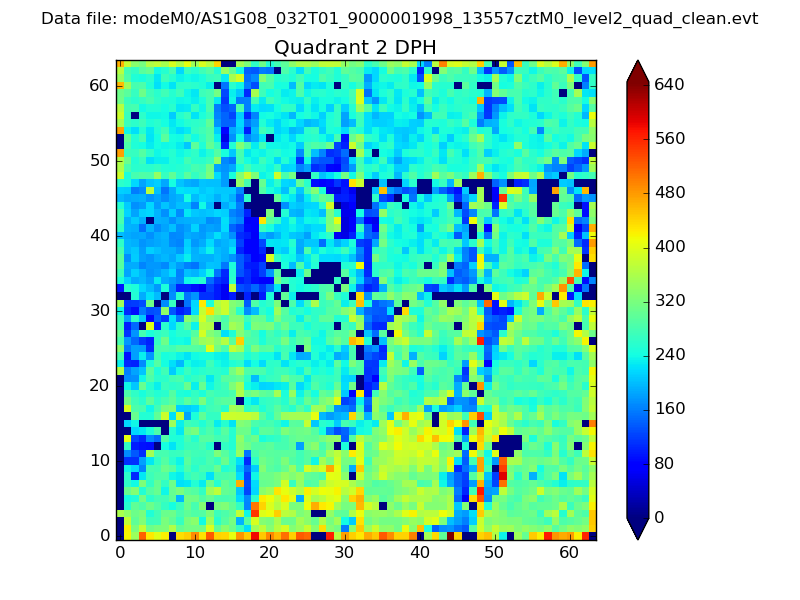 |
Quadrant C |
| Plot type | Count rate plots | Images |
|---|---|---|
| Comparison with Poisson distribution Blue bars denote a histogram of data divided into 1 sec bins. Red curve is a Poisson curve with rate = median count rate of data. |
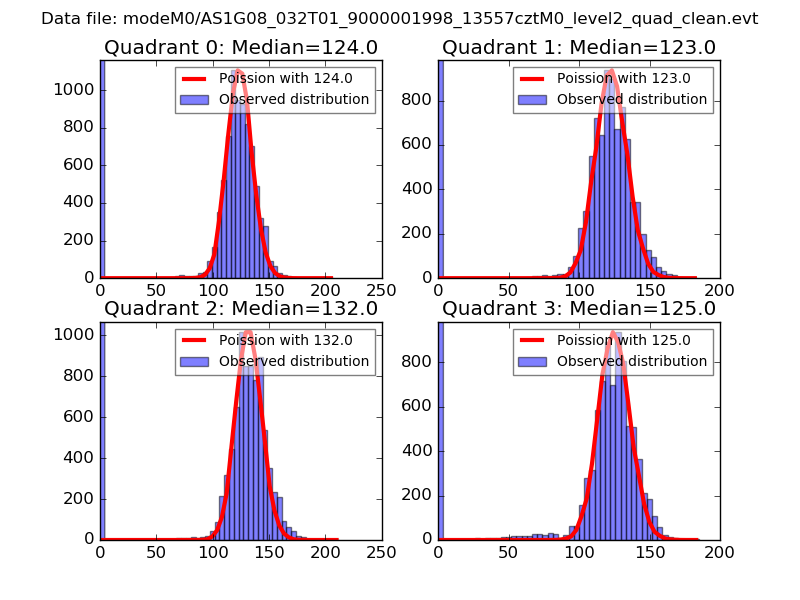 |
 |
| Quadrant-wise count rates Data is divided into 100 sec bins |
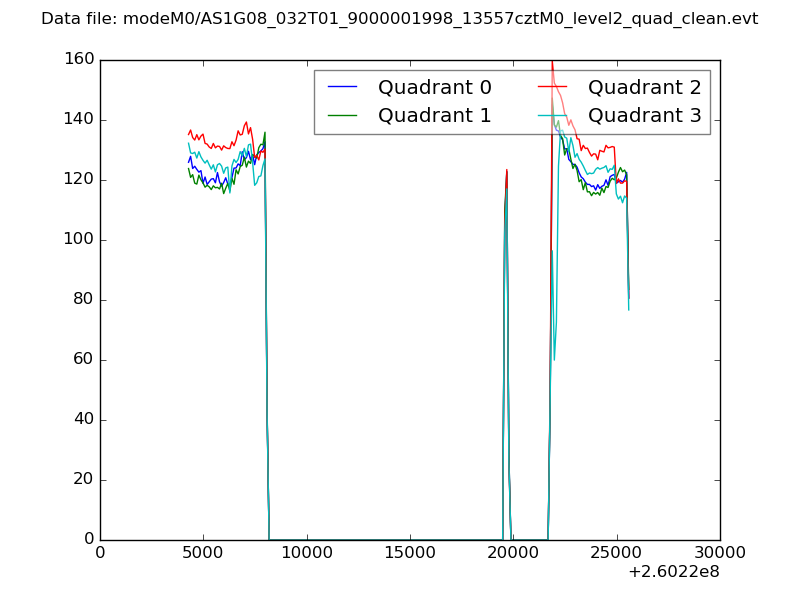 |
|
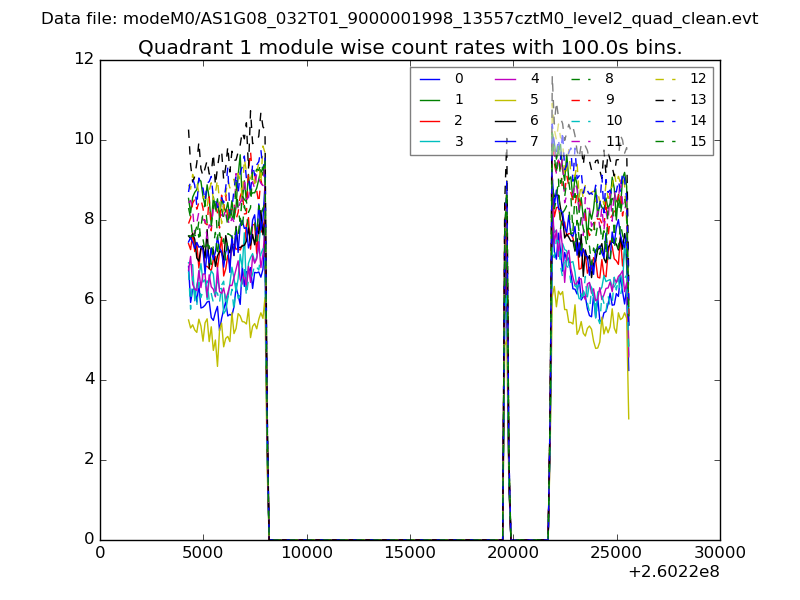
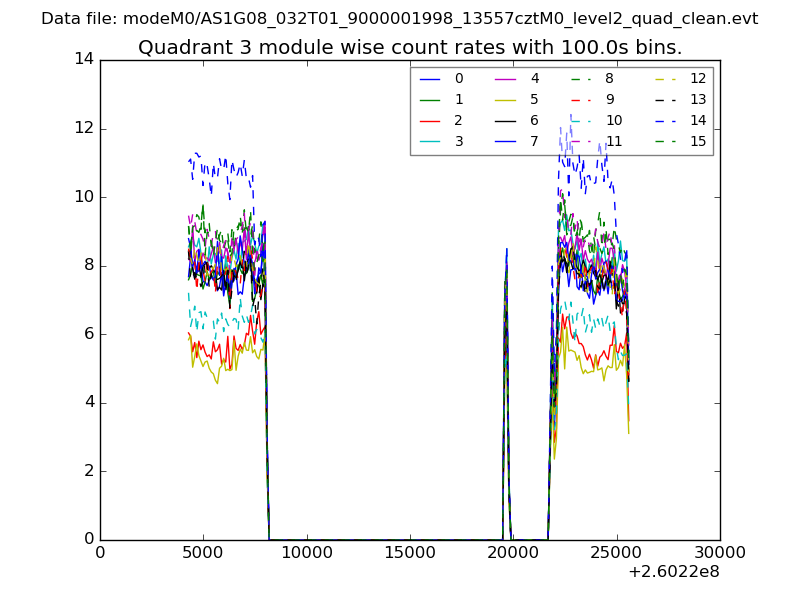
| Module-wise count rates for Quadrant A Data is divided into 100 sec bins |
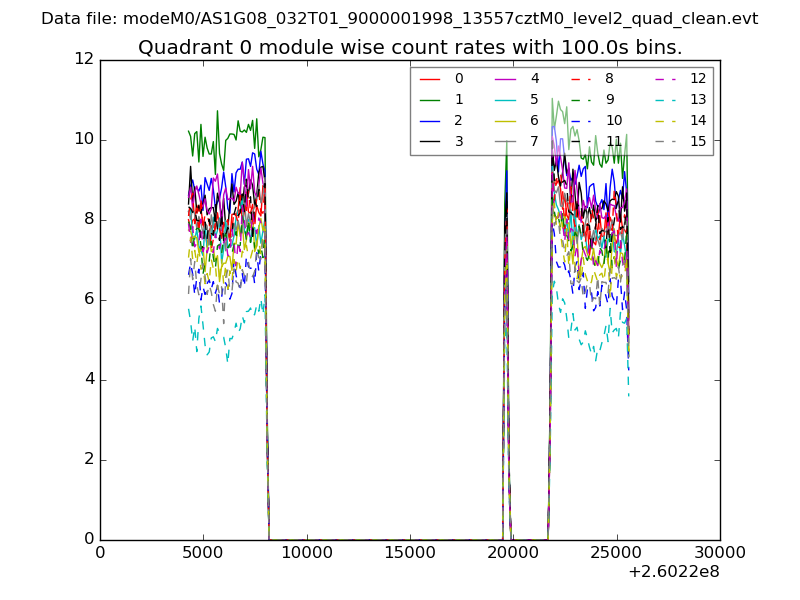 |
 |
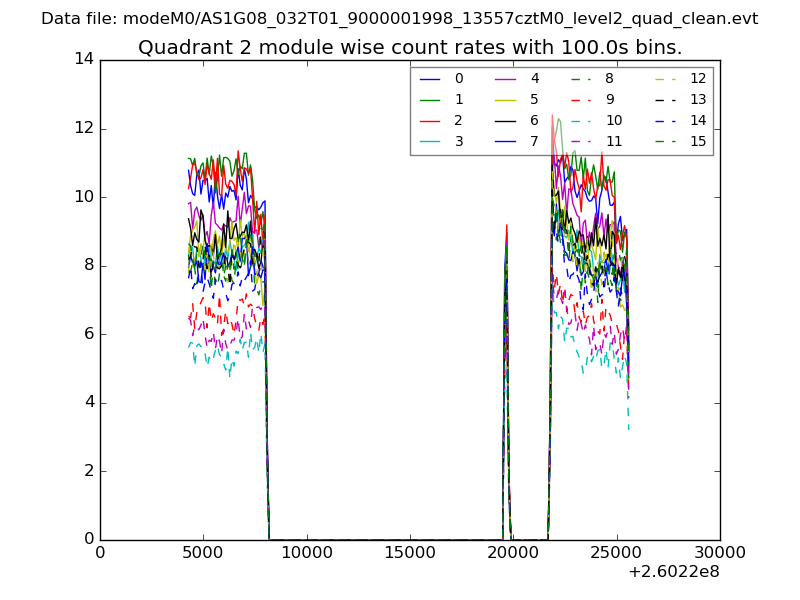
| Module-wise count rates for Quadrant B Data is divided into 100 sec bins |
 |
 |
| Module-wise count rates for Quadrant C Data is divided into 100 sec bins |
 |
 |
| Module-wise count rates for Quadrant D Data is divided into 100 sec bins |
 |
 |
| Parameter | Plot |
|---|---|
| CZT HV Monitor | 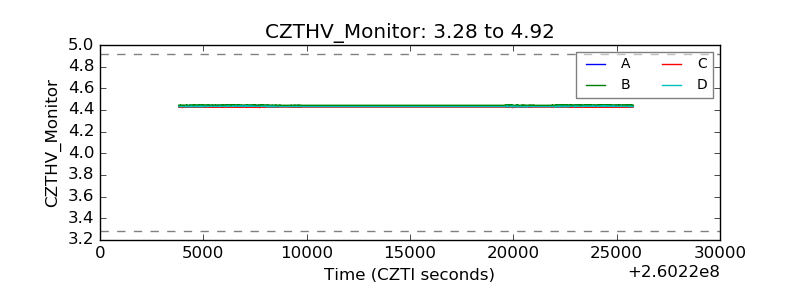 |
| D_VDD | 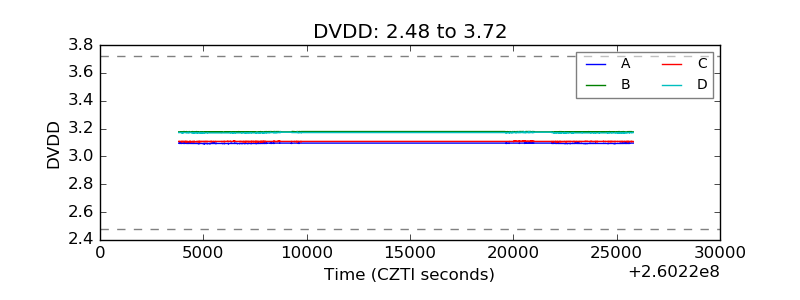 |
| Temperature 1 | 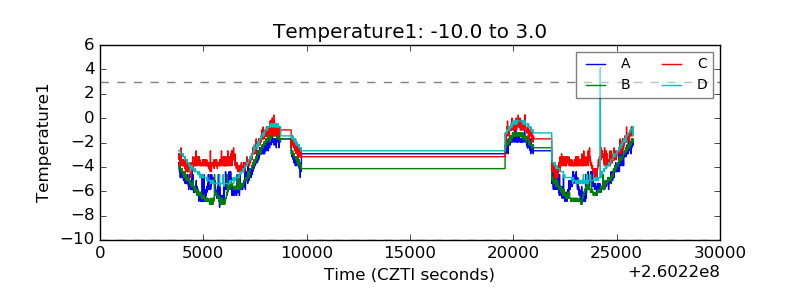 |
| Veto HV Monitor | 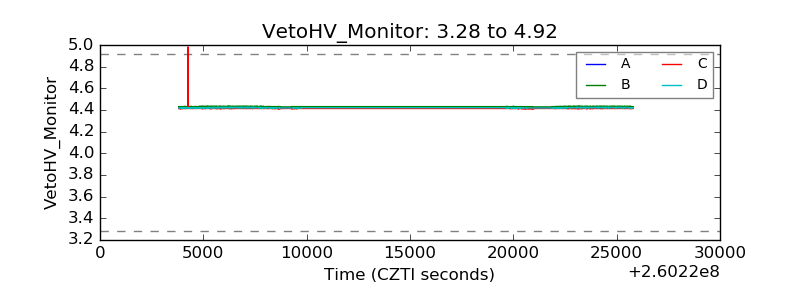 |
| Veto LLD | 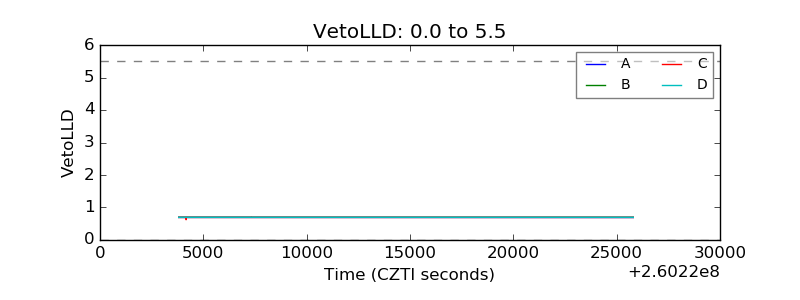 |
| Alpha Counter | 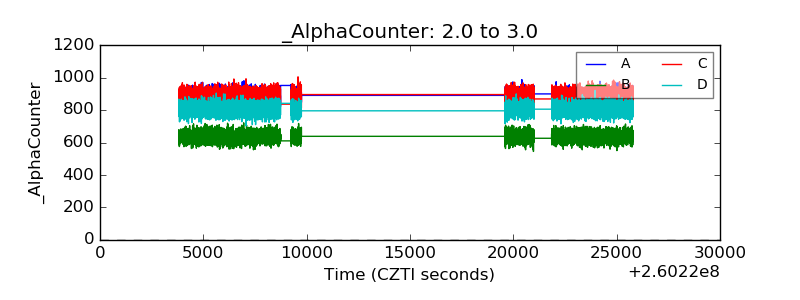 |
| _CPM_Rate | 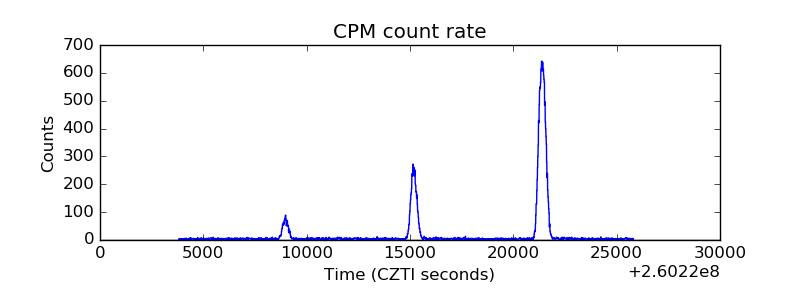 |
| CZT Counter | 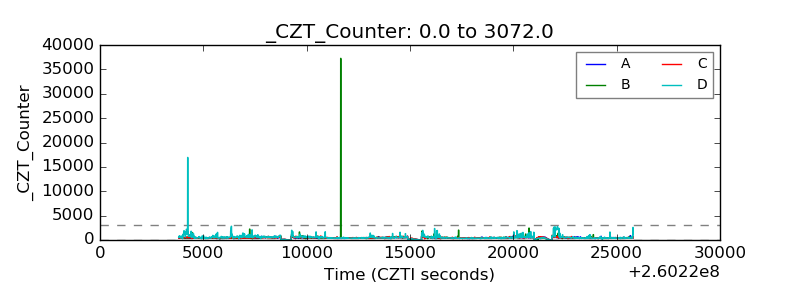 |
| +2.5 Volts monitor |  |
| +5 Volts monitor |  |
| _ROLL_ROT | 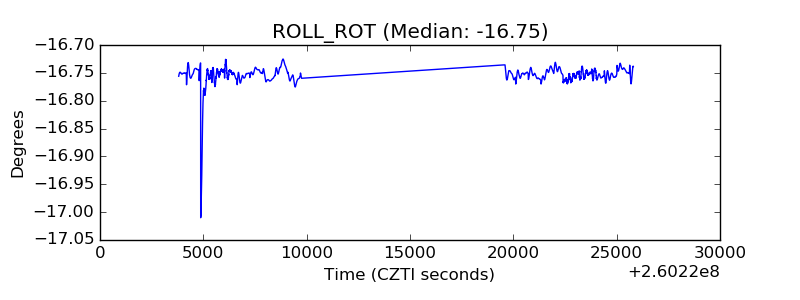 |
| _Roll_DEC | 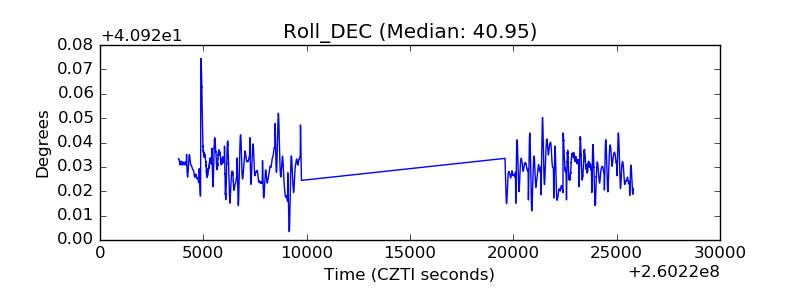 |
| _Roll_RA | 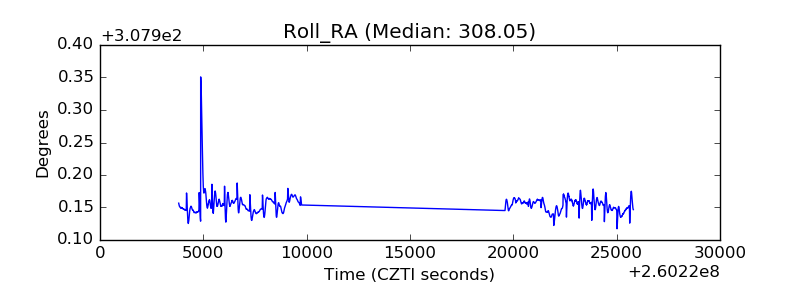 |
| Veto Counter | 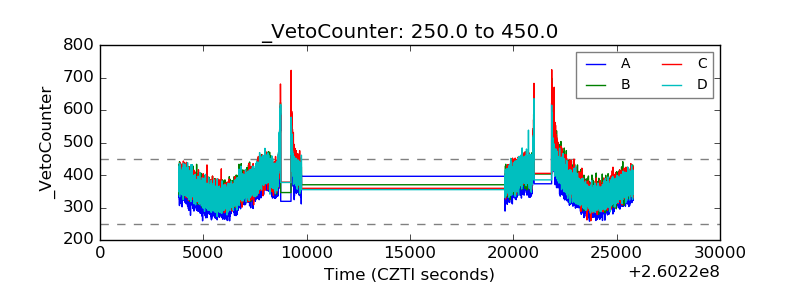 |