| Param | Original file | Final file |
|---|---|---|
| Filename | modeM0/AS1G08_032T01_9000001998_13559cztM0_level2.evt | modeM0/AS1G08_032T01_9000001998_13559cztM0_level2_quad_clean.evt |
| Size (bytes) | 1,036,733,760 | 222,148,800 |
| Size | 988.7 MB | 211.9 MB |
| Events in quadrant A | 7,009,884 | 1,391,804 |
| Events in quadrant B | 7,444,461 | 1,377,500 |
| Events in quadrant C | 7,299,942 | 1,492,308 |
| Events in quadrant D | 8,602,015 | 1,405,631 |
| Mode SS | |||
|---|---|---|---|
| Quadrant | BADHDUFLAG | Total packets | Discarded packets |
| A | 0 | 314 | 0 |
| B | 0 | 314 | 0 |
| C | 0 | 314 | 0 |
| D | 0 | 314 | 0 |
| Mode M0 | |||
|---|---|---|---|
| Quadrant | BADHDUFLAG | Total packets | Discarded packets |
| A | 0 | 31561 | 3 |
| B | 0 | 32670 | 3 |
| C | 0 | 31629 | 3 |
| D | 0 | 36617 | 3 |
| Mode M9 | |||
|---|---|---|---|
| Quadrant | BADHDUFLAG | Total packets | Discarded packets |
| A | 0 | 20 | 0 |
| B | 0 | 20 | 0 |
| C | 0 | 20 | 0 |
| D | 0 | 20 | 0 |
| Quadrant | Total seconds | Saturated seconds | Saturation percentage |
|---|---|---|---|
| A | 15382 | 68 | 0.442075% |
| B | 15382 | 140 | 0.910155% |
| C | 15382 | 60 | 0.390066% |
| D | 15382 | 464 | 3.016513% |
Noise dominated data is calculated using 1-second bins in cleaned event files. If a bin has >2000 counts, and if more than 50% of those come from <1% of pixels, then it is considered to be noise-dominated and hence unusable.
| Quadrant | # 1 sec bins | Bins with >0 counts | Bins with >2000 counts | High rate bins dominated by noise | Noise dominated (total time) | Noise dominated (detector-on time) | Marked lightcurve |
|---|---|---|---|---|---|---|---|
| A | 17408 | 15386 | 0 | 0 | 0.00% | 0.00% | 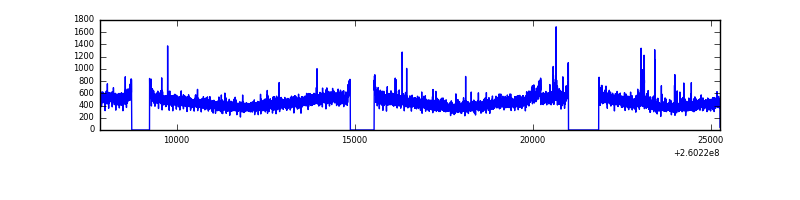 |
| B | 17408 | 15383 | 35 | 35 | 0.20% | 0.23% | 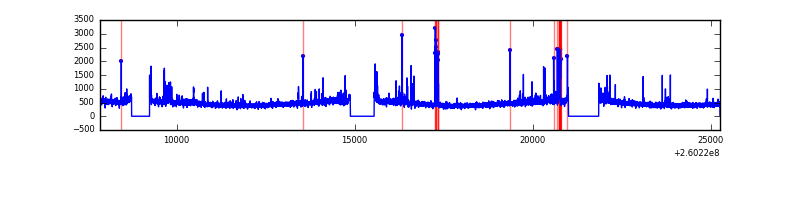 |
| C | 17408 | 15383 | 2 | 2 | 0.01% | 0.01% | 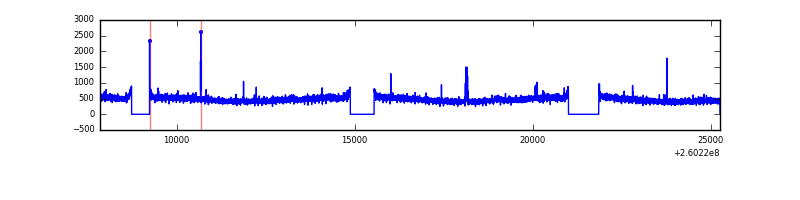 |
| D | 17408 | 15385 | 329 | 329 | 1.89% | 2.14% | 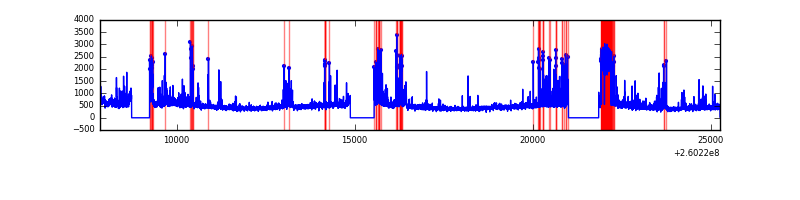 |
Top three noisy pixels from each quadrant. If the there are fewer than three noisy pixels in the level2.evt file, extra rows are filled as -1
| Pixel properties | Quadrant properties | ||||||
|---|---|---|---|---|---|---|---|
| Quadrant | DetID | PixID | Counts | Sigma | Mean | Median | Sigma |
| A | 14 | 238 | 86148 | 233.84 | 1788 | 1750 | 360.9 |
| A | 1 | 162 | 26924 | 69.75 | 1788 | 1750 | 360.9 |
| A | 4 | 2 | 16711 | 41.45 | 1788 | 1750 | 360.9 |
| B | 4 | 142 | 120542 | 353.0 | 1777 | 1733 | 336.6 |
| B | 3 | 64 | 111734 | 326.83 | 1777 | 1733 | 336.6 |
| B | 3 | 209 | 92733 | 270.38 | 1777 | 1733 | 336.6 |
| C | 3 | 233 | 330215 | 809.93 | 1769 | 1782 | 405.5 |
| C | 7 | 238 | 32555 | 75.89 | 1769 | 1782 | 405.5 |
| C | 14 | 234 | 14470 | 31.29 | 1769 | 1782 | 405.5 |
| D | 5 | 222 | 678857 | 1613.3 | 1739 | 1693 | 419.7 |
| D | 13 | 104 | 332645 | 788.47 | 1739 | 1693 | 419.7 |
| D | 8 | 195 | 217011 | 512.98 | 1739 | 1693 | 419.7 |
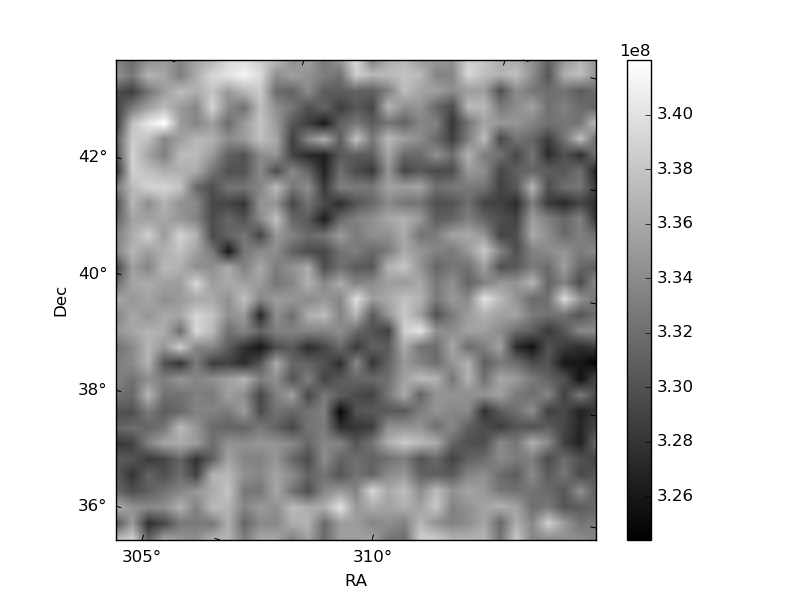
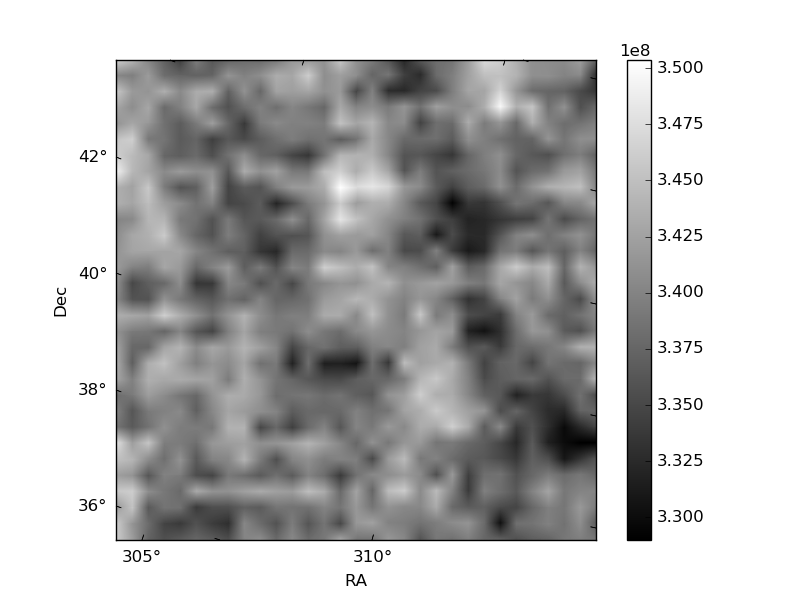
Histogram calculated using DETX and DETY for each event in the final _common_clean file
| Quadrant A | 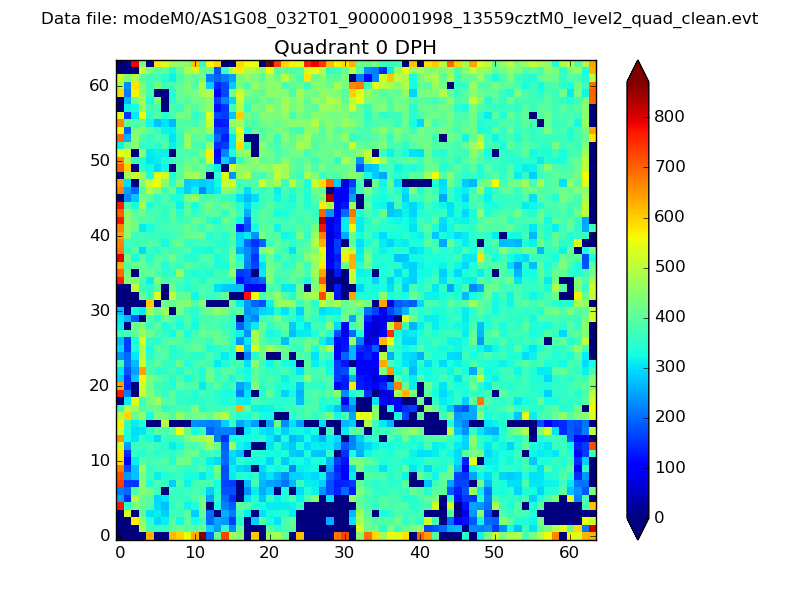 |
 |
Quadrant B |
|---|---|---|---|
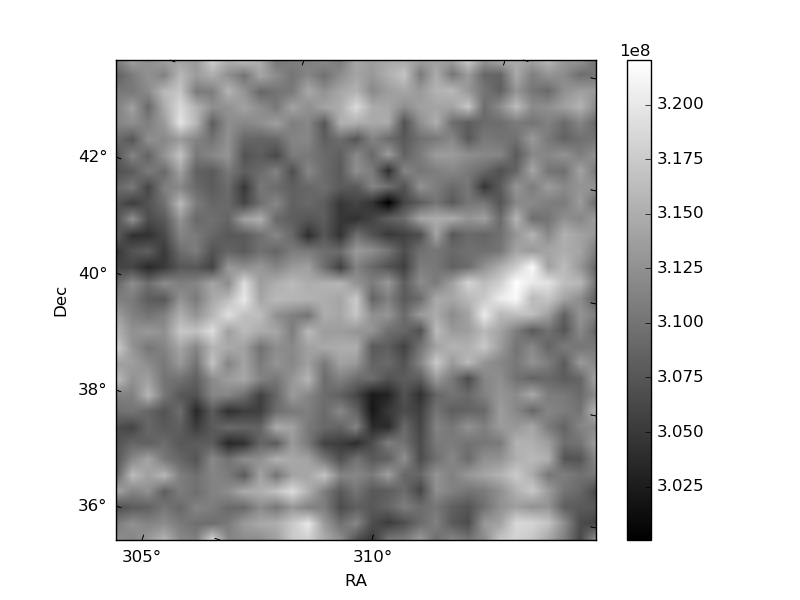
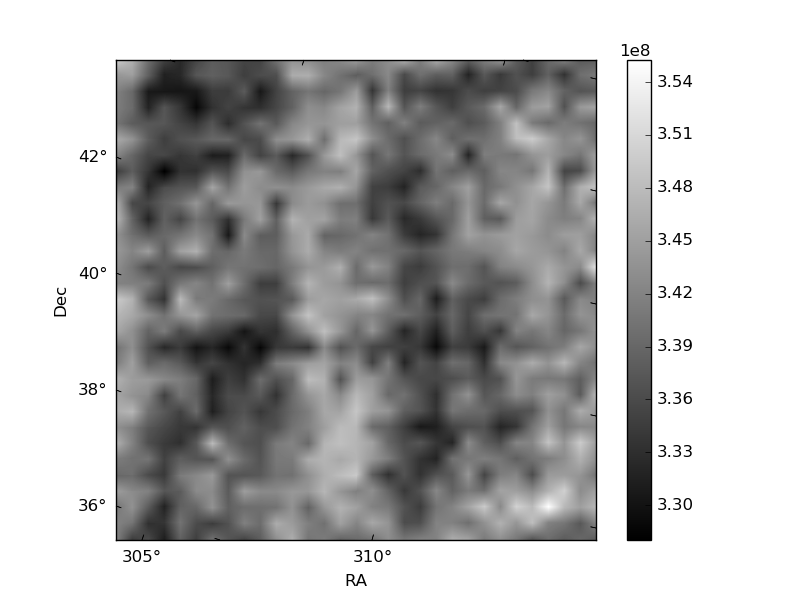
| Quadrant D | 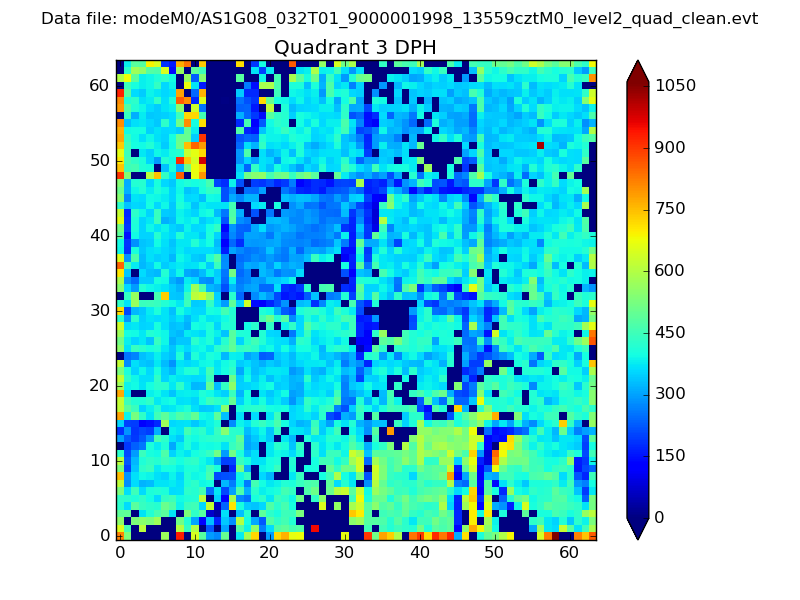 |
 |
Quadrant C |
| Plot type | Count rate plots | Images |
|---|---|---|
| Comparison with Poisson distribution Blue bars denote a histogram of data divided into 1 sec bins. Red curve is a Poisson curve with rate = median count rate of data. |
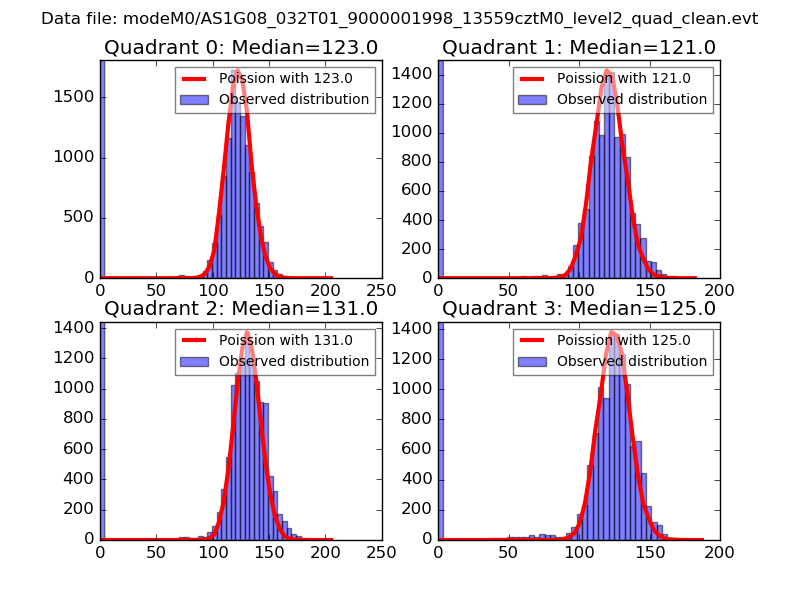 |
 |
| Quadrant-wise count rates Data is divided into 100 sec bins |
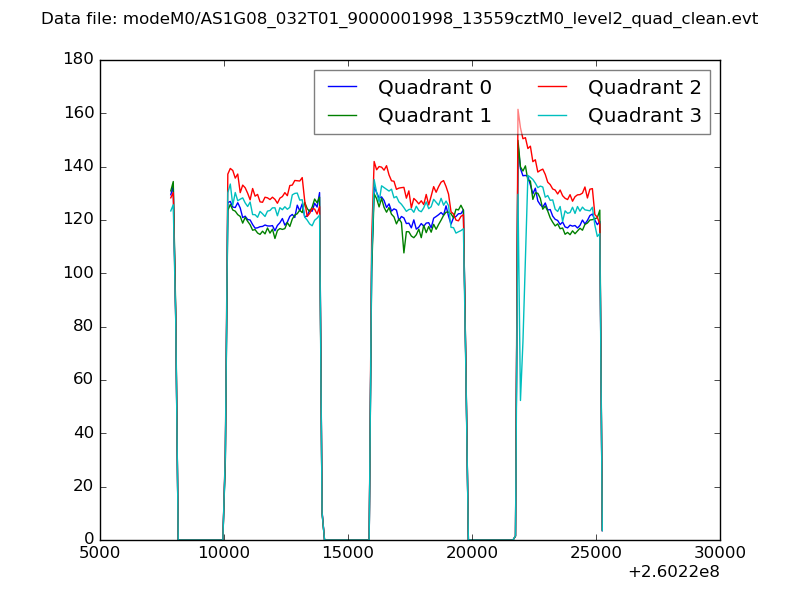 |
|
| Module-wise count rates for Quadrant A Data is divided into 100 sec bins |
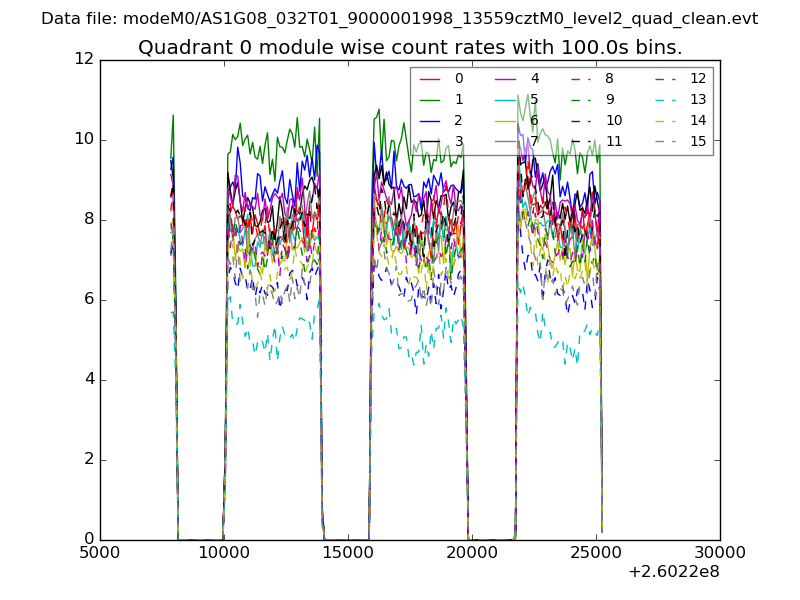 |
 |
| Module-wise count rates for Quadrant B Data is divided into 100 sec bins |
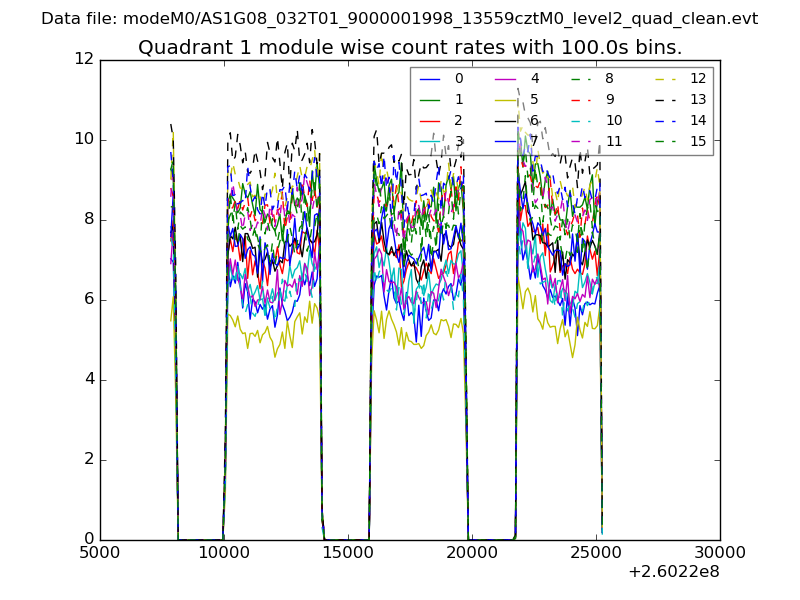 |
 |
| Module-wise count rates for Quadrant C Data is divided into 100 sec bins |
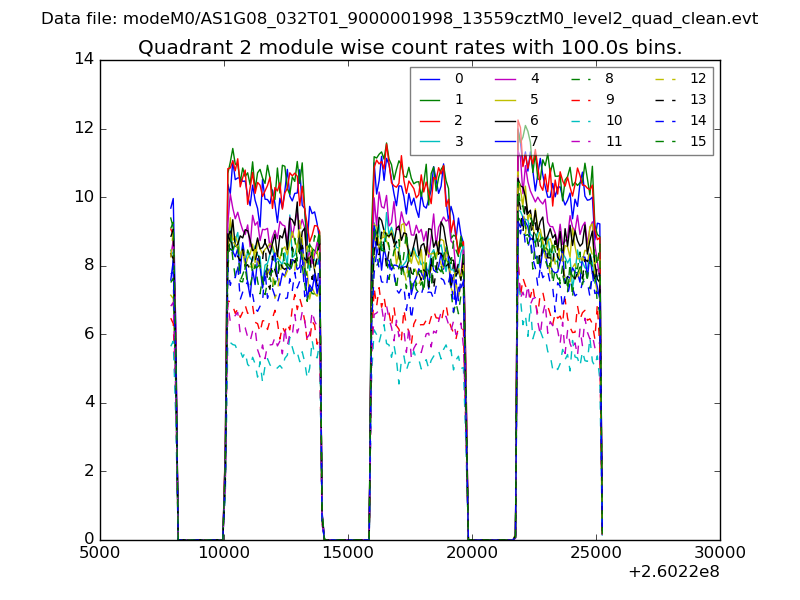 |
 |
| Module-wise count rates for Quadrant D Data is divided into 100 sec bins |
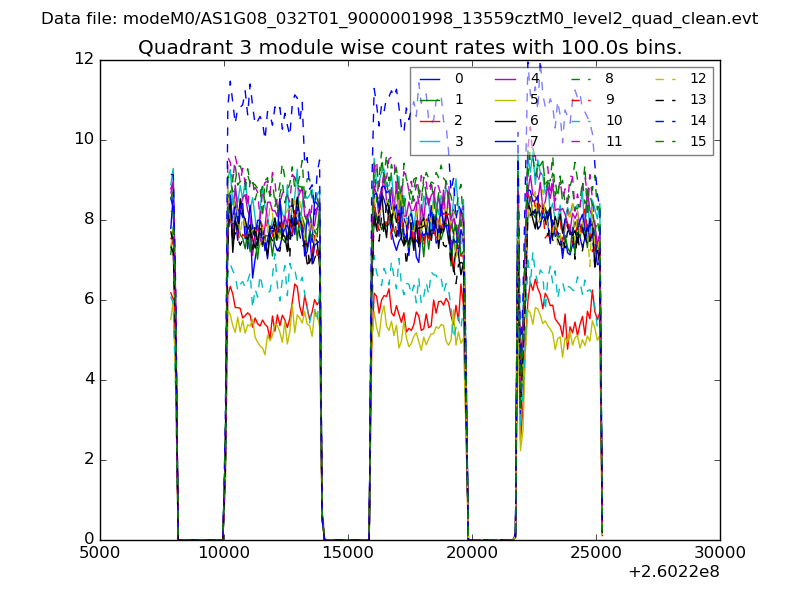 |
 |
| Parameter | Plot |
|---|---|
| CZT HV Monitor | 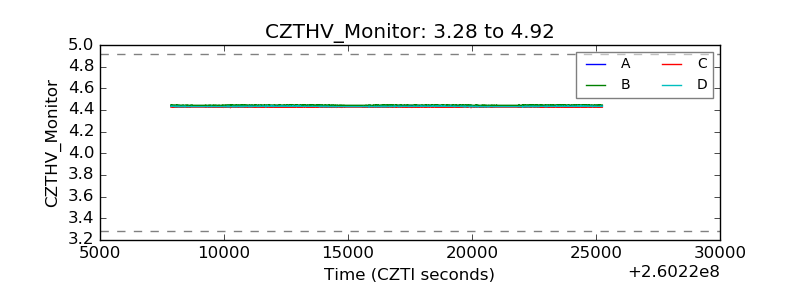 |
| D_VDD | 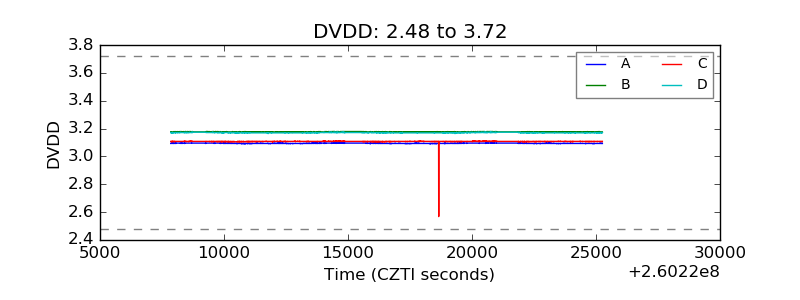 |
| Temperature 1 | 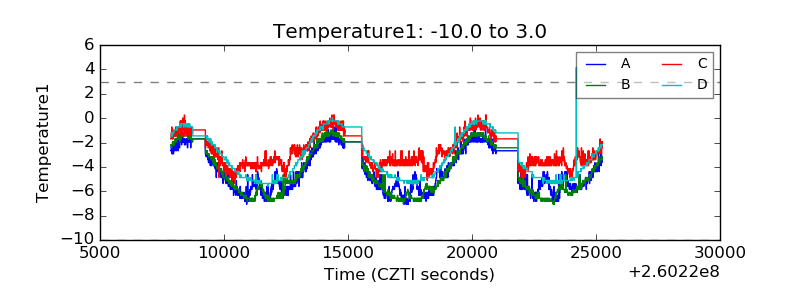 |
| Veto HV Monitor |  |
| Veto LLD | 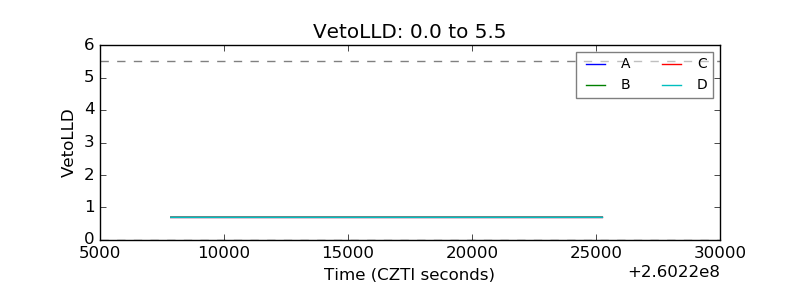 |
| Alpha Counter | 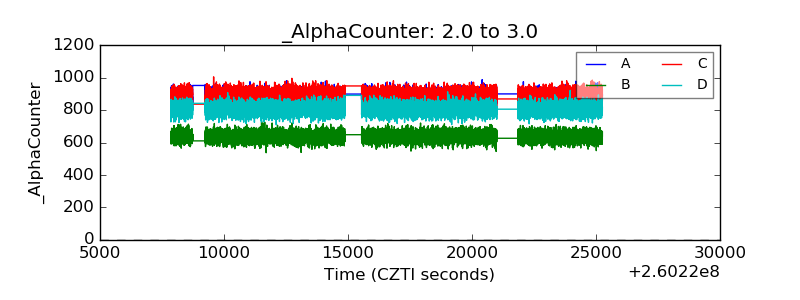 |
| _CPM_Rate | 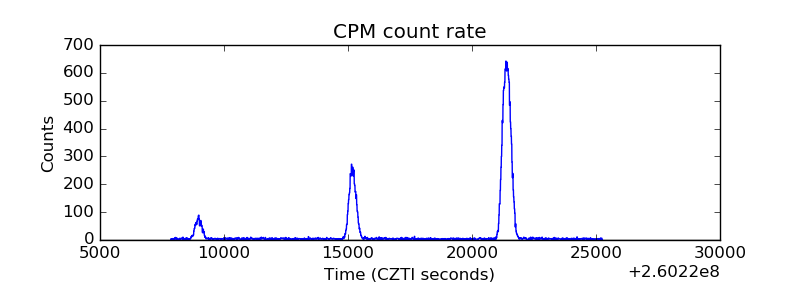 |
| CZT Counter |  |
| +2.5 Volts monitor |  |
| +5 Volts monitor |  |
| _ROLL_ROT | 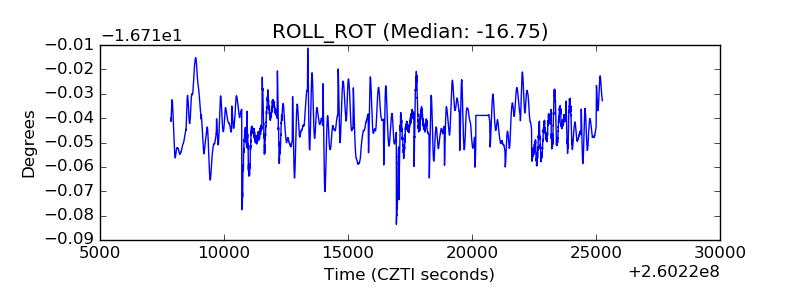 |
| _Roll_DEC | 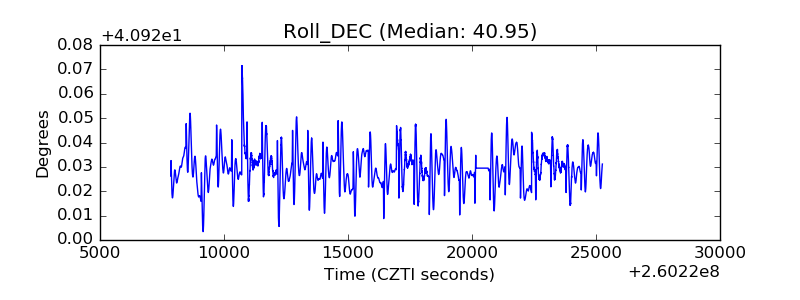 |
| _Roll_RA |  |
| Veto Counter | 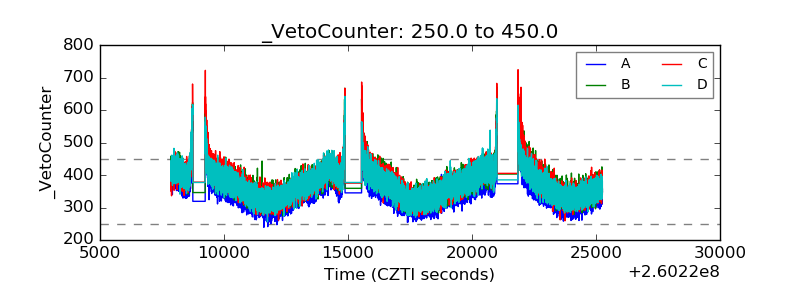 |