| Param | Original file | Final file |
|---|---|---|
| Filename | modeM0/AS1A04_180T01_9000002000cztM0_level2.fits | modeM0/AS1A04_180T01_9000002000cztM0_level2_quad_clean.evt |
| Size (bytes) | 470,494,080 | 343,287,360 |
| Size | 448.7 MB | 327.4 MB |
| Events in quadrant A | 2,933,344 | 1,892,045 |
| Events in quadrant B | 2,782,054 | 1,854,465 |
| Events in quadrant C | 2,832,968 | 1,791,181 |
| Events in quadrant D | 2,439,606 | 1,596,567 |
| Mode SS | |||
|---|---|---|---|
| Quadrant | BADHDUFLAG | Total packets | Discarded packets |
| A | 0 | 968 | 0 |
| B | 0 | 968 | 0 |
| C | 0 | 968 | 0 |
| D | 0 | 968 | 0 |
| Mode M9 | |||
|---|---|---|---|
| Quadrant | BADHDUFLAG | Total packets | Discarded packets |
| A | 0 | 91 | 0 |
| B | 0 | 91 | 0 |
| C | 0 | 91 | 0 |
| D | 0 | 91 | 0 |
| Mode M0 | |||
|---|---|---|---|
| Quadrant | BADHDUFLAG | Total packets | Discarded packets |
| A | 0 | 99110 | 0 |
| B | 0 | 103013 | 0 |
| C | 0 | 101583 | 0 |
| D | 0 | 128608 | 0 |
| Quadrant | Total seconds | Saturated seconds | Saturation percentage |
|---|---|---|---|
| A | 47507 | 639 | 1.345065% |
| B | 47507 | 862 | 1.814469% |
| C | 47507 | 537 | 1.130360% |
| D | 47507 | 2373 | 4.995053% |
Noise dominated data is calculated using 1-second bins in cleaned event files. If a bin has >2000 counts, and if more than 50% of those come from <1% of pixels, then it is considered to be noise-dominated and hence unusable.
| Quadrant | # 1 sec bins | Bins with >0 counts | Bins with >2000 counts | High rate bins dominated by noise | Noise dominated (total time) | Noise dominated (detector-on time) | Marked lightcurve |
|---|---|---|---|---|---|---|---|
| A | 56567 | 47498 | 0 | 0 | 0.00% | 0.00% |  |
| B | 56566 | 47492 | 0 | 0 | 0.00% | 0.00% | 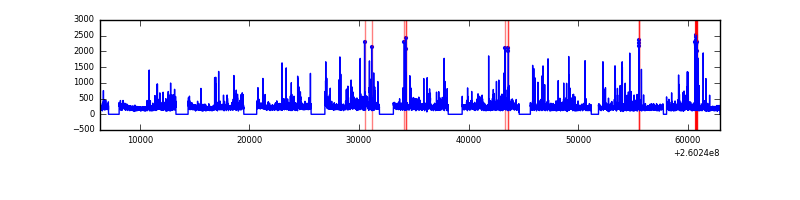 |
| C | 56566 | 47499 | 0 | 0 | 0.00% | 0.00% |  |
| D | 56567 | 47490 | 0 | 0 | 0.00% | 0.00% | 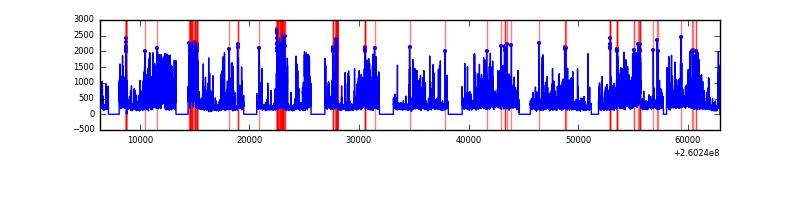 |
Top three noisy pixels from each quadrant. If the there are fewer than three noisy pixels in the level2.evt file, extra rows are filled as -1
| Pixel properties | Quadrant properties | ||||||
|---|---|---|---|---|---|---|---|
| Quadrant | DetID | PixID | Counts | Sigma | Mean | Median | Sigma |
| A | 0 | 29 | 2777 | 10.82 | 763 | 715 | 190.6 |
| A | 7 | 110 | 2344 | 8.55 | 763 | 715 | 190.6 |
| A | 0 | 30 | 2177 | 7.67 | 763 | 715 | 190.6 |
| B | 2 | 9 | 2401 | 11.37 | 735 | 699 | 149.7 |
| B | 3 | 17 | 1795 | 7.32 | 735 | 699 | 149.7 |
| B | 5 | 128 | 1792 | 7.3 | 735 | 699 | 149.7 |
| C | 1 | 80 | 2134 | 7.44 | 748 | 698 | 193.0 |
| C | 1 | 81 | 2123 | 7.38 | 748 | 698 | 193.0 |
| C | 2 | 191 | 1963 | 6.55 | 748 | 698 | 193.0 |
| D | 6 | 231 | 1831 | 6.39 | 697 | 635 | 187.2 |
| D | 7 | 3 | 1758 | 6.0 | 697 | 635 | 187.2 |
| D | 3 | 14 | 1733 | 5.86 | 697 | 635 | 187.2 |
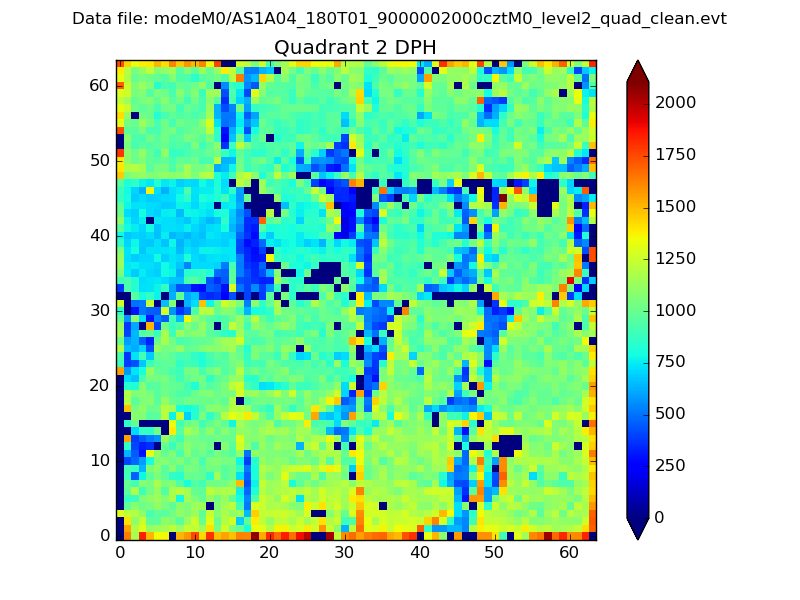
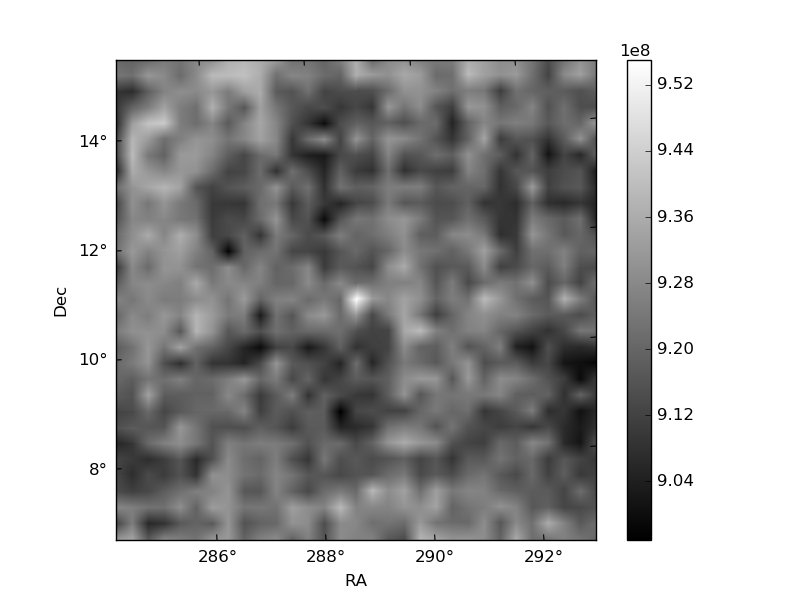
Histogram calculated using DETX and DETY for each event in the final _common_clean file
| Quadrant A | 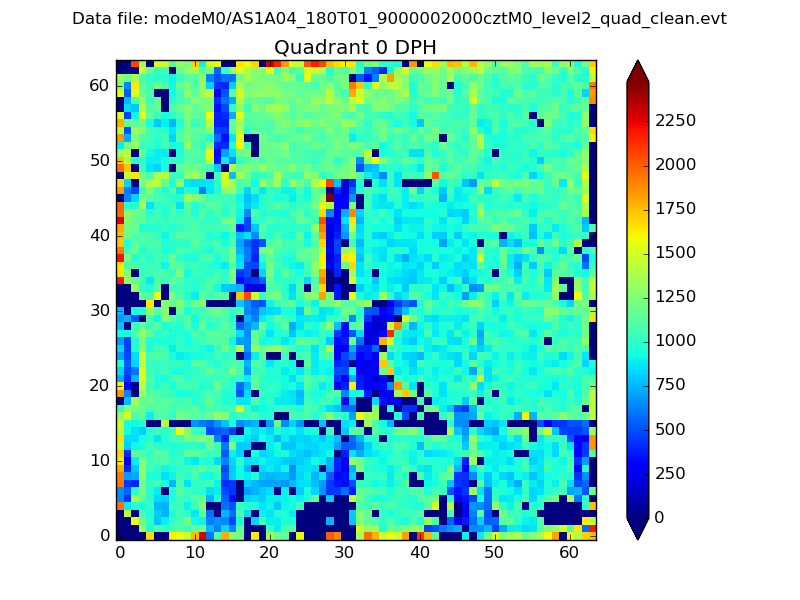 |
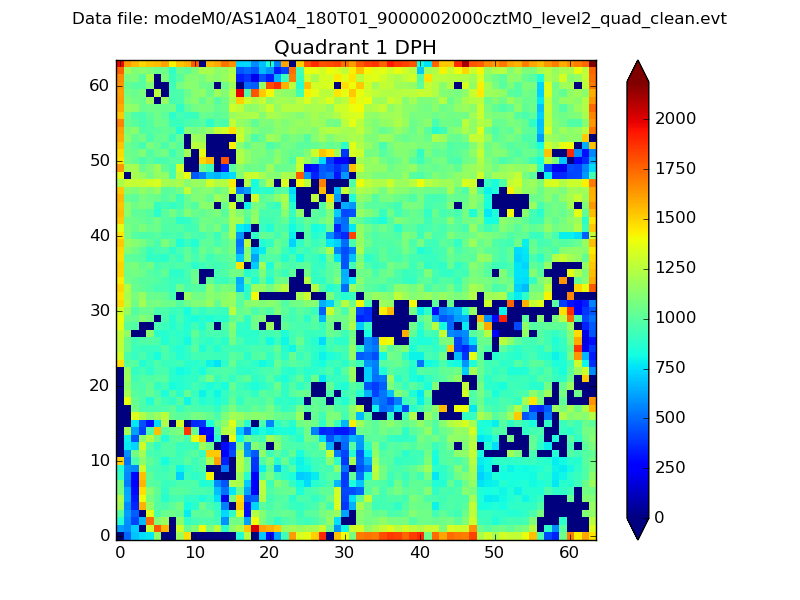 |
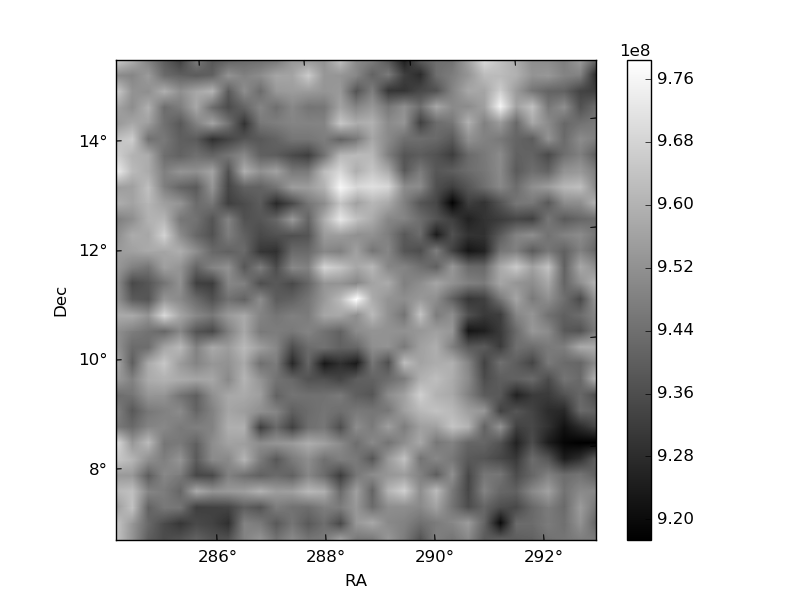
Quadrant B |
|---|---|---|---|
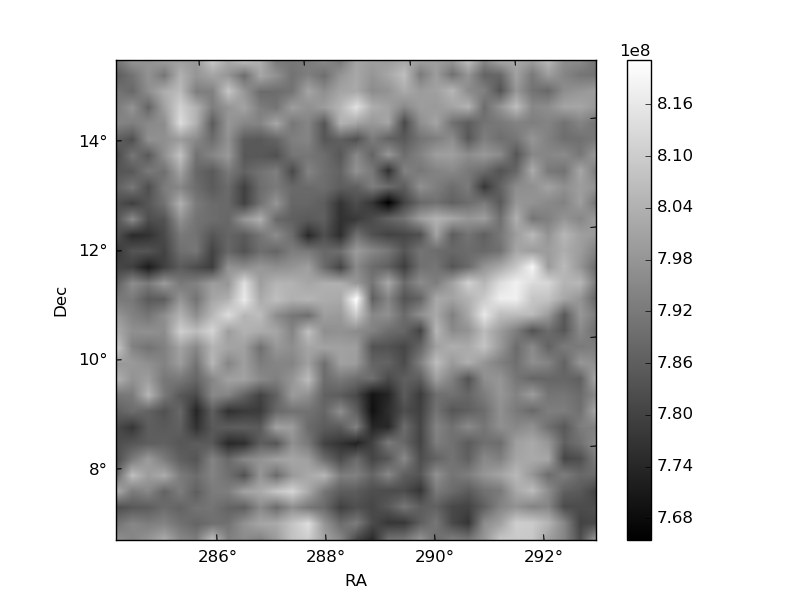
| Quadrant D | 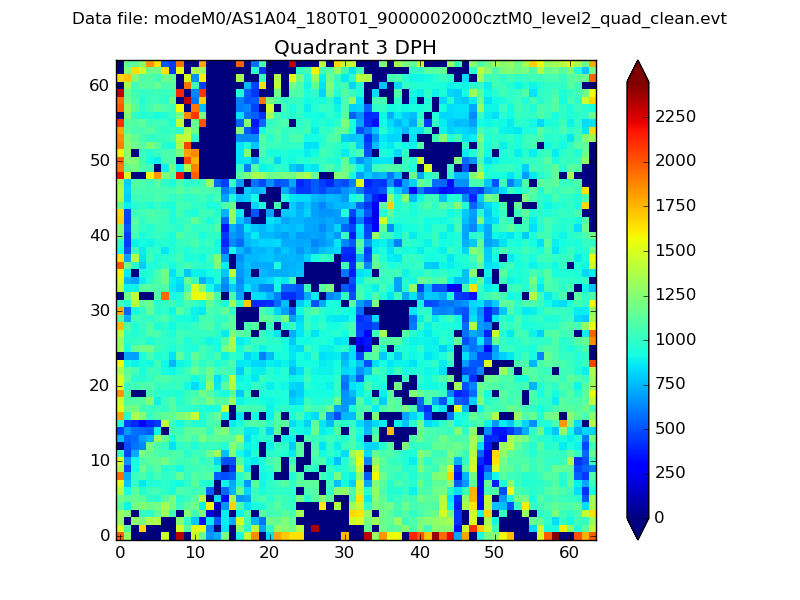 |
 |
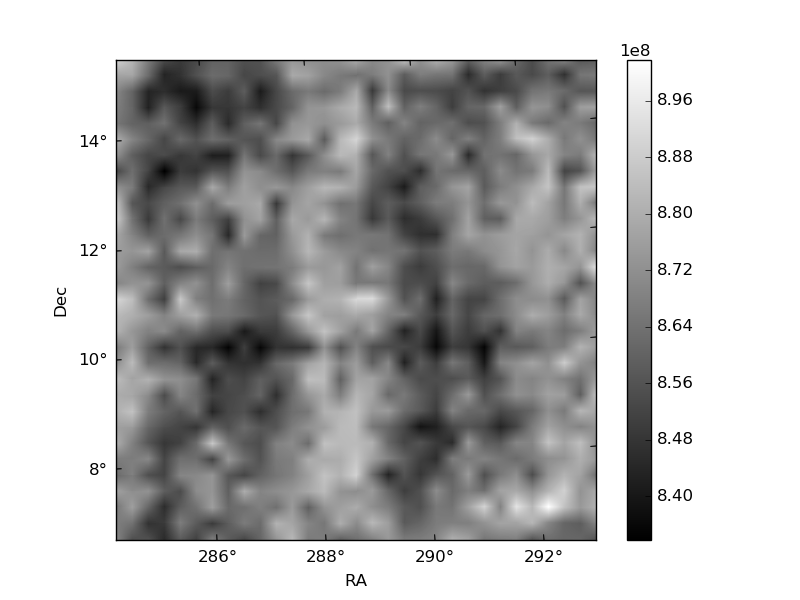
Quadrant C |
| Plot type | Count rate plots | Images |
|---|---|---|
| Comparison with Poisson distribution Blue bars denote a histogram of data divided into 1 sec bins. Red curve is a Poisson curve with rate = median count rate of data. |
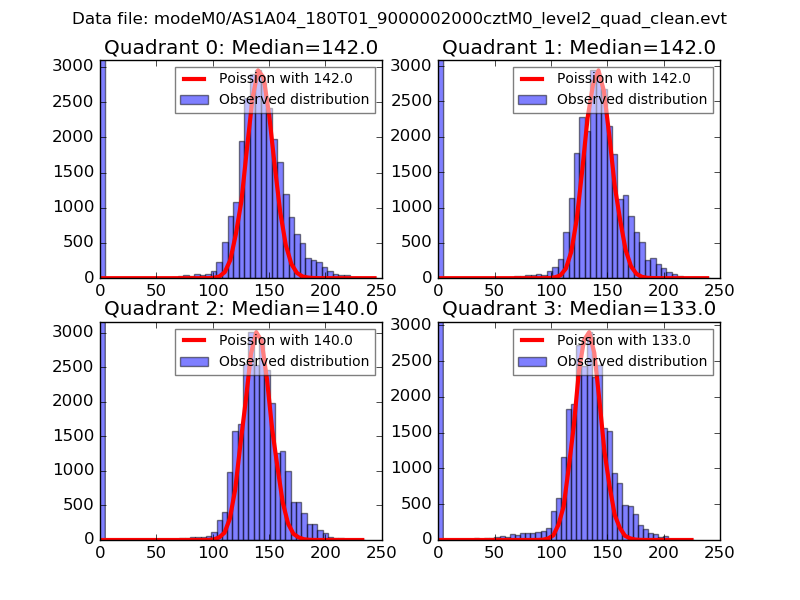 |
 |
| Quadrant-wise count rates Data is divided into 100 sec bins |
 |
|
| Module-wise count rates for Quadrant A Data is divided into 100 sec bins |
 |
 |
| Module-wise count rates for Quadrant B Data is divided into 100 sec bins |
 |
 |
| Module-wise count rates for Quadrant C Data is divided into 100 sec bins |
 |
 |
| Module-wise count rates for Quadrant D Data is divided into 100 sec bins |
 |
 |
| Parameter | Plot |
|---|---|
| CZT HV Monitor | 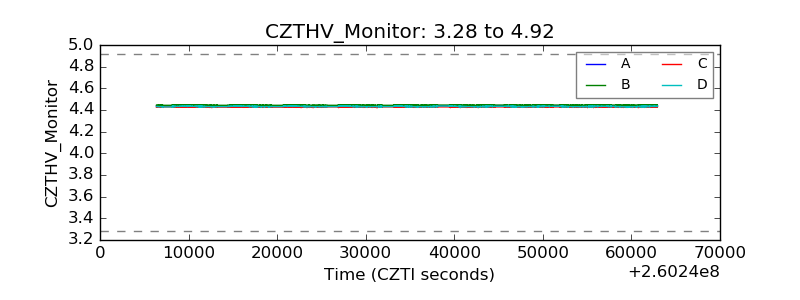 |
| D_VDD | 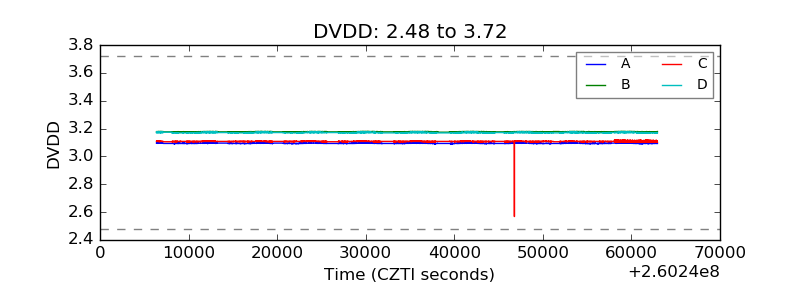 |
| Temperature 1 |  |
| Veto HV Monitor | 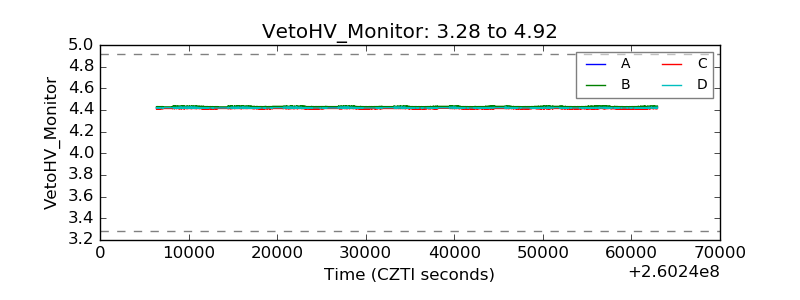 |
| Veto LLD | 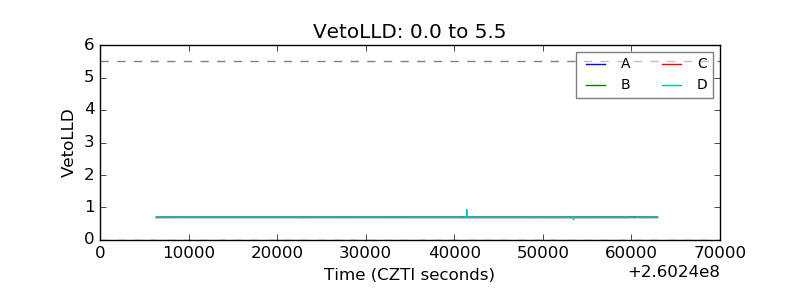 |
| Alpha Counter | 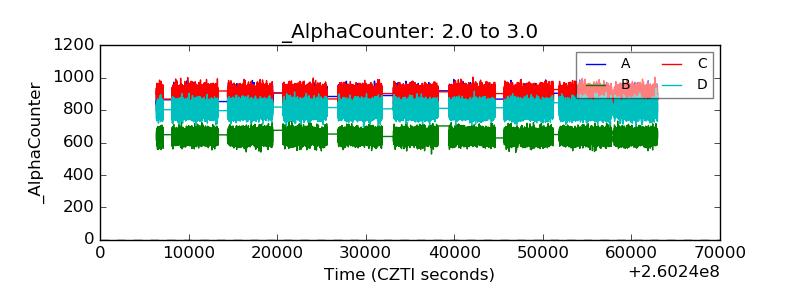 |
| _CPM_Rate | 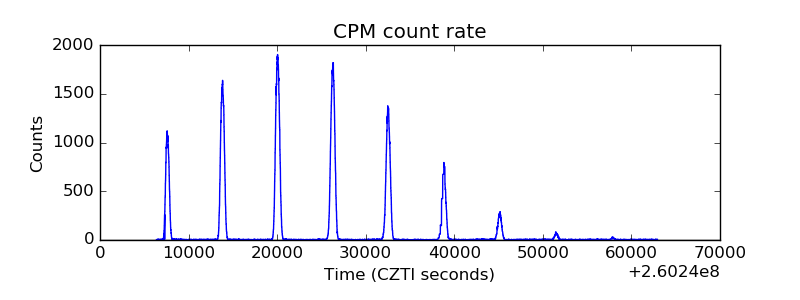 |
| CZT Counter | 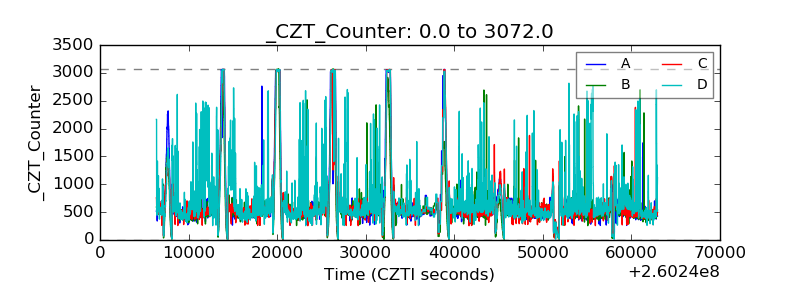 |
| +2.5 Volts monitor | 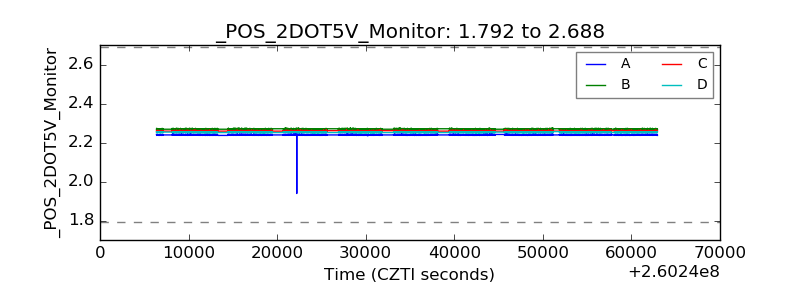 |
| +5 Volts monitor |  |
| _ROLL_ROT | 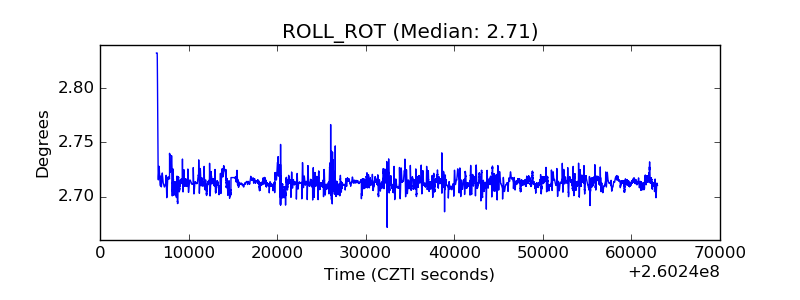 |
| _Roll_DEC |  |
| _Roll_RA | 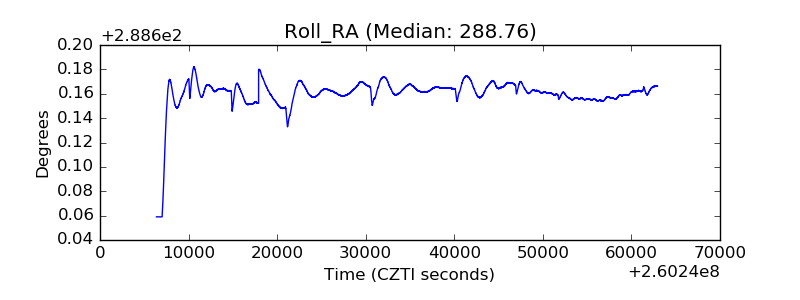 |
| Veto Counter |  |