| Param | Original file | Final file |
|---|---|---|
| Filename | modeM0/AS1A04_180T01_9000002000_13557cztM0_level2.evt | modeM0/AS1A04_180T01_9000002000_13557cztM0_level2_quad_clean.evt |
| Size (bytes) | 170,714,880 | 31,959,360 |
| Size | 162.8 MB | 30.5 MB |
| Events in quadrant A | 1,135,480 | 206,291 |
| Events in quadrant B | 1,152,137 | 208,455 |
| Events in quadrant C | 1,165,027 | 206,385 |
| Events in quadrant D | 1,565,261 | 186,749 |
| Mode SS | |||
|---|---|---|---|
| Quadrant | BADHDUFLAG | Total packets | Discarded packets |
| A | 0 | 46 | 0 |
| B | 0 | 46 | 0 |
| C | 0 | 46 | 0 |
| D | 0 | 46 | 0 |
| Mode M9 | |||
|---|---|---|---|
| Quadrant | BADHDUFLAG | Total packets | Discarded packets |
| A | 0 | 10 | 0 |
| B | 0 | 10 | 0 |
| C | 0 | 10 | 0 |
| D | 0 | 10 | 0 |
| Mode M0 | |||
|---|---|---|---|
| Quadrant | BADHDUFLAG | Total packets | Discarded packets |
| A | 0 | 4678 | 2 |
| B | 0 | 4767 | 1 |
| C | 0 | 4766 | 1 |
| D | 0 | 6083 | 1 |
| Quadrant | Total seconds | Saturated seconds | Saturation percentage |
|---|---|---|---|
| A | 2207 | 16 | 0.724966% |
| B | 2207 | 27 | 1.223380% |
| C | 2207 | 9 | 0.407793% |
| D | 2207 | 129 | 5.845039% |
Noise dominated data is calculated using 1-second bins in cleaned event files. If a bin has >2000 counts, and if more than 50% of those come from <1% of pixels, then it is considered to be noise-dominated and hence unusable.
| Quadrant | # 1 sec bins | Bins with >0 counts | Bins with >2000 counts | High rate bins dominated by noise | Noise dominated (total time) | Noise dominated (detector-on time) | Marked lightcurve |
|---|---|---|---|---|---|---|---|
| A | 3183 | 2209 | 0 | 0 | 0.00% | 0.00% | 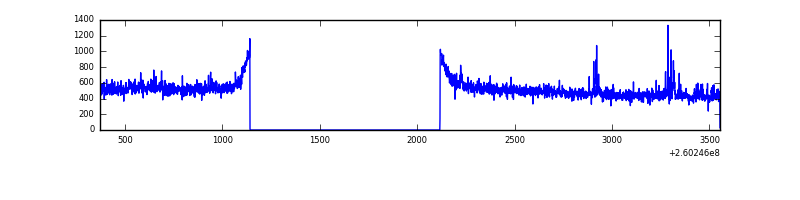 |
| B | 3183 | 2208 | 0 | 0 | 0.00% | 0.00% | 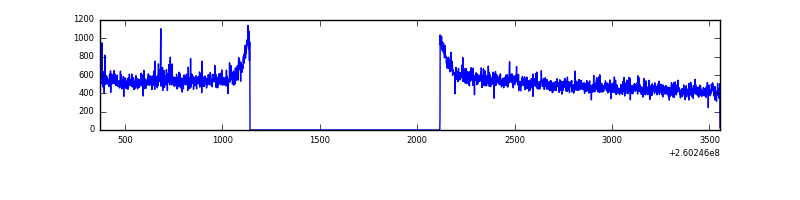 |
| C | 3183 | 2209 | 0 | 0 | 0.00% | 0.00% | 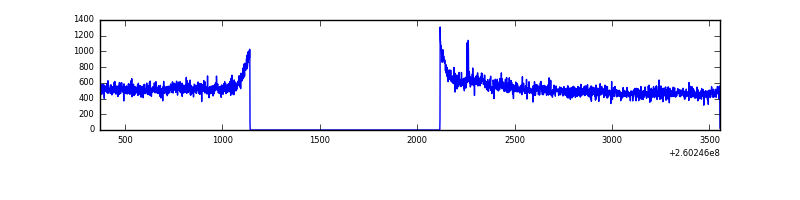 |
| D | 3183 | 2209 | 72 | 72 | 2.26% | 3.26% | 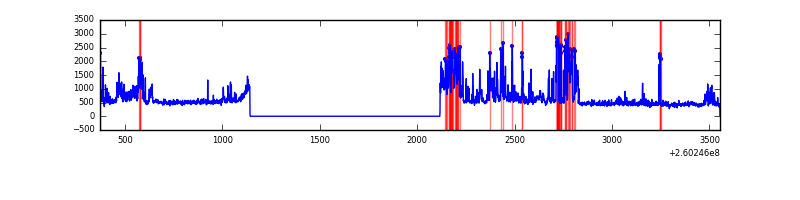 |
Top three noisy pixels from each quadrant. If the there are fewer than three noisy pixels in the level2.evt file, extra rows are filled as -1
| Pixel properties | Quadrant properties | ||||||
|---|---|---|---|---|---|---|---|
| Quadrant | DetID | PixID | Counts | Sigma | Mean | Median | Sigma |
| A | 14 | 238 | 12565 | 203.18 | 287 | 281 | 60.5 |
| A | 9 | 143 | 9327 | 149.62 | 287 | 281 | 60.5 |
| A | 1 | 162 | 7048 | 111.93 | 287 | 281 | 60.5 |
| B | 3 | 209 | 11174 | 189.5 | 289 | 282 | 57.5 |
| B | 12 | 111 | 6333 | 105.27 | 289 | 282 | 57.5 |
| B | 11 | 111 | 5155 | 84.78 | 289 | 282 | 57.5 |
| C | 3 | 233 | 71594 | 1058.86 | 280 | 282 | 67.3 |
| C | 13 | 61 | 1982 | 25.24 | 280 | 282 | 67.3 |
| C | 8 | 222 | 1043 | 11.3 | 280 | 282 | 67.3 |
| D | 13 | 122 | 246198 | 3636.67 | 269 | 261 | 67.6 |
| D | 5 | 222 | 212116 | 3132.7 | 269 | 261 | 67.6 |
| D | 8 | 195 | 32808 | 481.27 | 269 | 261 | 67.6 |
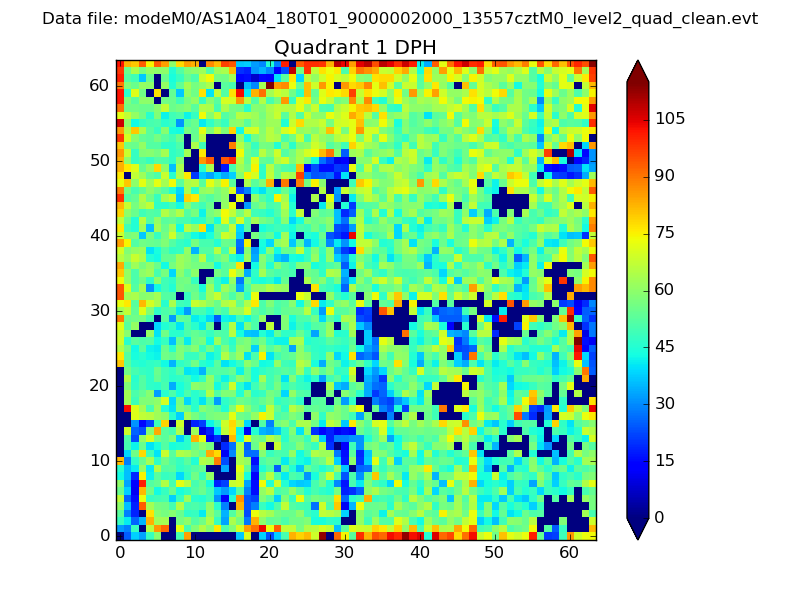
Histogram calculated using DETX and DETY for each event in the final _common_clean file
| Quadrant A |  |
 |
Quadrant B |
|---|---|---|---|
| Quadrant D | 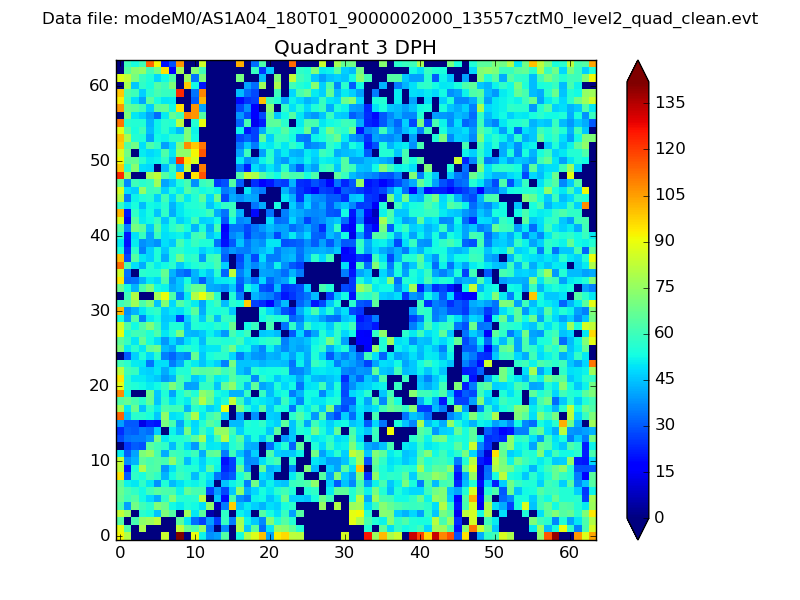 |
 |
Quadrant C |
| Plot type | Count rate plots | Images |
|---|---|---|
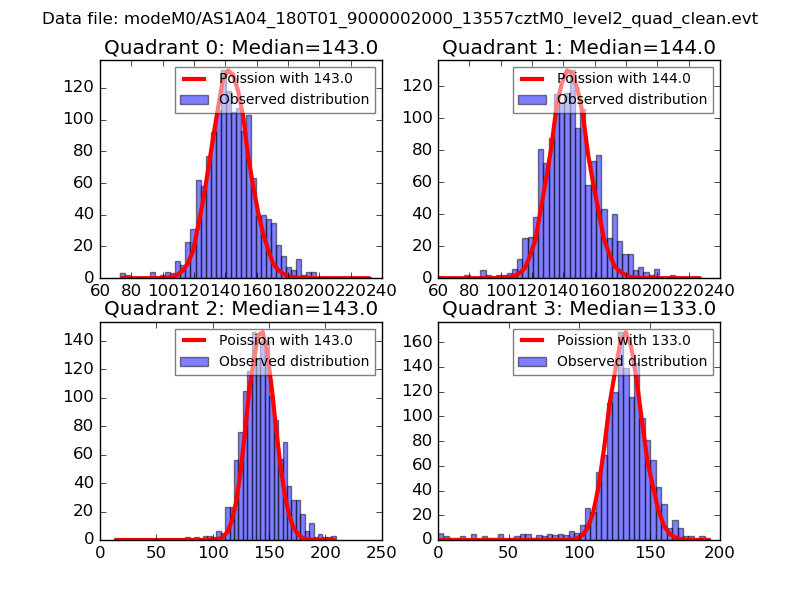
| Comparison with Poisson distribution Blue bars denote a histogram of data divided into 1 sec bins. Red curve is a Poisson curve with rate = median count rate of data. |
 |
 |
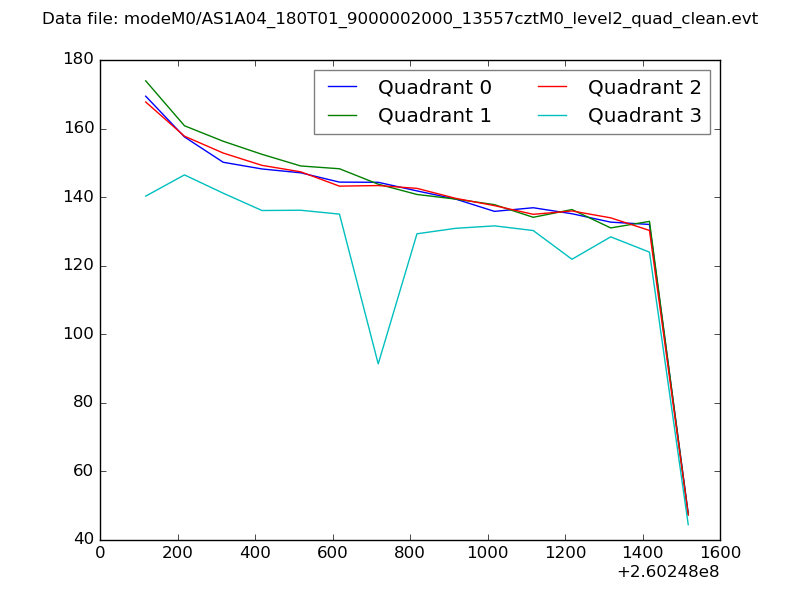
| Quadrant-wise count rates Data is divided into 100 sec bins |
 |
|
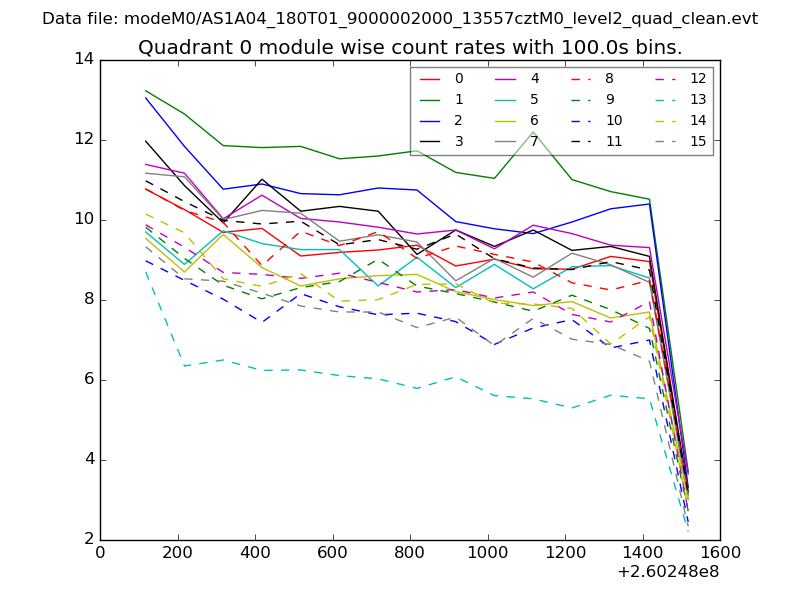
| Module-wise count rates for Quadrant A Data is divided into 100 sec bins |
 |
 |
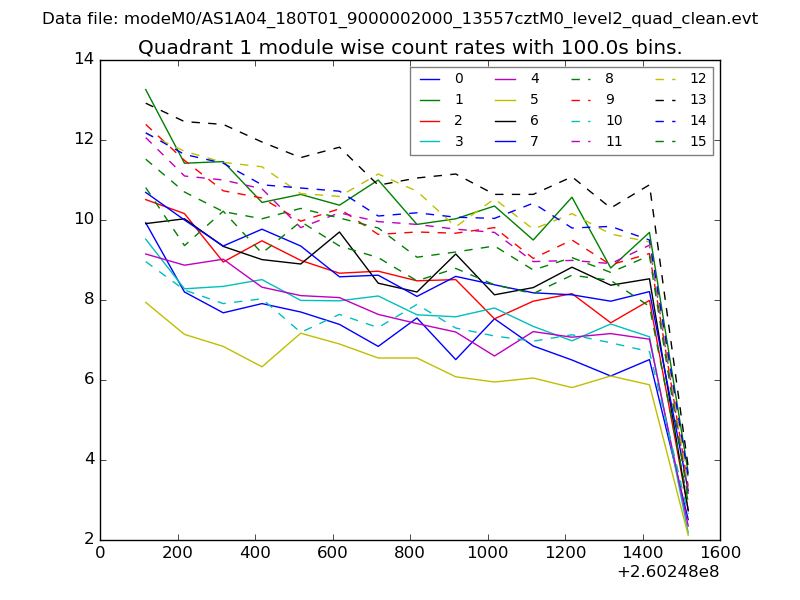
| Module-wise count rates for Quadrant B Data is divided into 100 sec bins |
 |
 |
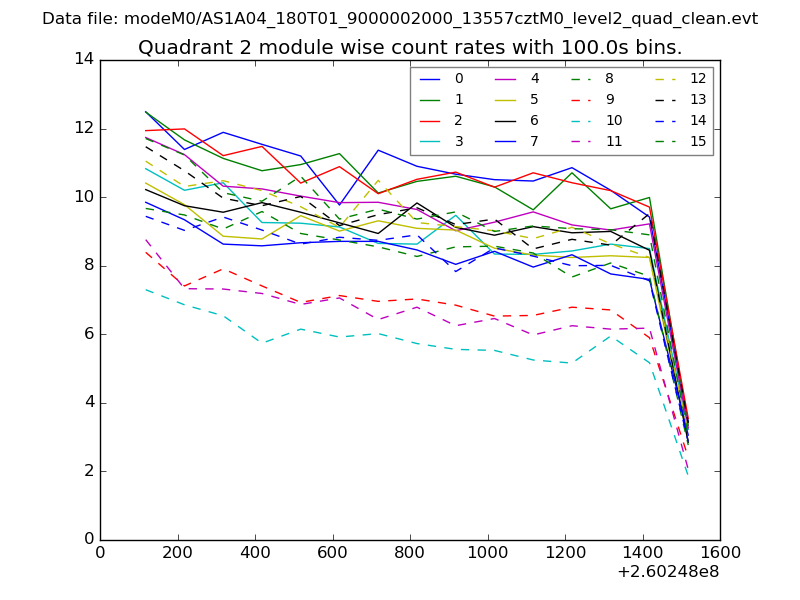
| Module-wise count rates for Quadrant C Data is divided into 100 sec bins |
 |
 |
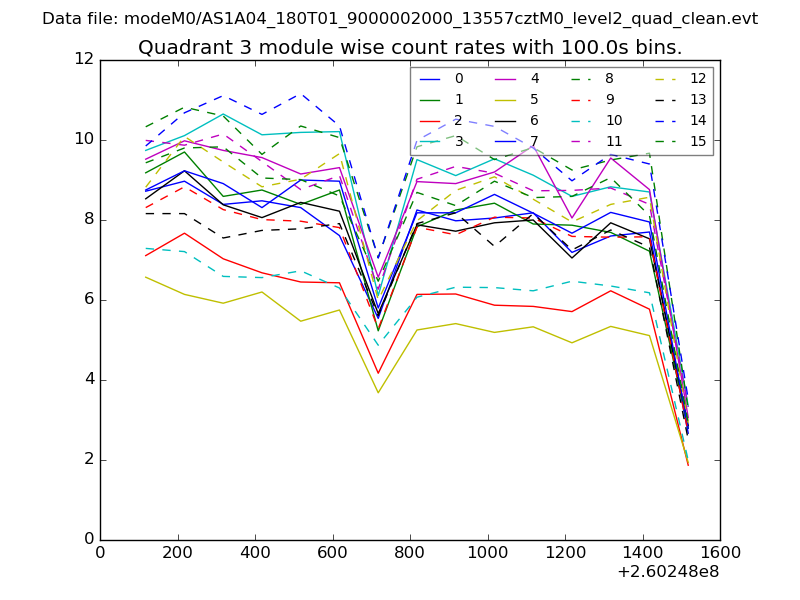
| Module-wise count rates for Quadrant D Data is divided into 100 sec bins |
 |
 |
| Parameter | Plot |
|---|---|
| CZT HV Monitor | 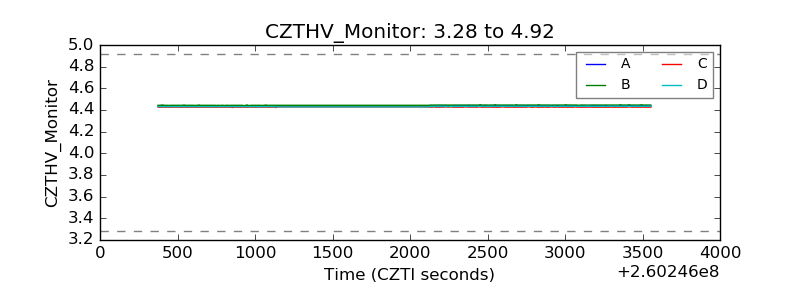 |
| D_VDD | 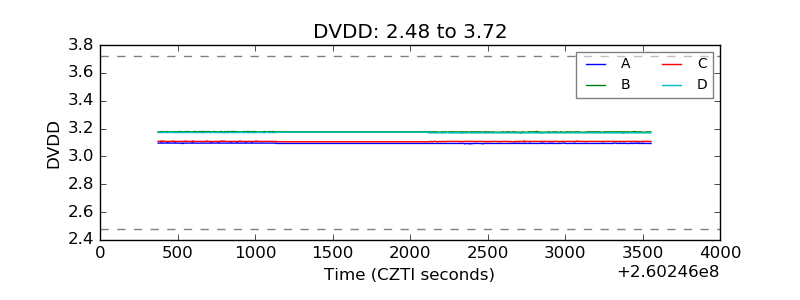 |
| Temperature 1 | 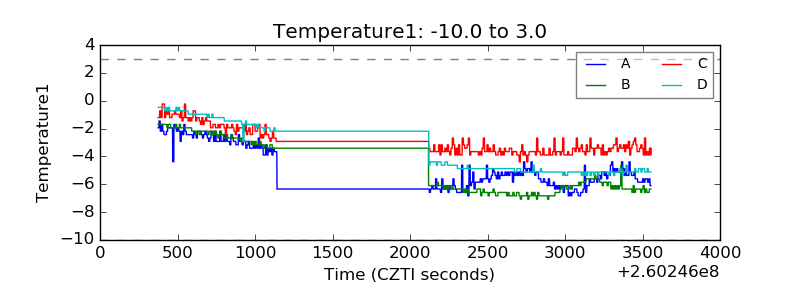 |
| Veto HV Monitor | 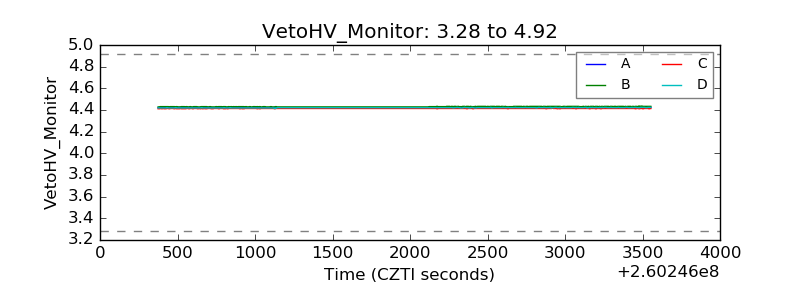 |
| Veto LLD | 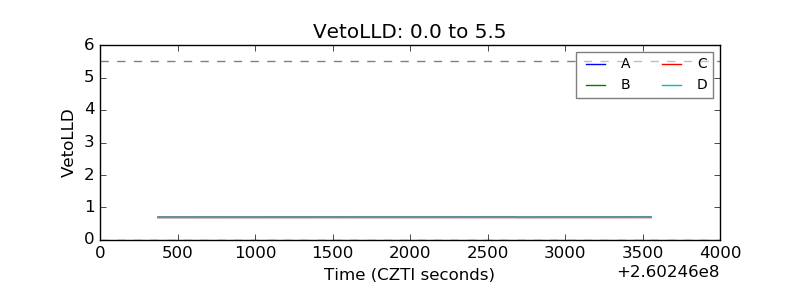 |
| Alpha Counter | 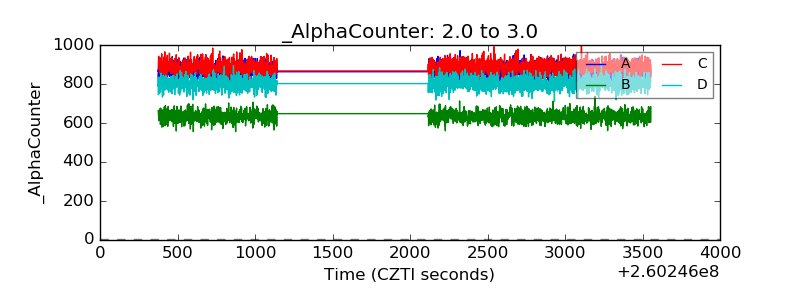 |
| _CPM_Rate | 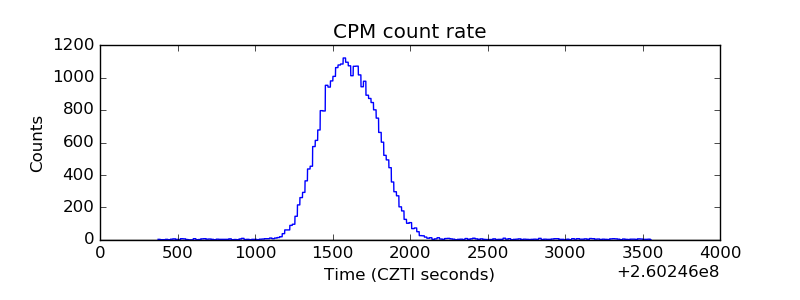 |
| CZT Counter | 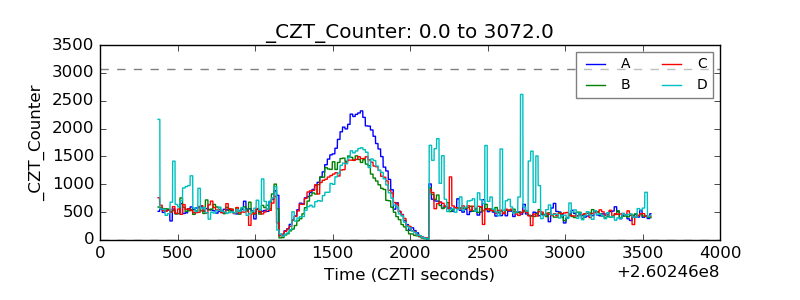 |
| +2.5 Volts monitor |  |
| +5 Volts monitor | 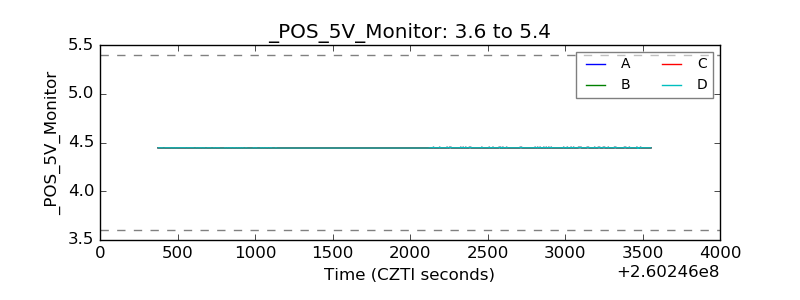 |
| _ROLL_ROT | 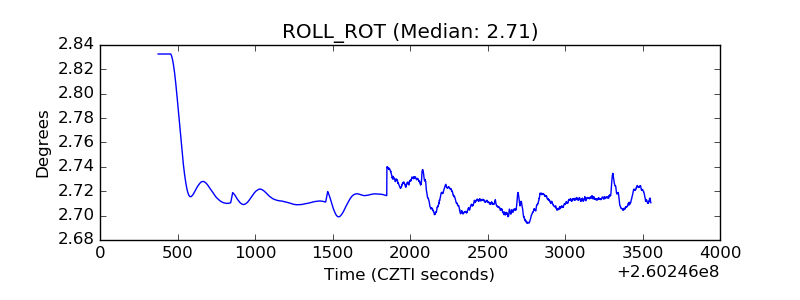 |
| _Roll_DEC | 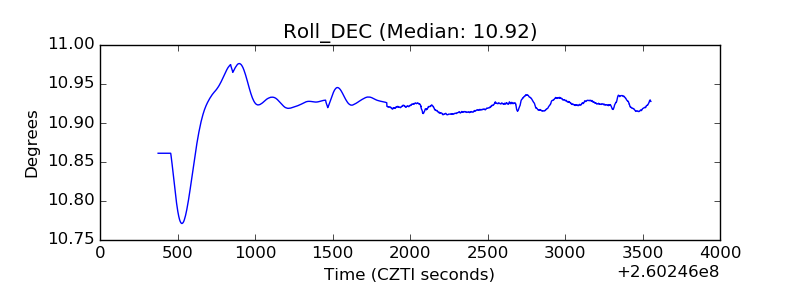 |
| _Roll_RA | 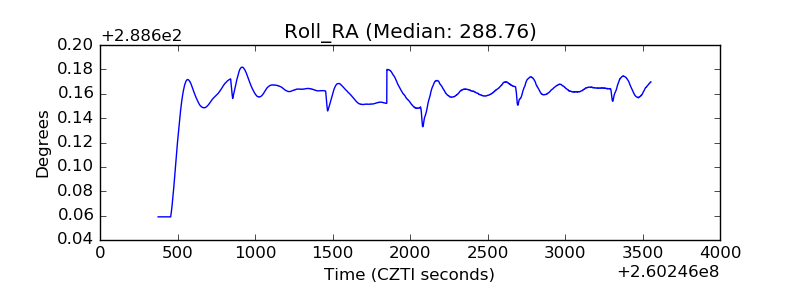 |
| Veto Counter | 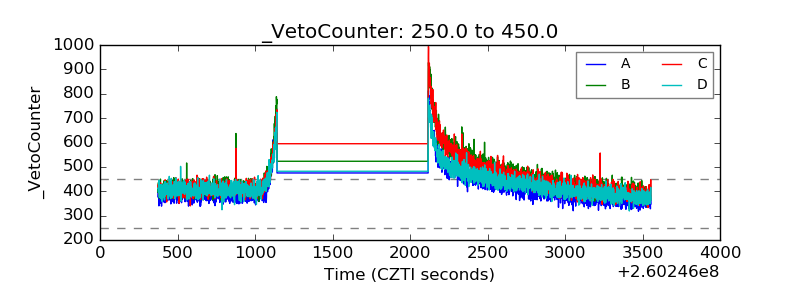 |