| Param | Original file | Final file |
|---|---|---|
| Filename | modeM0/AS1A04_180T01_9000002000_13559cztM0_level2.evt | modeM0/AS1A04_180T01_9000002000_13559cztM0_level2_quad_clean.evt |
| Size (bytes) | 552,522,240 | 98,326,080 |
| Size | 526.9 MB | 93.8 MB |
| Events in quadrant A | 3,274,740 | 637,613 |
| Events in quadrant B | 3,371,520 | 646,728 |
| Events in quadrant C | 3,424,822 | 634,902 |
| Events in quadrant D | 6,201,530 | 585,153 |
| Mode SS | |||
|---|---|---|---|
| Quadrant | BADHDUFLAG | Total packets | Discarded packets |
| A | 0 | 138 | 0 |
| B | 0 | 138 | 0 |
| C | 0 | 138 | 0 |
| D | 0 | 138 | 0 |
| Mode M9 | |||
|---|---|---|---|
| Quadrant | BADHDUFLAG | Total packets | Discarded packets |
| A | 0 | 14 | 0 |
| B | 0 | 14 | 0 |
| C | 0 | 14 | 0 |
| D | 0 | 14 | 0 |
| Mode M0 | |||
|---|---|---|---|
| Quadrant | BADHDUFLAG | Total packets | Discarded packets |
| A | 0 | 14083 | 3 |
| B | 0 | 14415 | 2 |
| C | 0 | 14256 | 2 |
| D | 0 | 23096 | 2 |
| Quadrant | Total seconds | Saturated seconds | Saturation percentage |
|---|---|---|---|
| A | 6793 | 39 | 0.574120% |
| B | 6793 | 53 | 0.780215% |
| C | 6793 | 23 | 0.338584% |
| D | 6793 | 688 | 10.128073% |
Noise dominated data is calculated using 1-second bins in cleaned event files. If a bin has >2000 counts, and if more than 50% of those come from <1% of pixels, then it is considered to be noise-dominated and hence unusable.
| Quadrant | # 1 sec bins | Bins with >0 counts | Bins with >2000 counts | High rate bins dominated by noise | Noise dominated (total time) | Noise dominated (detector-on time) | Marked lightcurve |
|---|---|---|---|---|---|---|---|
| A | 7904 | 6794 | 1 | 1 | 0.01% | 0.01% | 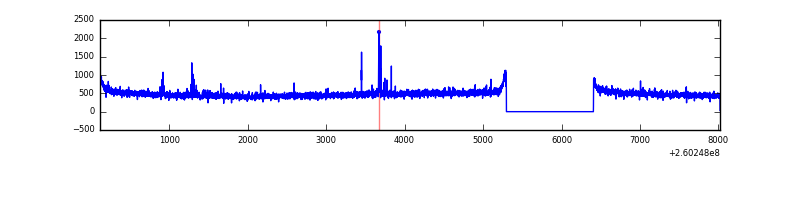 |
| B | 7904 | 6794 | 2 | 2 | 0.03% | 0.03% | 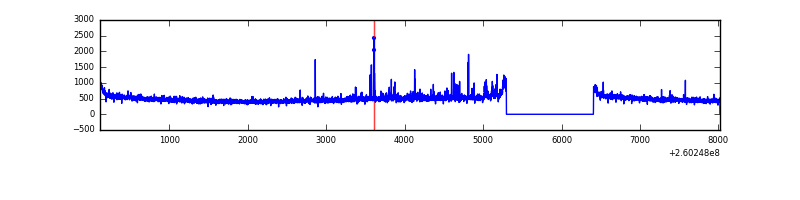 |
| C | 7904 | 6794 | 0 | 0 | 0.00% | 0.00% | 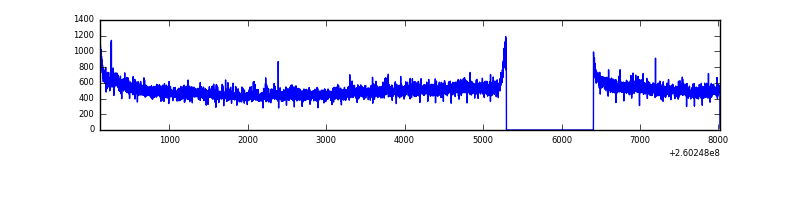 |
| D | 7904 | 6794 | 611 | 611 | 7.73% | 8.99% | 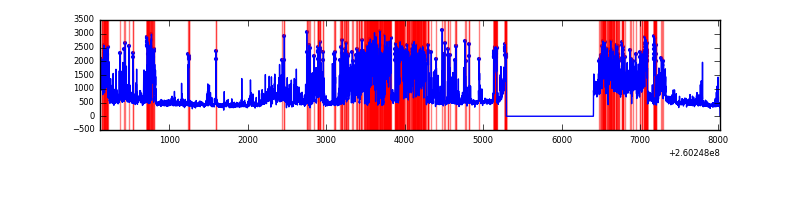 |
Top three noisy pixels from each quadrant. If the there are fewer than three noisy pixels in the level2.evt file, extra rows are filled as -1
| Pixel properties | Quadrant properties | ||||||
|---|---|---|---|---|---|---|---|
| Quadrant | DetID | PixID | Counts | Sigma | Mean | Median | Sigma |
| A | 9 | 143 | 31009 | 176.79 | 835 | 819 | 170.8 |
| A | 1 | 162 | 14446 | 79.8 | 835 | 819 | 170.8 |
| A | 0 | 226 | 7566 | 39.51 | 835 | 819 | 170.8 |
| B | 0 | 189 | 45213 | 279.46 | 834 | 814 | 158.9 |
| B | 4 | 142 | 25439 | 154.99 | 834 | 814 | 158.9 |
| B | 3 | 209 | 19765 | 119.28 | 834 | 814 | 158.9 |
| C | 3 | 233 | 276564 | 1475.46 | 807 | 813 | 186.9 |
| C | 13 | 61 | 5722 | 26.26 | 807 | 813 | 186.9 |
| C | 8 | 222 | 3309 | 13.35 | 807 | 813 | 186.9 |
| D | 5 | 222 | 2422478 | 12939.21 | 773 | 753 | 187.2 |
| D | 13 | 122 | 253318 | 1349.45 | 773 | 753 | 187.2 |
| D | 13 | 249 | 189991 | 1011.09 | 773 | 753 | 187.2 |
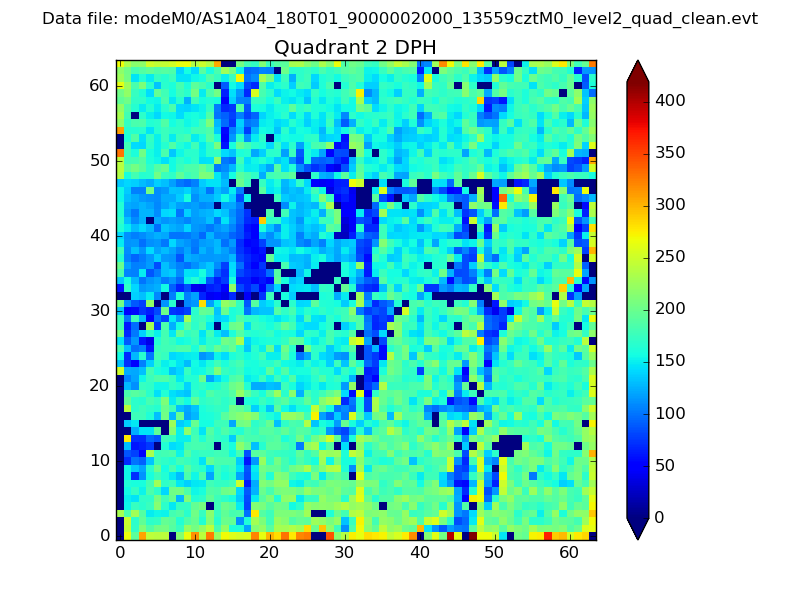
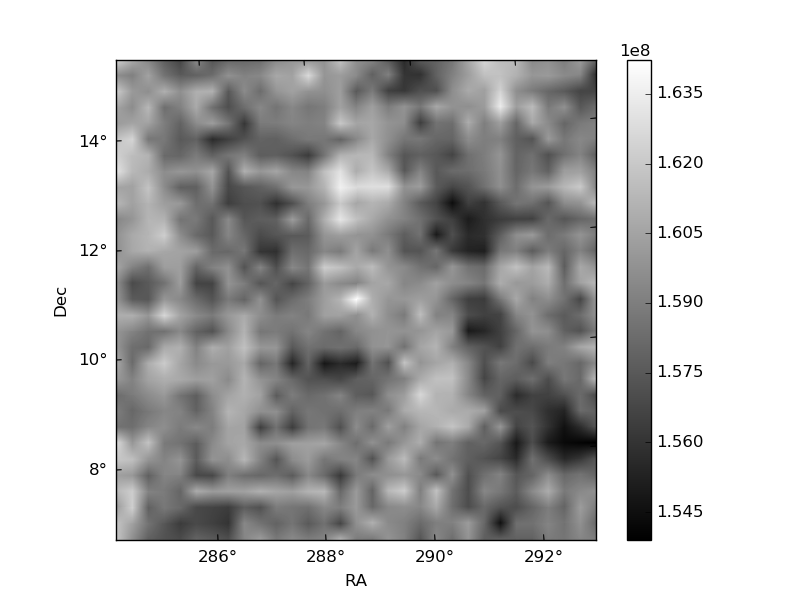
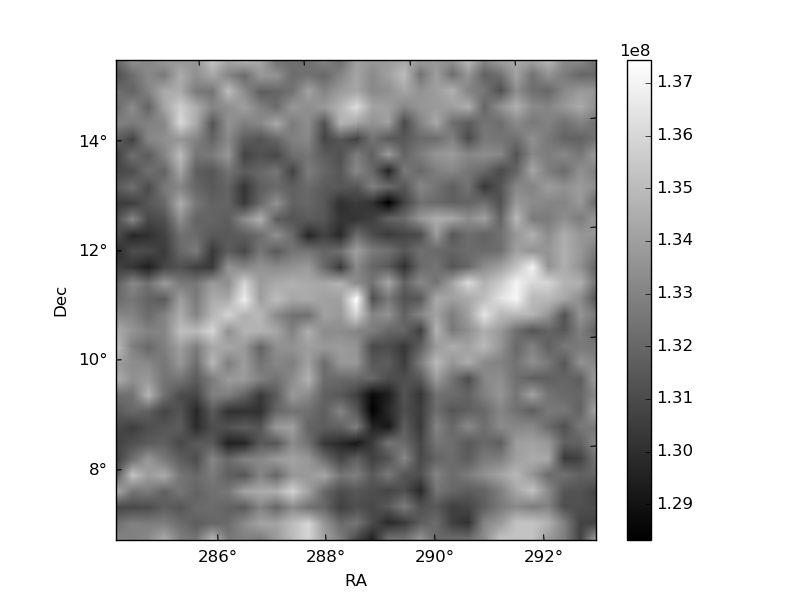
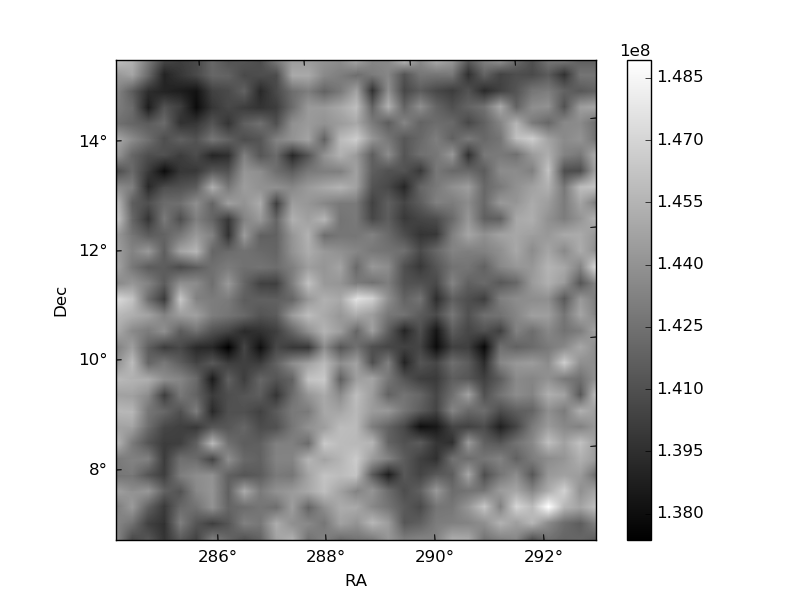
Histogram calculated using DETX and DETY for each event in the final _common_clean file
| Quadrant A | 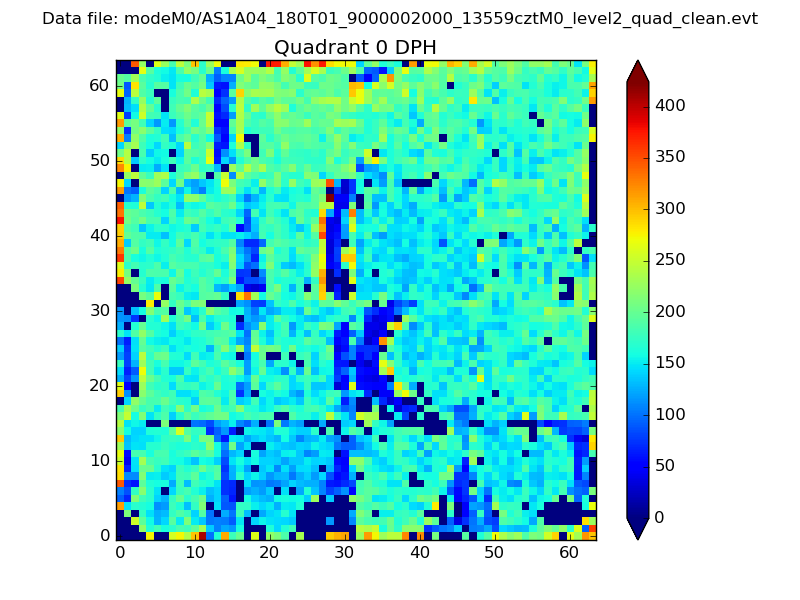 |
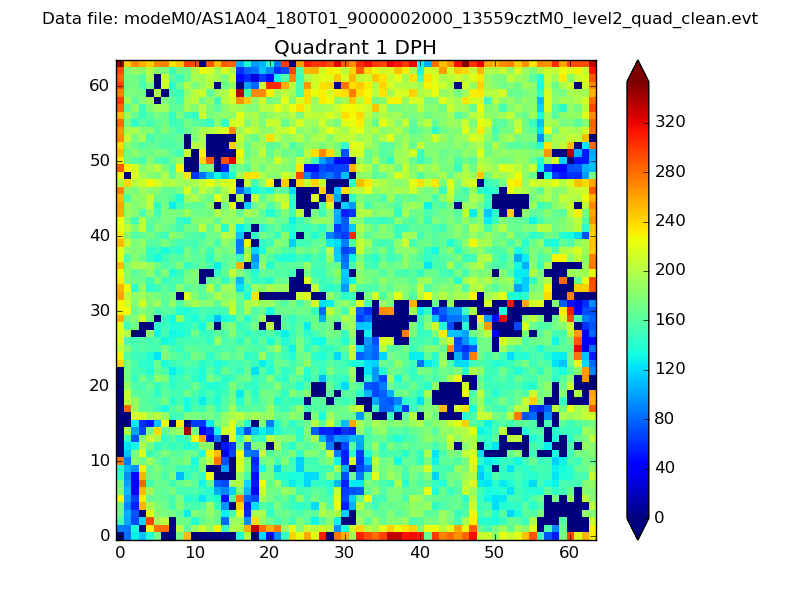 |
Quadrant B |
|---|---|---|---|
| Quadrant D | 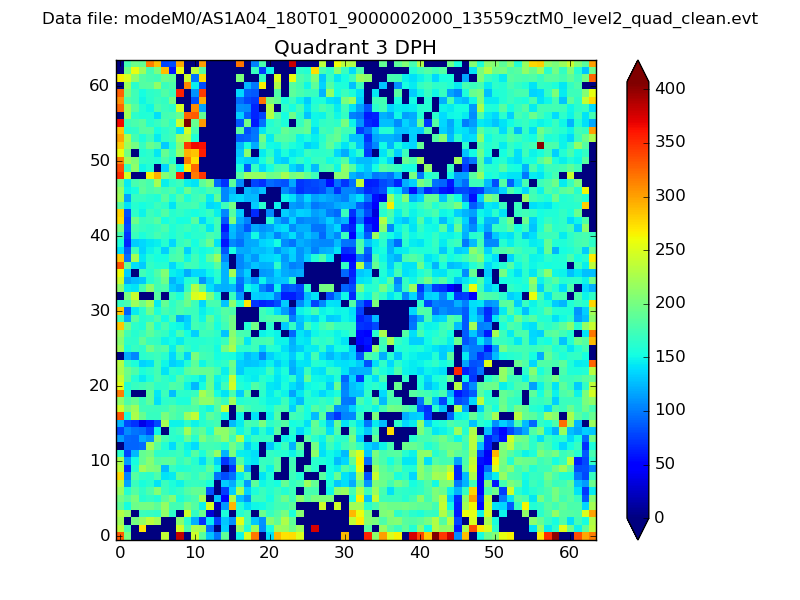 |
 |
Quadrant C |
| Plot type | Count rate plots | Images |
|---|---|---|
| Comparison with Poisson distribution Blue bars denote a histogram of data divided into 1 sec bins. Red curve is a Poisson curve with rate = median count rate of data. |
 |
 |
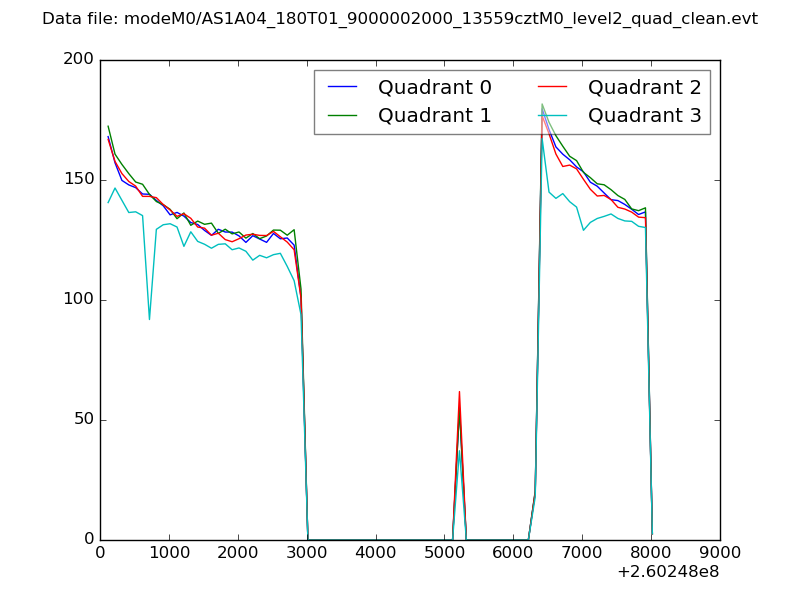
| Quadrant-wise count rates Data is divided into 100 sec bins |
 |
|
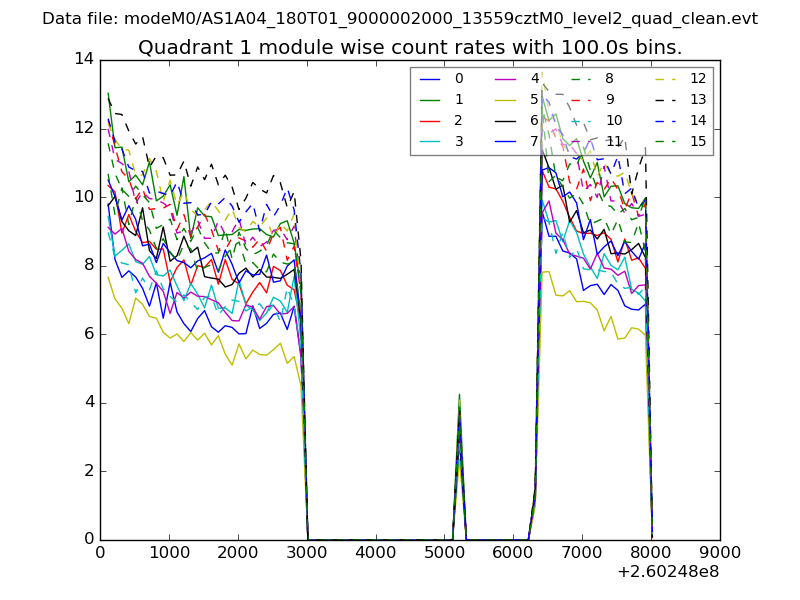
| Module-wise count rates for Quadrant A Data is divided into 100 sec bins |
 |
 |
| Module-wise count rates for Quadrant B Data is divided into 100 sec bins |
 |
 |
| Module-wise count rates for Quadrant C Data is divided into 100 sec bins |
 |
 |
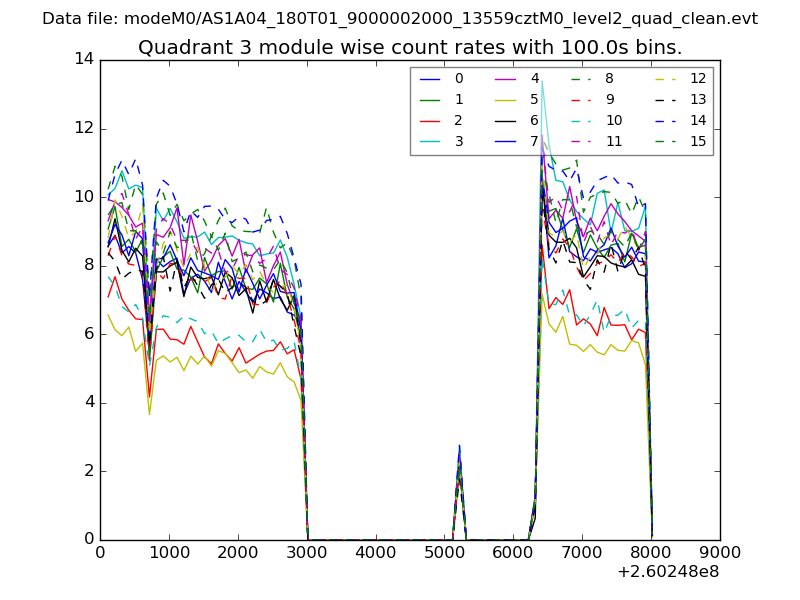
| Module-wise count rates for Quadrant D Data is divided into 100 sec bins |
 |
 |
| Parameter | Plot |
|---|---|
| CZT HV Monitor | 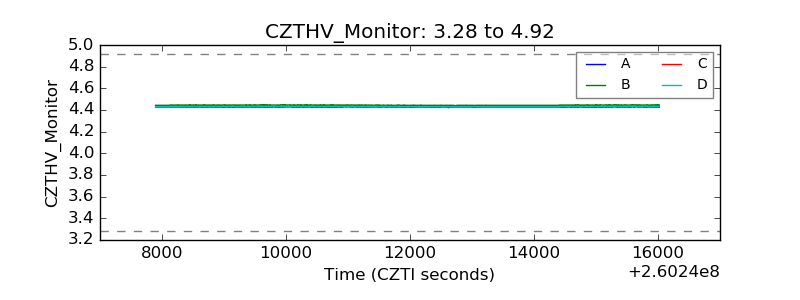 |
| D_VDD | 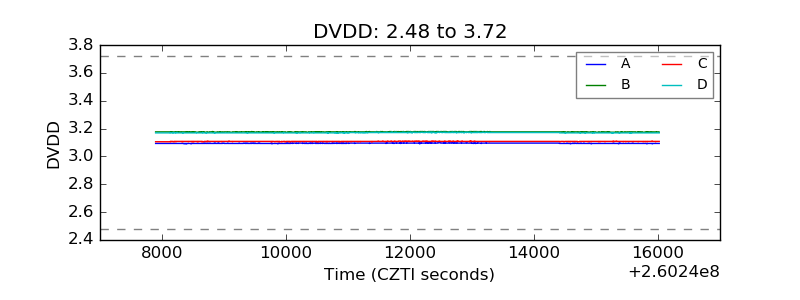 |
| Temperature 1 |  |
| Veto HV Monitor | 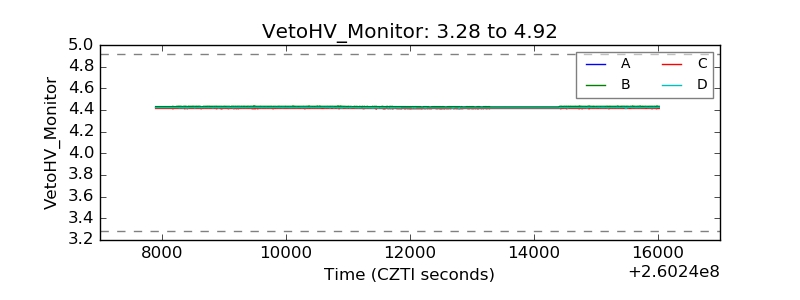 |
| Veto LLD |  |
| Alpha Counter | 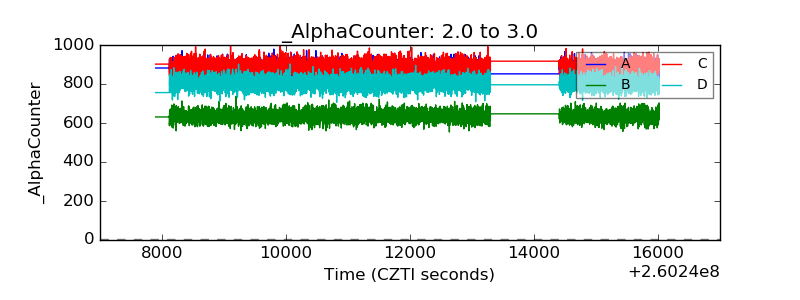 |
| _CPM_Rate | 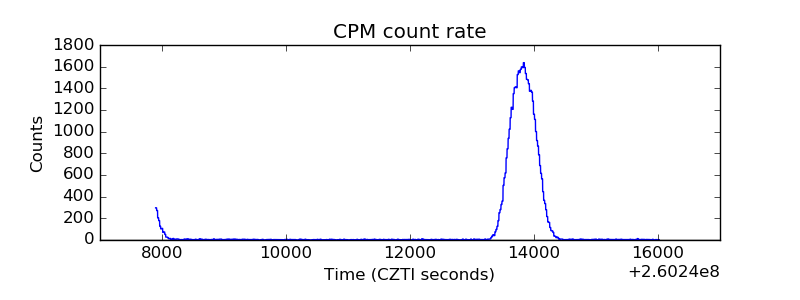 |
| CZT Counter | 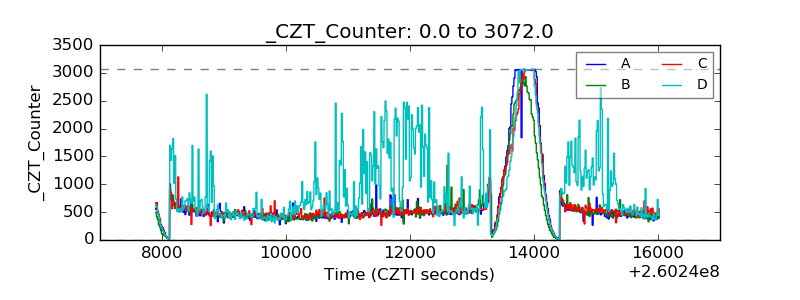 |
| +2.5 Volts monitor |  |
| +5 Volts monitor | 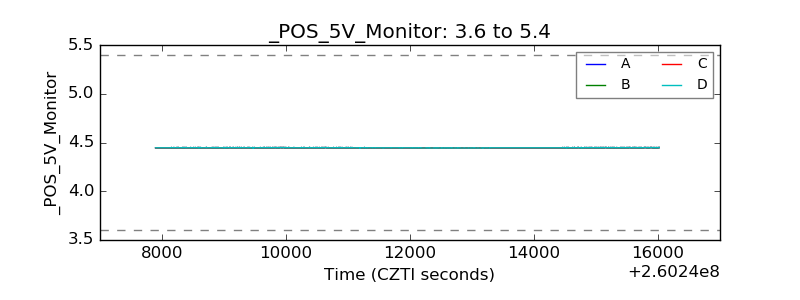 |
| _ROLL_ROT | 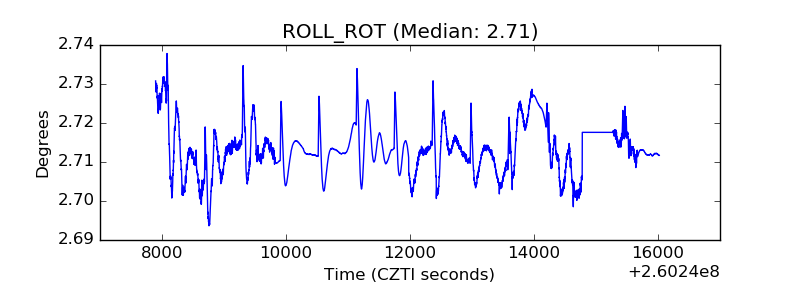 |
| _Roll_DEC |  |
| _Roll_RA | 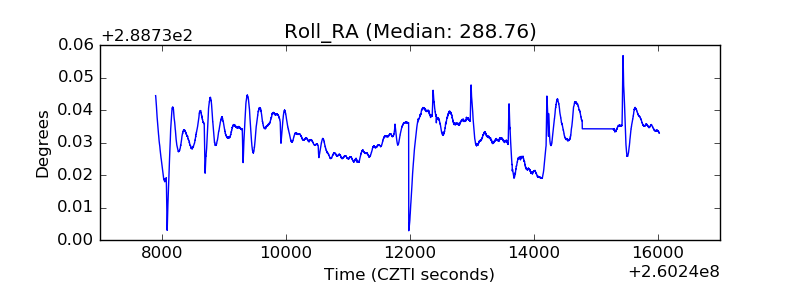 |
| Veto Counter | 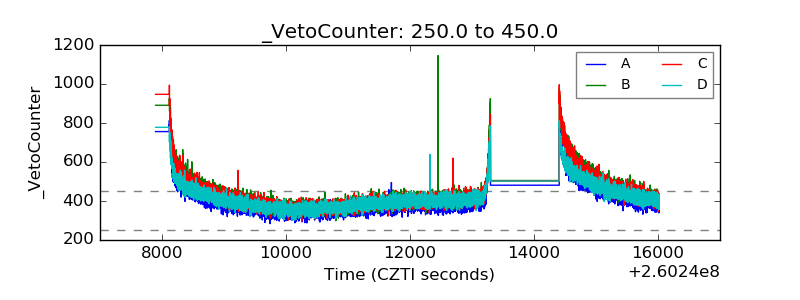 |