| Param | Original file | Final file |
|---|---|---|
| Filename | modeM0/AS1A04_180T01_9000002000_13560cztM0_level2.evt | modeM0/AS1A04_180T01_9000002000_13560cztM0_level2_quad_clean.evt |
| Size (bytes) | 409,449,600 | 81,072,000 |
| Size | 390.5 MB | 77.3 MB |
| Events in quadrant A | 2,860,227 | 521,206 |
| Events in quadrant B | 2,950,865 | 526,205 |
| Events in quadrant C | 3,062,037 | 513,803 |
| Events in quadrant D | 3,135,053 | 490,678 |
| Mode SS | |||
|---|---|---|---|
| Quadrant | BADHDUFLAG | Total packets | Discarded packets |
| A | 0 | 118 | 0 |
| B | 0 | 118 | 0 |
| C | 0 | 118 | 0 |
| D | 0 | 118 | 0 |
| Mode M9 | |||
|---|---|---|---|
| Quadrant | BADHDUFLAG | Total packets | Discarded packets |
| A | 0 | 12 | 0 |
| B | 0 | 12 | 0 |
| C | 0 | 12 | 0 |
| D | 0 | 12 | 0 |
| Mode M0 | |||
|---|---|---|---|
| Quadrant | BADHDUFLAG | Total packets | Discarded packets |
| A | 0 | 12067 | 2 |
| B | 0 | 12342 | 1 |
| C | 0 | 12339 | 1 |
| D | 0 | 13175 | 1 |
| Quadrant | Total seconds | Saturated seconds | Saturation percentage |
|---|---|---|---|
| A | 5764 | 75 | 1.301180% |
| B | 5764 | 73 | 1.266482% |
| C | 5764 | 50 | 0.867453% |
| D | 5764 | 76 | 1.318529% |
Noise dominated data is calculated using 1-second bins in cleaned event files. If a bin has >2000 counts, and if more than 50% of those come from <1% of pixels, then it is considered to be noise-dominated and hence unusable.
| Quadrant | # 1 sec bins | Bins with >0 counts | Bins with >2000 counts | High rate bins dominated by noise | Noise dominated (total time) | Noise dominated (detector-on time) | Marked lightcurve |
|---|---|---|---|---|---|---|---|
| A | 6950 | 5765 | 22 | 22 | 0.32% | 0.38% | 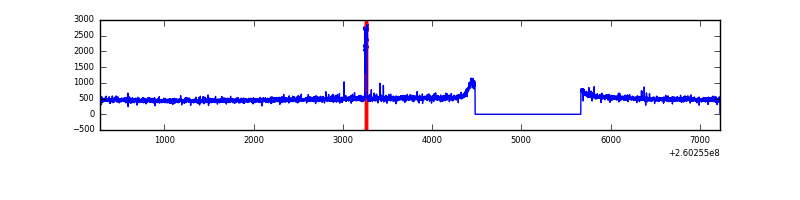 |
| B | 6950 | 5765 | 5 | 5 | 0.07% | 0.09% | 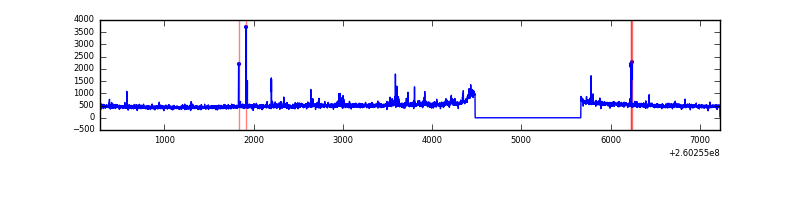 |
| C | 6950 | 5765 | 2 | 2 | 0.03% | 0.03% | 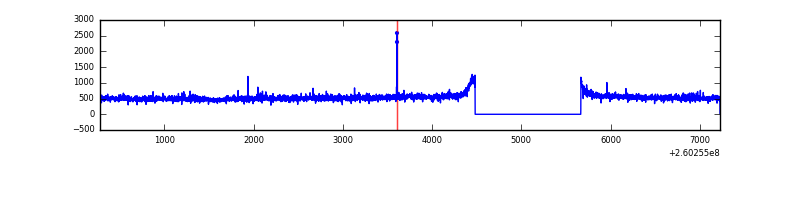 |
| D | 6950 | 5765 | 37 | 37 | 0.53% | 0.64% | 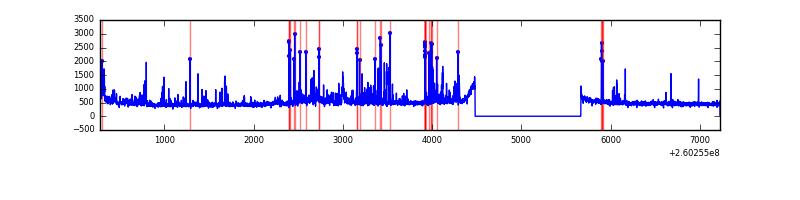 |
Top three noisy pixels from each quadrant. If the there are fewer than three noisy pixels in the level2.evt file, extra rows are filled as -1
| Pixel properties | Quadrant properties | ||||||
|---|---|---|---|---|---|---|---|
| Quadrant | DetID | PixID | Counts | Sigma | Mean | Median | Sigma |
| A | 4 | 2 | 52086 | 345.32 | 727 | 714 | 148.8 |
| A | 1 | 162 | 9431 | 58.6 | 727 | 714 | 148.8 |
| A | 0 | 226 | 6681 | 40.11 | 727 | 714 | 148.8 |
| B | 3 | 64 | 45449 | 323.86 | 723 | 706 | 138.2 |
| B | 3 | 209 | 29589 | 209.06 | 723 | 706 | 138.2 |
| B | 12 | 111 | 14856 | 102.42 | 723 | 706 | 138.2 |
| C | 3 | 233 | 328535 | 2032.43 | 698 | 705 | 161.3 |
| C | 14 | 234 | 7272 | 40.71 | 698 | 705 | 161.3 |
| C | 13 | 61 | 5024 | 26.78 | 698 | 705 | 161.3 |
| D | 5 | 222 | 215387 | 1281.84 | 698 | 682 | 167.5 |
| D | 13 | 249 | 140623 | 835.48 | 698 | 682 | 167.5 |
| D | 12 | 110 | 64128 | 378.79 | 698 | 682 | 167.5 |
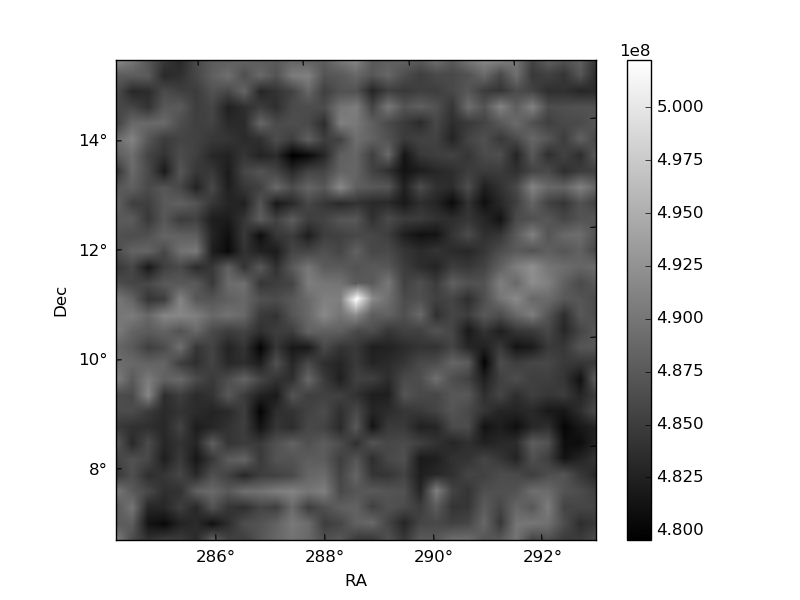
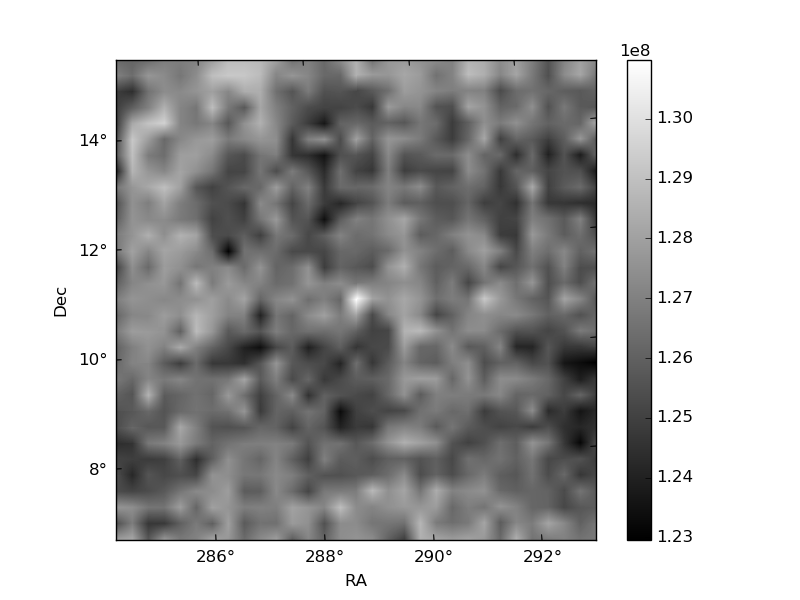
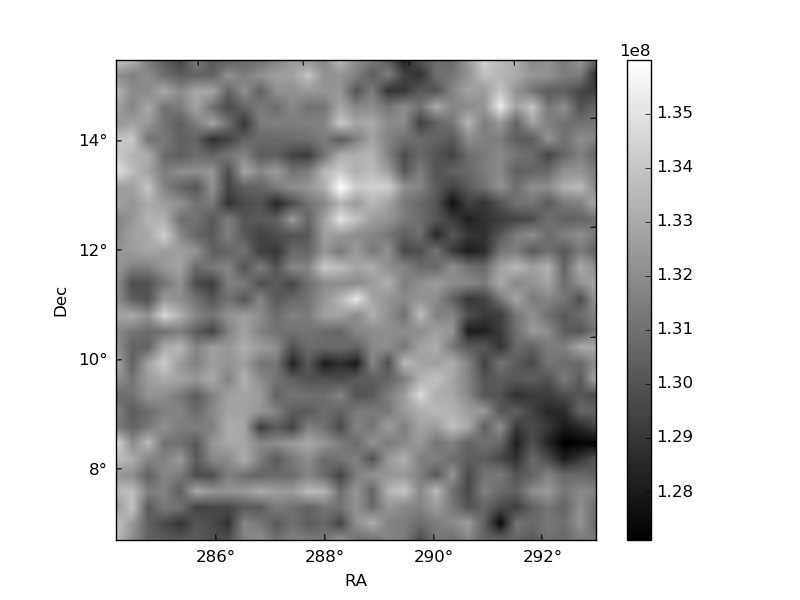
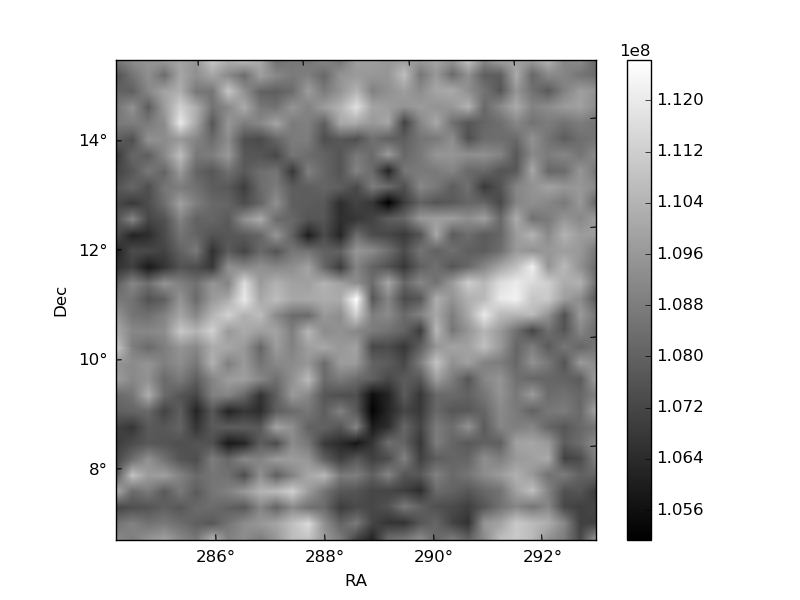
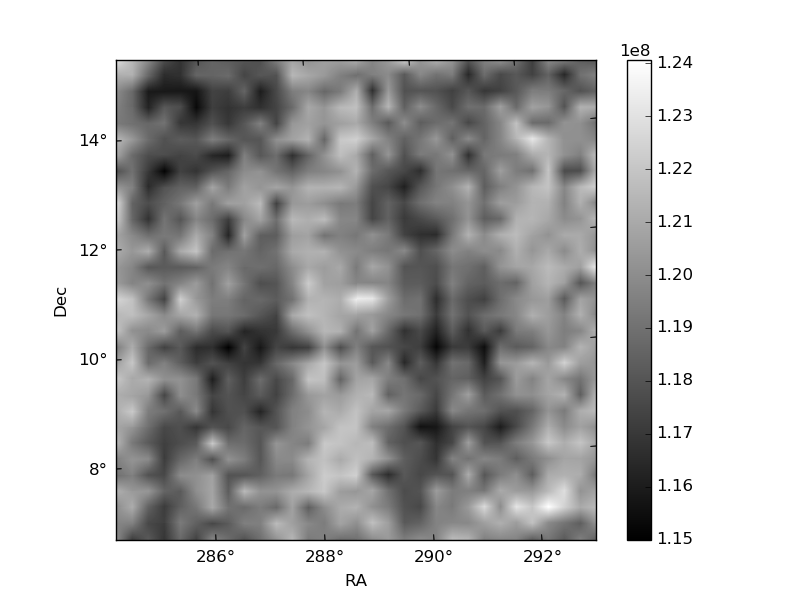
Histogram calculated using DETX and DETY for each event in the final _common_clean file
| Quadrant A | 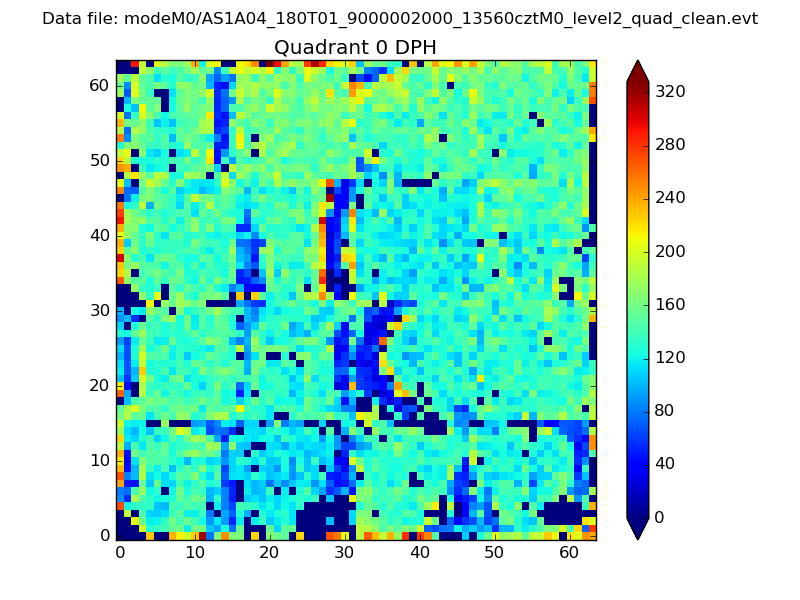 |
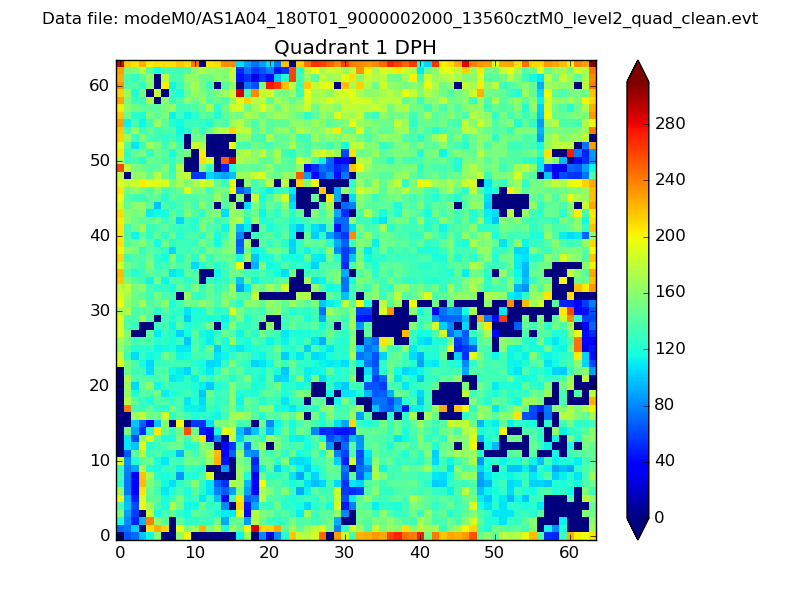 |
Quadrant B |
|---|---|---|---|
| Quadrant D | 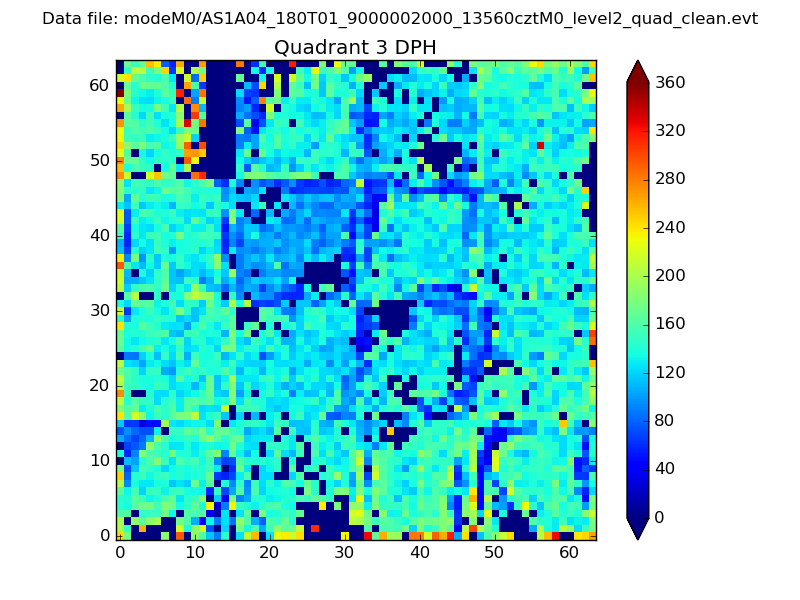 |
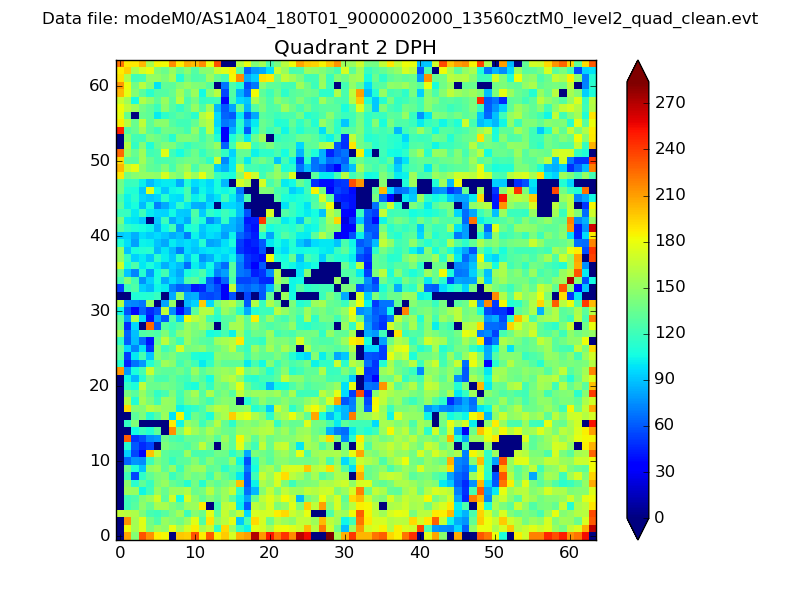 |
Quadrant C |
| Plot type | Count rate plots | Images |
|---|---|---|
| Comparison with Poisson distribution Blue bars denote a histogram of data divided into 1 sec bins. Red curve is a Poisson curve with rate = median count rate of data. |
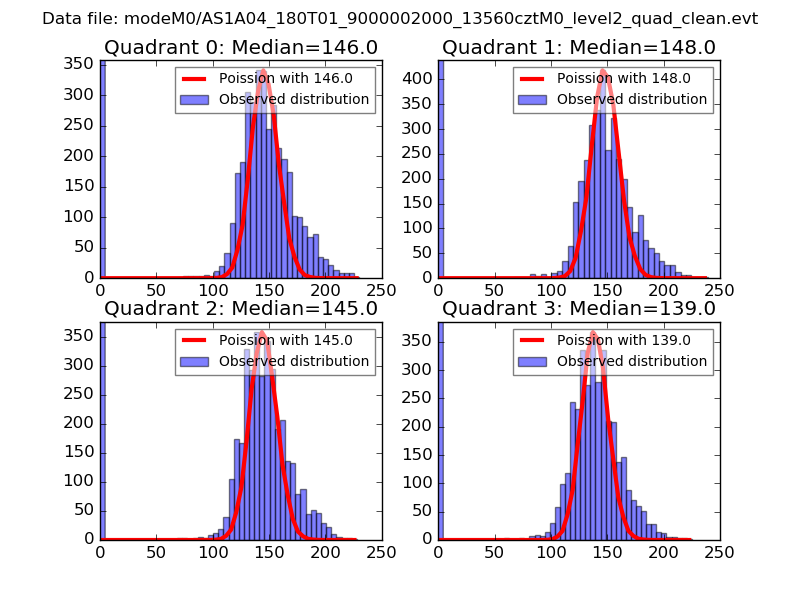 |
 |
| Quadrant-wise count rates Data is divided into 100 sec bins |
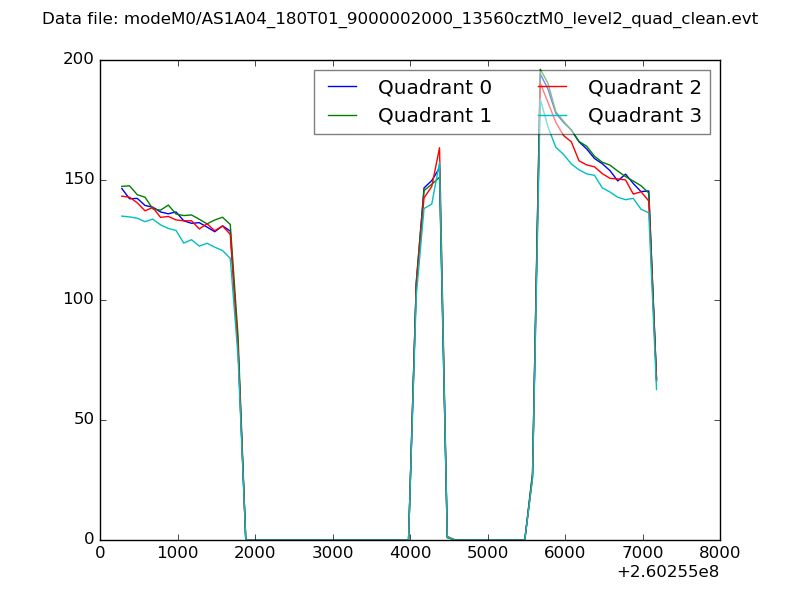 |
|
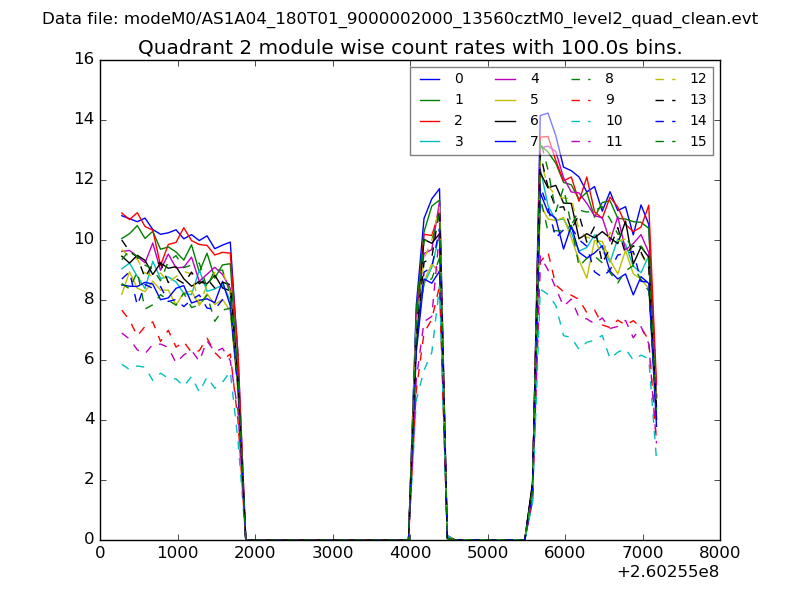
| Module-wise count rates for Quadrant A Data is divided into 100 sec bins |
 |
 |
| Module-wise count rates for Quadrant B Data is divided into 100 sec bins |
 |
 |
| Module-wise count rates for Quadrant C Data is divided into 100 sec bins |
 |
 |
| Module-wise count rates for Quadrant D Data is divided into 100 sec bins |
 |
 |
| Parameter | Plot |
|---|---|
| CZT HV Monitor | 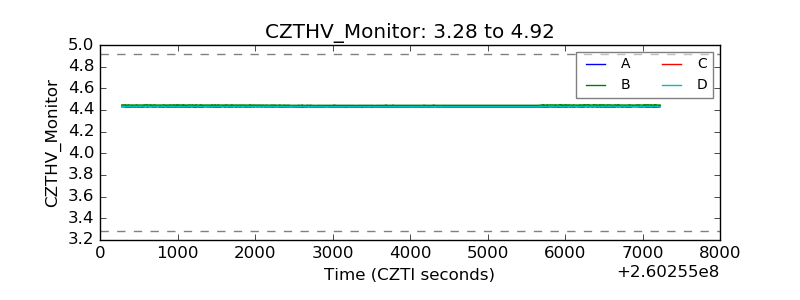 |
| D_VDD | 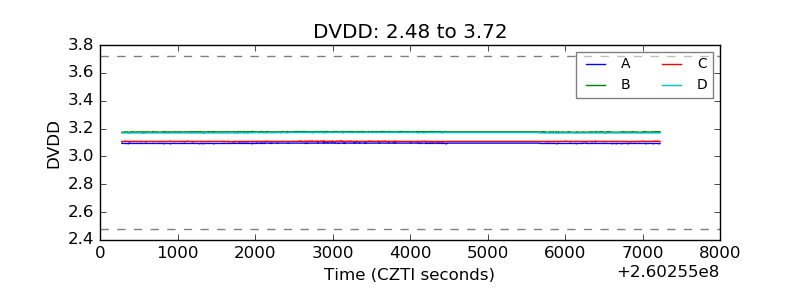 |
| Temperature 1 | 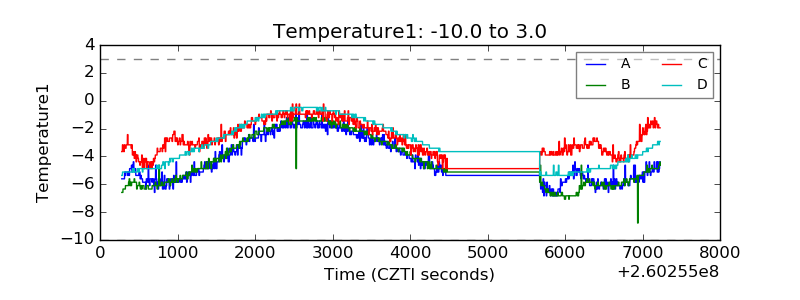 |
| Veto HV Monitor | 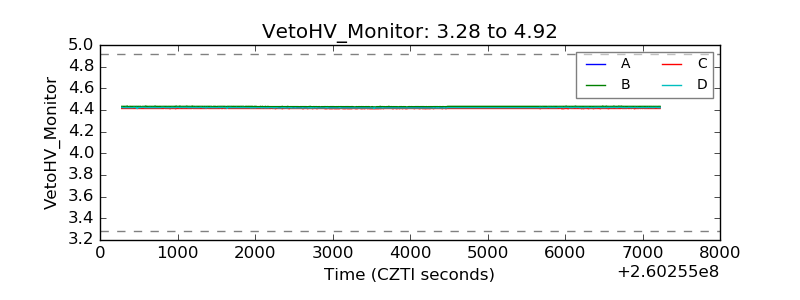 |
| Veto LLD | 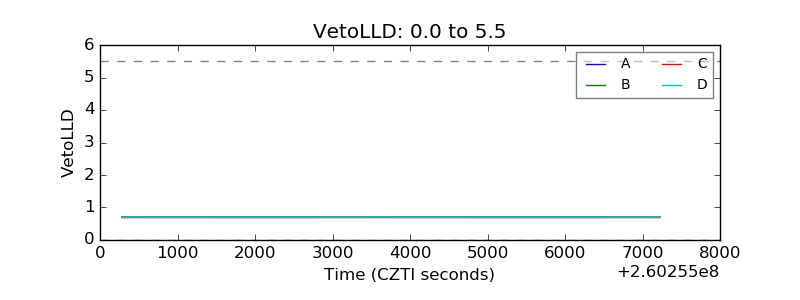 |
| Alpha Counter | 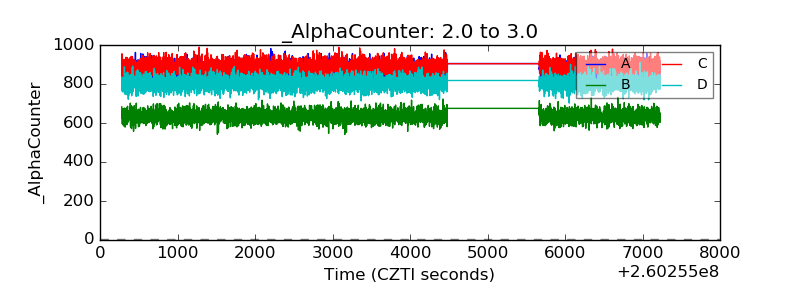 |
| _CPM_Rate | 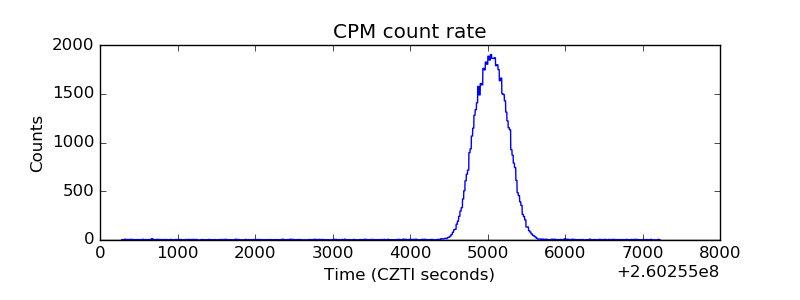 |
| CZT Counter | 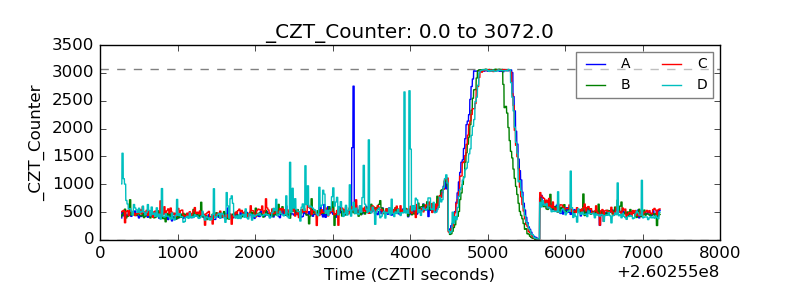 |
| +2.5 Volts monitor |  |
| +5 Volts monitor |  |
| _ROLL_ROT | 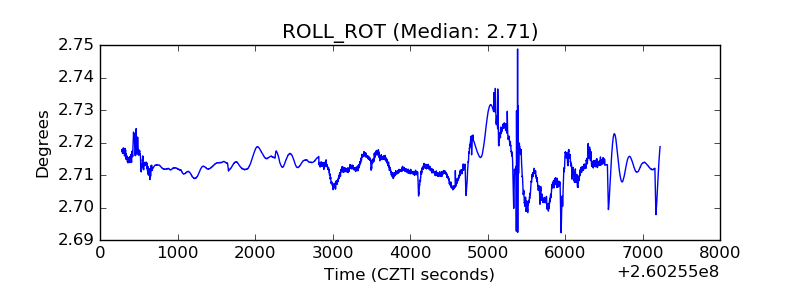 |
| _Roll_DEC | 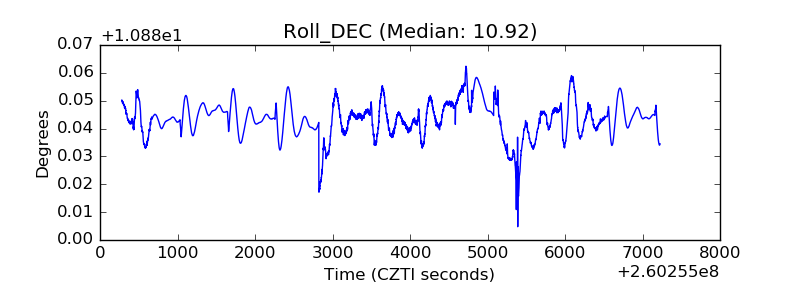 |
| _Roll_RA | 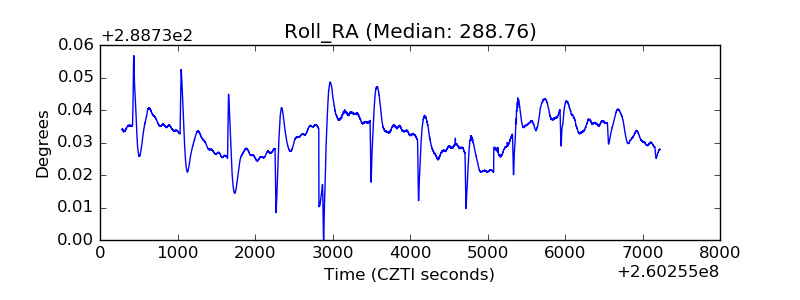 |
| Veto Counter | 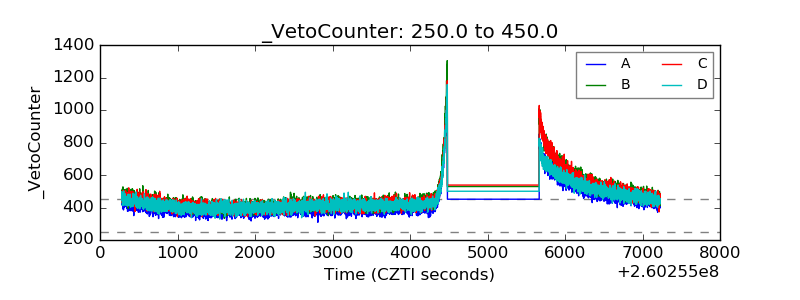 |