| Param | Original file | Final file |
|---|---|---|
| Filename | modeM0/AS1A04_180T01_9000002000_13561cztM0_level2.evt | modeM0/AS1A04_180T01_9000002000_13561cztM0_level2_quad_clean.evt |
| Size (bytes) | 443,246,400 | 80,988,480 |
| Size | 422.7 MB | 77.2 MB |
| Events in quadrant A | 2,873,414 | 527,022 |
| Events in quadrant B | 3,005,559 | 530,454 |
| Events in quadrant C | 2,993,434 | 519,011 |
| Events in quadrant D | 4,168,655 | 481,801 |
| Mode SS | |||
|---|---|---|---|
| Quadrant | BADHDUFLAG | Total packets | Discarded packets |
| A | 0 | 116 | 0 |
| B | 0 | 116 | 0 |
| C | 0 | 116 | 0 |
| D | 0 | 116 | 0 |
| Mode M9 | |||
|---|---|---|---|
| Quadrant | BADHDUFLAG | Total packets | Discarded packets |
| A | 0 | 12 | 0 |
| B | 0 | 12 | 0 |
| C | 0 | 12 | 0 |
| D | 0 | 12 | 0 |
| Mode M0 | |||
|---|---|---|---|
| Quadrant | BADHDUFLAG | Total packets | Discarded packets |
| A | 0 | 11810 | 2 |
| B | 0 | 12154 | 1 |
| C | 0 | 12041 | 1 |
| D | 0 | 15979 | 1 |
| Quadrant | Total seconds | Saturated seconds | Saturation percentage |
|---|---|---|---|
| A | 5630 | 49 | 0.870337% |
| B | 5630 | 72 | 1.278863% |
| C | 5630 | 37 | 0.657194% |
| D | 5630 | 405 | 7.193606% |
Noise dominated data is calculated using 1-second bins in cleaned event files. If a bin has >2000 counts, and if more than 50% of those come from <1% of pixels, then it is considered to be noise-dominated and hence unusable.
| Quadrant | # 1 sec bins | Bins with >0 counts | Bins with >2000 counts | High rate bins dominated by noise | Noise dominated (total time) | Noise dominated (detector-on time) | Marked lightcurve |
|---|---|---|---|---|---|---|---|
| A | 6891 | 5631 | 0 | 0 | 0.00% | 0.00% | 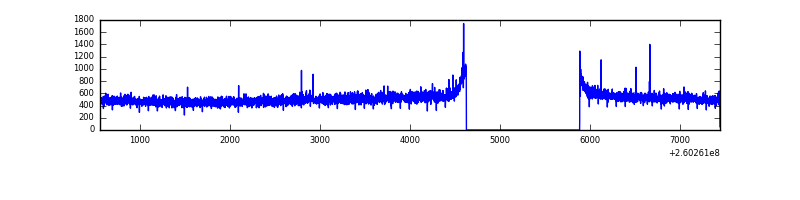 |
| B | 6891 | 5631 | 8 | 8 | 0.12% | 0.14% | 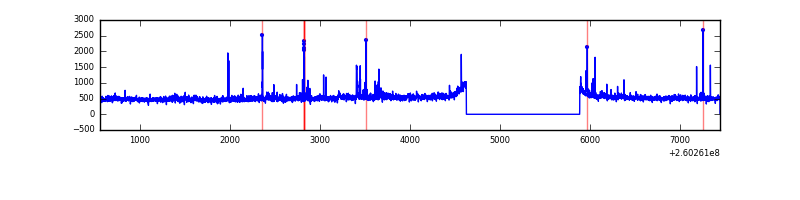 |
| C | 6891 | 5631 | 0 | 0 | 0.00% | 0.00% | 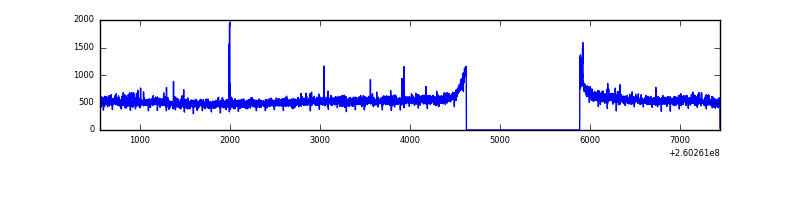 |
| D | 6891 | 5631 | 337 | 337 | 4.89% | 5.98% | 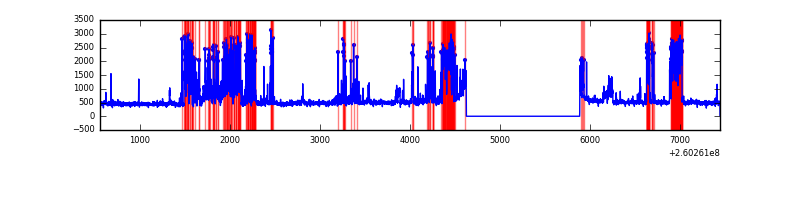 |
Top three noisy pixels from each quadrant. If the there are fewer than three noisy pixels in the level2.evt file, extra rows are filled as -1
| Pixel properties | Quadrant properties | ||||||
|---|---|---|---|---|---|---|---|
| Quadrant | DetID | PixID | Counts | Sigma | Mean | Median | Sigma |
| A | 1 | 162 | 18500 | 118.84 | 738 | 727 | 149.6 |
| A | 0 | 226 | 6769 | 40.4 | 738 | 727 | 149.6 |
| A | 1 | 178 | 5887 | 34.5 | 738 | 727 | 149.6 |
| B | 3 | 64 | 41326 | 291.43 | 728 | 712 | 139.4 |
| B | 0 | 189 | 30786 | 215.8 | 728 | 712 | 139.4 |
| B | 3 | 209 | 28569 | 199.89 | 728 | 712 | 139.4 |
| C | 3 | 233 | 238392 | 1466.66 | 705 | 711 | 162.1 |
| C | 13 | 61 | 5043 | 26.73 | 705 | 711 | 162.1 |
| C | 14 | 234 | 4022 | 20.43 | 705 | 711 | 162.1 |
| D | 5 | 222 | 858857 | 5133.68 | 692 | 675 | 167.2 |
| D | 13 | 122 | 227682 | 1357.97 | 692 | 675 | 167.2 |
| D | 2 | 14 | 187367 | 1116.8 | 692 | 675 | 167.2 |
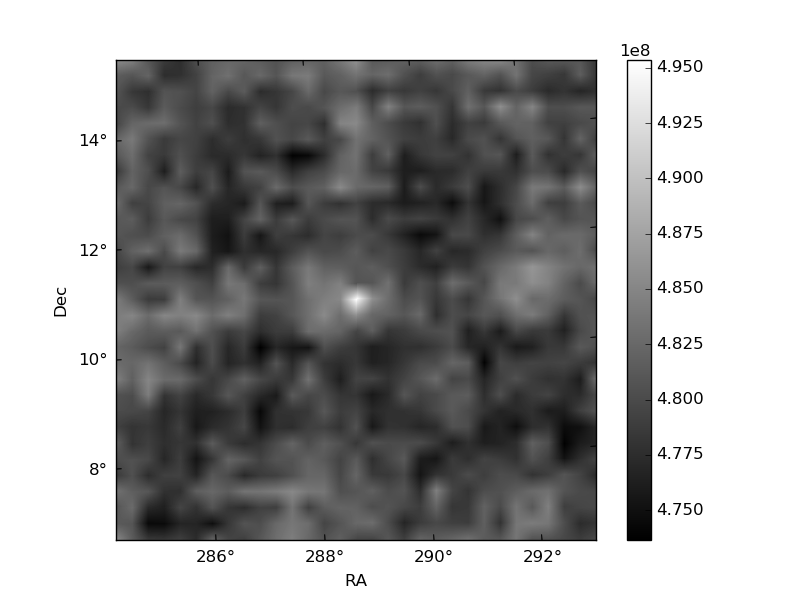
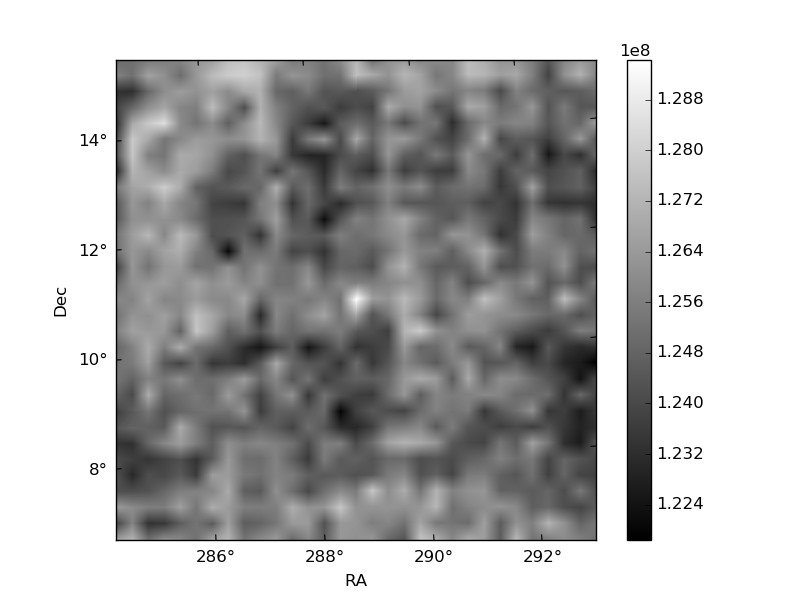
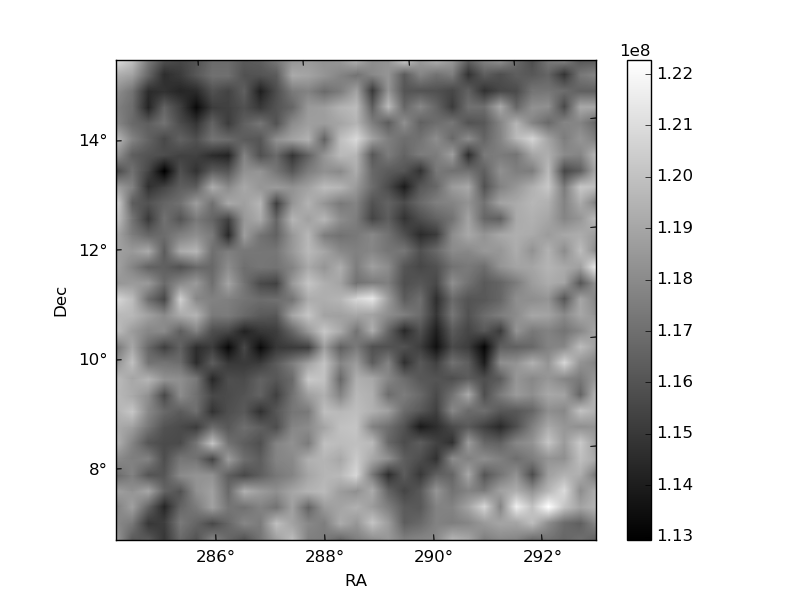
Histogram calculated using DETX and DETY for each event in the final _common_clean file
| Quadrant A | 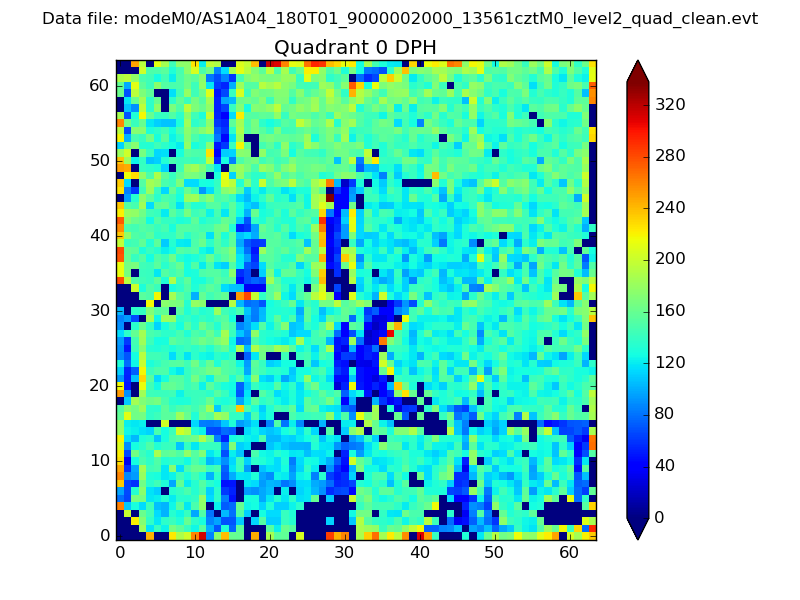 |
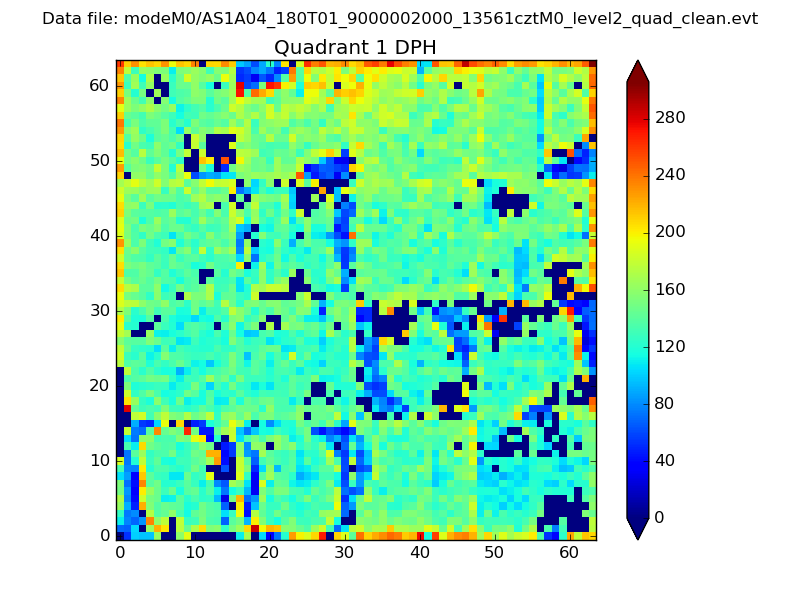 |
Quadrant B |
|---|---|---|---|
| Quadrant D |  |
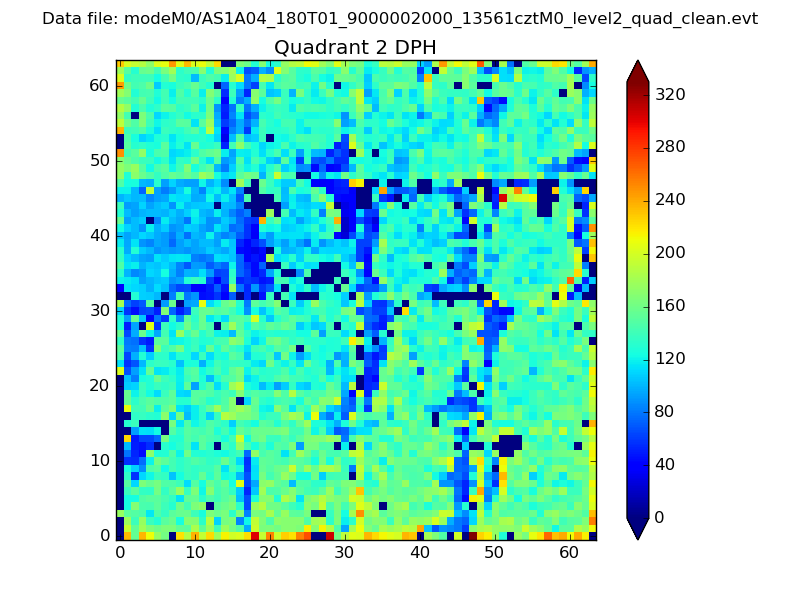 |
Quadrant C |
| Plot type | Count rate plots | Images |
|---|---|---|
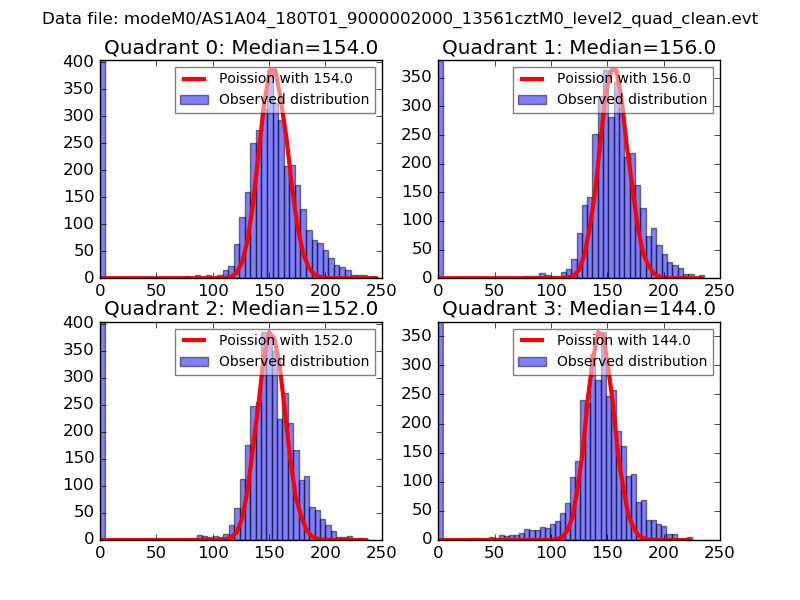
| Comparison with Poisson distribution Blue bars denote a histogram of data divided into 1 sec bins. Red curve is a Poisson curve with rate = median count rate of data. |
 |
 |
| Quadrant-wise count rates Data is divided into 100 sec bins |
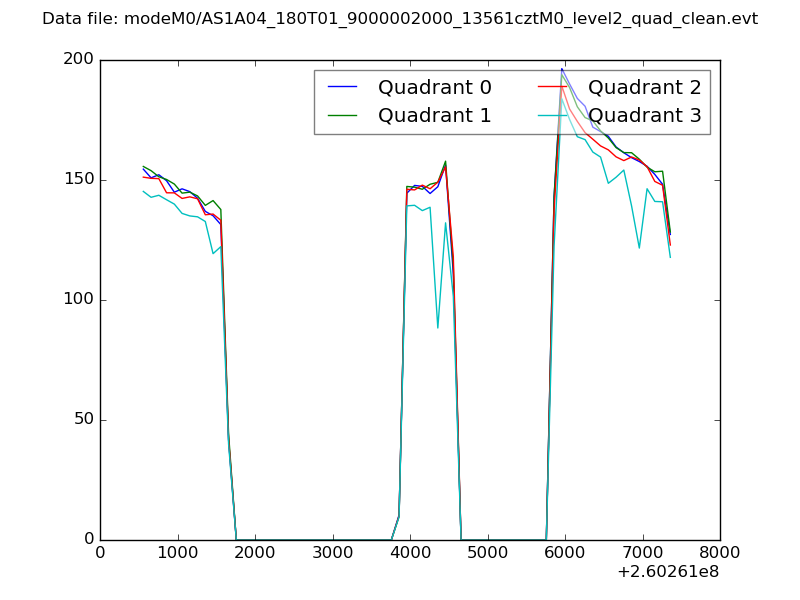 |
|
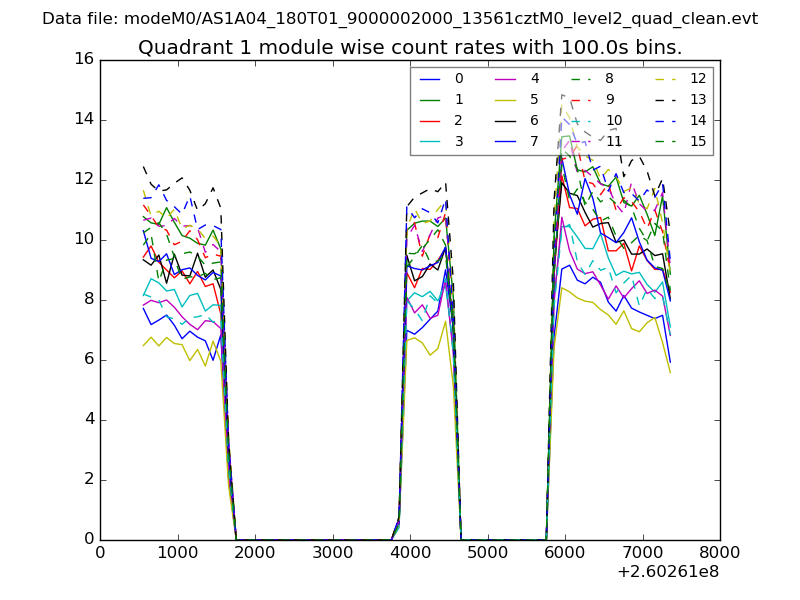
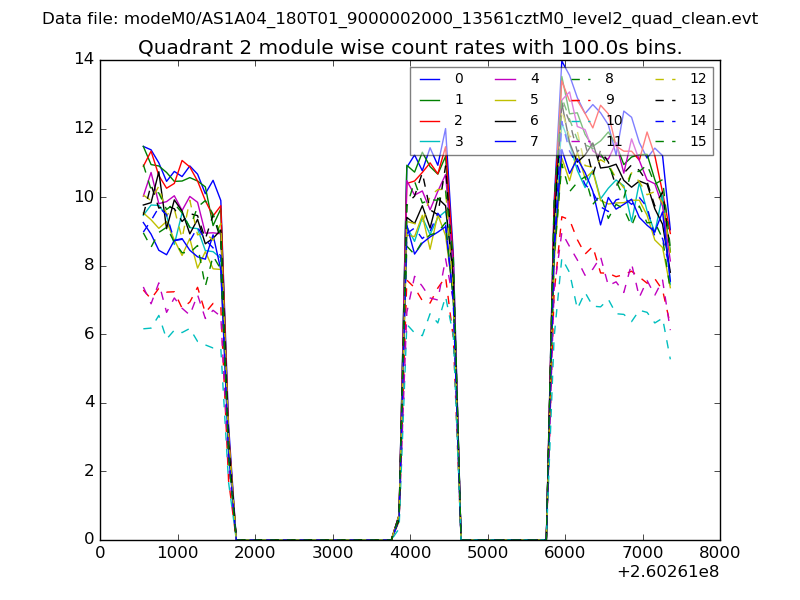
| Module-wise count rates for Quadrant A Data is divided into 100 sec bins |
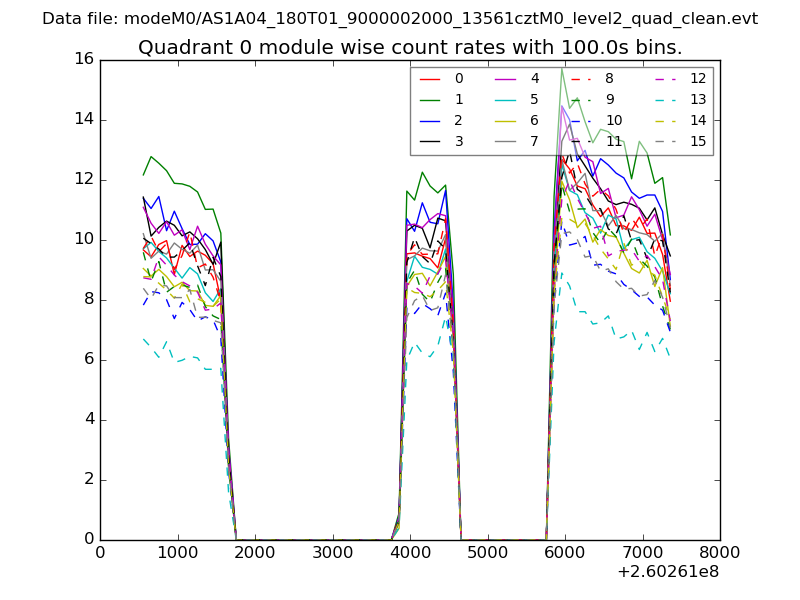 |
 |
| Module-wise count rates for Quadrant B Data is divided into 100 sec bins |
 |
 |
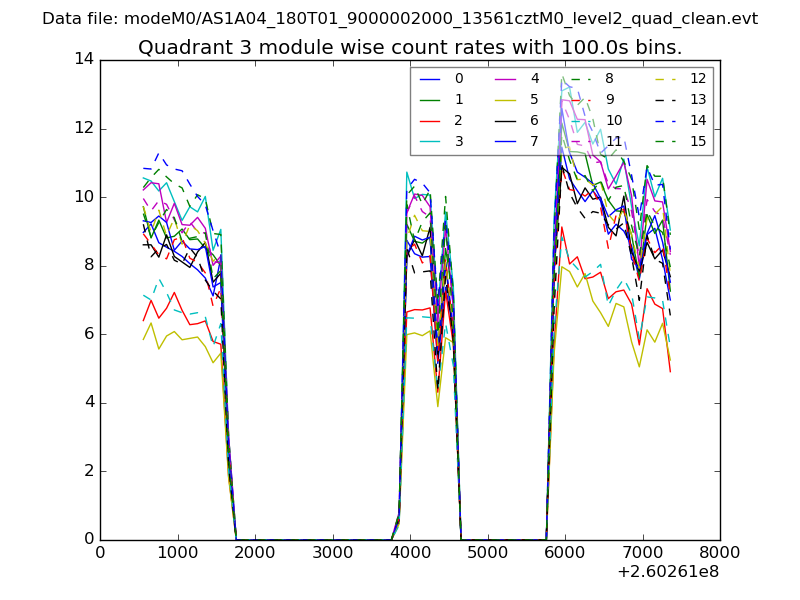
| Module-wise count rates for Quadrant C Data is divided into 100 sec bins |
 |
 |
| Module-wise count rates for Quadrant D Data is divided into 100 sec bins |
 |
 |
| Parameter | Plot |
|---|---|
| CZT HV Monitor | 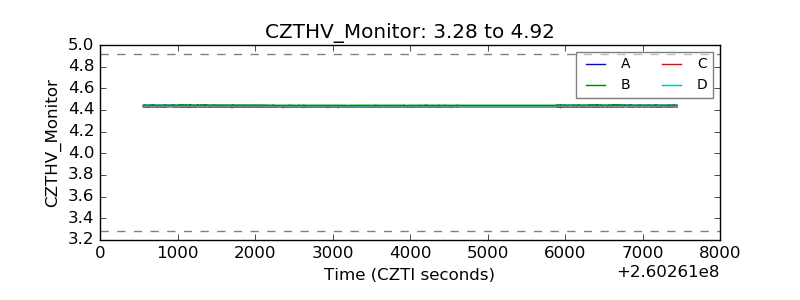 |
| D_VDD | 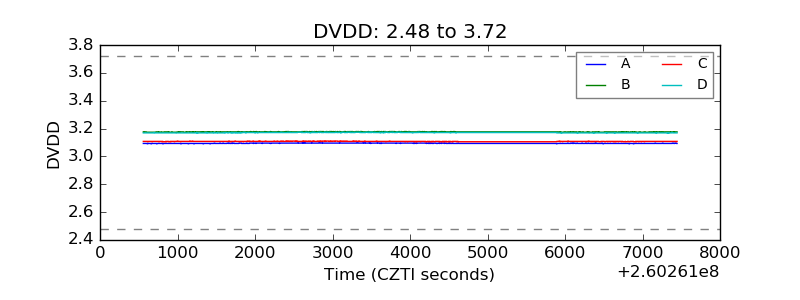 |
| Temperature 1 | 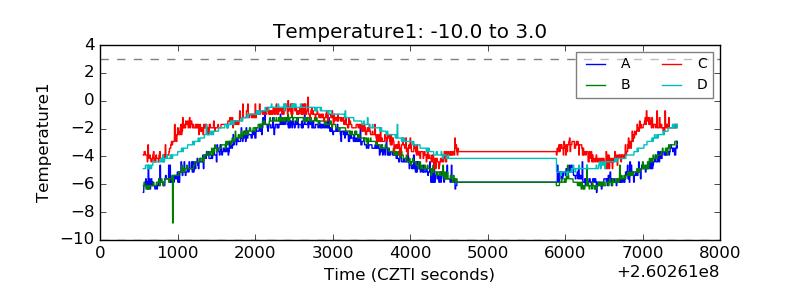 |
| Veto HV Monitor | 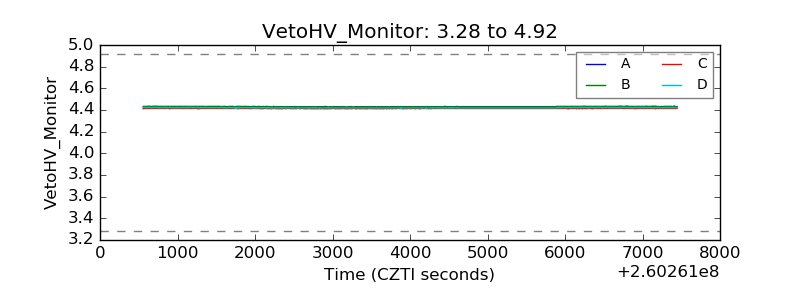 |
| Veto LLD | 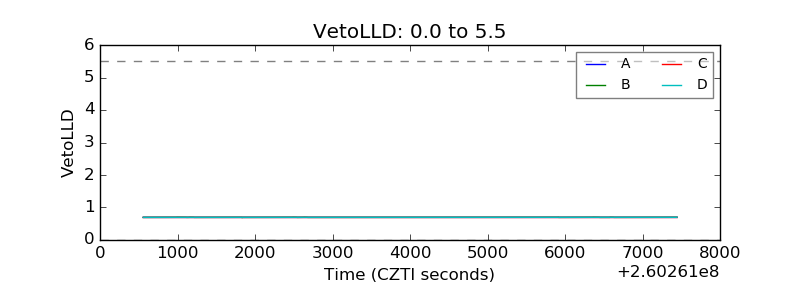 |
| Alpha Counter | 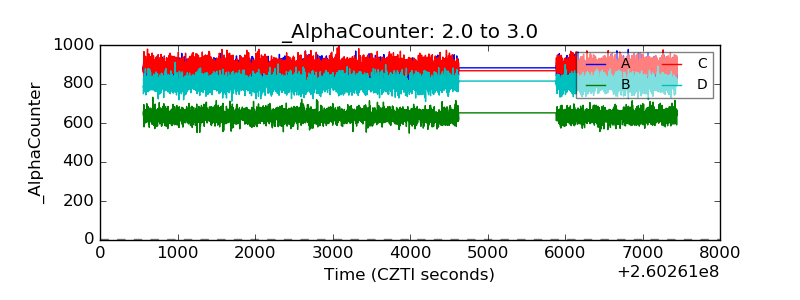 |
| _CPM_Rate | 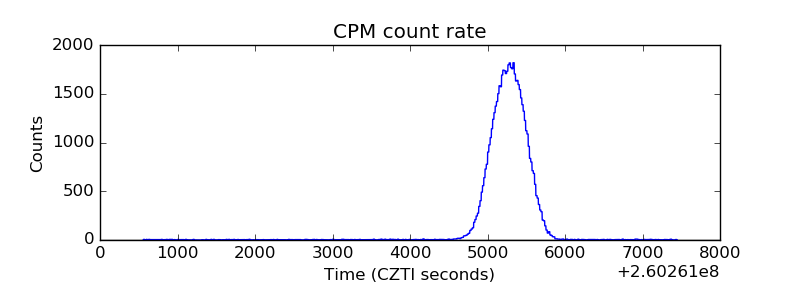 |
| CZT Counter | 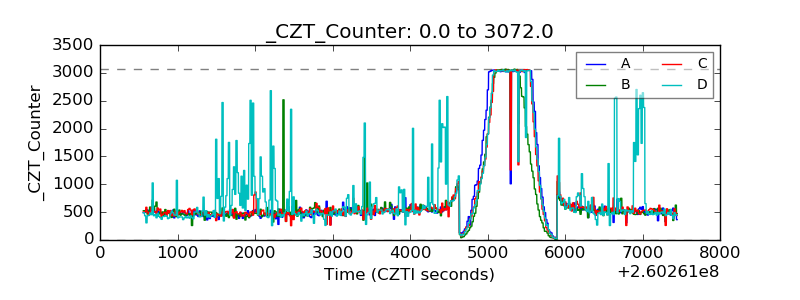 |
| +2.5 Volts monitor |  |
| +5 Volts monitor | 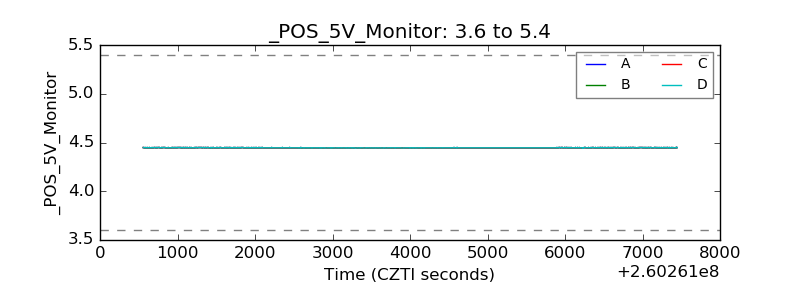 |
| _ROLL_ROT | 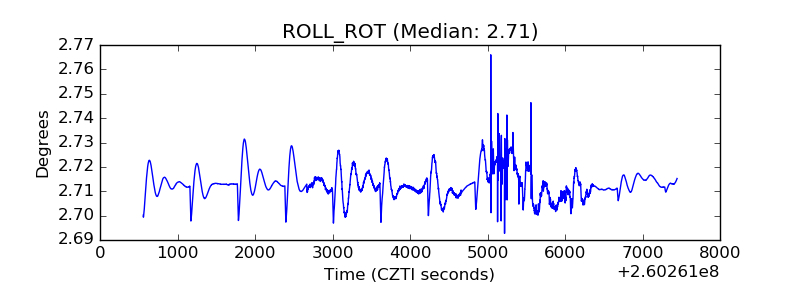 |
| _Roll_DEC | 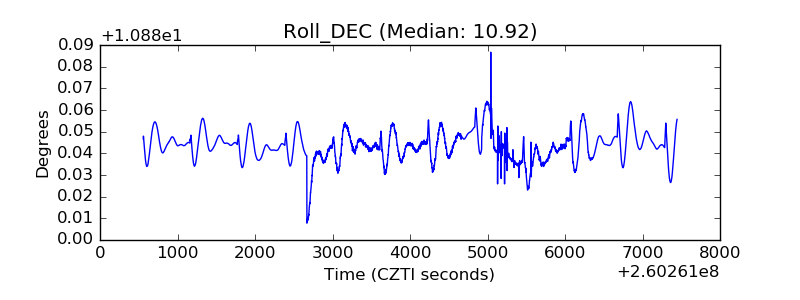 |
| _Roll_RA | 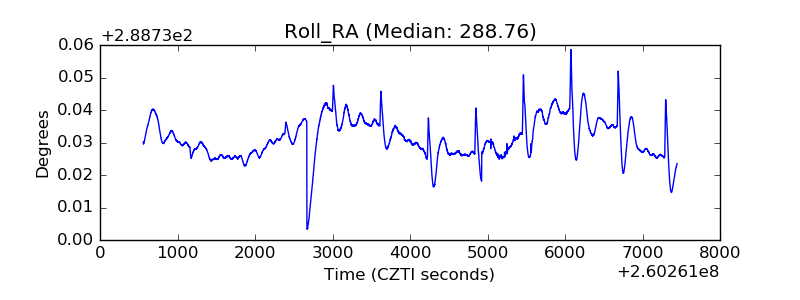 |
| Veto Counter | 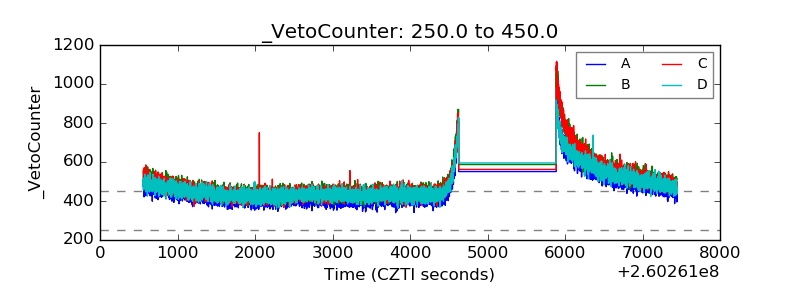 |