| Param | Original file | Final file |
|---|---|---|
| Filename | modeM0/AS1A04_180T01_9000002000_13562cztM0_level2.evt | modeM0/AS1A04_180T01_9000002000_13562cztM0_level2_quad_clean.evt |
| Size (bytes) | 424,177,920 | 78,125,760 |
| Size | 404.5 MB | 74.5 MB |
| Events in quadrant A | 2,849,468 | 507,628 |
| Events in quadrant B | 3,060,656 | 506,374 |
| Events in quadrant C | 2,980,419 | 499,093 |
| Events in quadrant D | 3,584,794 | 470,510 |
| Mode SS | |||
|---|---|---|---|
| Quadrant | BADHDUFLAG | Total packets | Discarded packets |
| A | 0 | 110 | 0 |
| B | 0 | 110 | 0 |
| C | 0 | 110 | 0 |
| D | 0 | 110 | 0 |
| Mode M9 | |||
|---|---|---|---|
| Quadrant | BADHDUFLAG | Total packets | Discarded packets |
| A | 0 | 13 | 0 |
| B | 0 | 13 | 0 |
| C | 0 | 13 | 0 |
| D | 0 | 13 | 0 |
| Mode M0 | |||
|---|---|---|---|
| Quadrant | BADHDUFLAG | Total packets | Discarded packets |
| A | 0 | 11484 | 2 |
| B | 0 | 12207 | 1 |
| C | 0 | 11879 | 1 |
| D | 0 | 14015 | 1 |
| Quadrant | Total seconds | Saturated seconds | Saturation percentage |
|---|---|---|---|
| A | 5462 | 72 | 1.318198% |
| B | 5462 | 108 | 1.977298% |
| C | 5462 | 47 | 0.860491% |
| D | 5462 | 197 | 3.606737% |
Noise dominated data is calculated using 1-second bins in cleaned event files. If a bin has >2000 counts, and if more than 50% of those come from <1% of pixels, then it is considered to be noise-dominated and hence unusable.
| Quadrant | # 1 sec bins | Bins with >0 counts | Bins with >2000 counts | High rate bins dominated by noise | Noise dominated (total time) | Noise dominated (detector-on time) | Marked lightcurve |
|---|---|---|---|---|---|---|---|
| A | 6738 | 5463 | 1 | 1 | 0.01% | 0.02% | 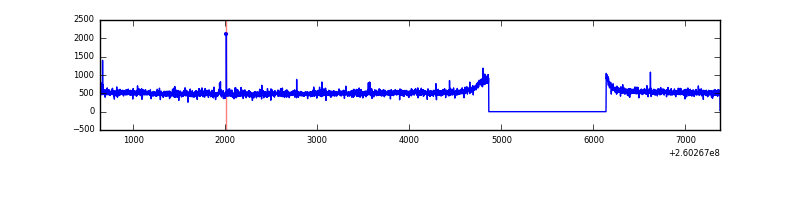 |
| B | 6738 | 5463 | 20 | 20 | 0.30% | 0.37% | 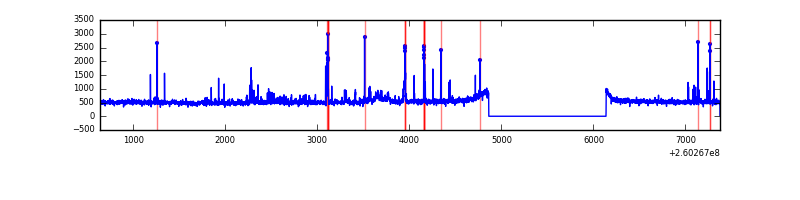 |
| C | 6738 | 5463 | 0 | 0 | 0.00% | 0.00% | 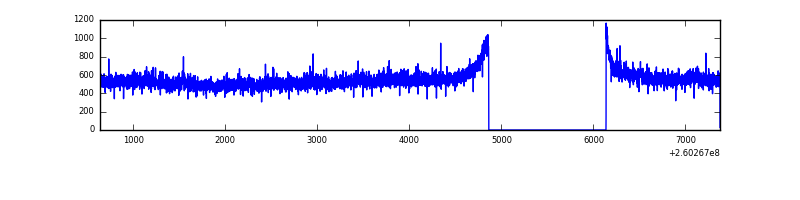 |
| D | 6738 | 5463 | 164 | 164 | 2.43% | 3.00% | 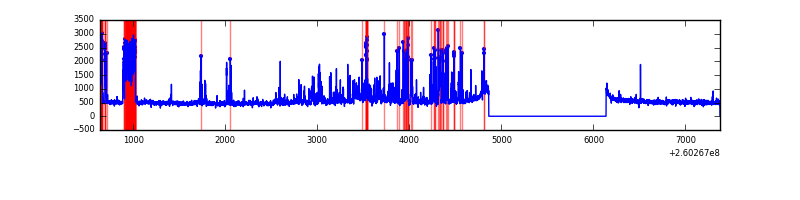 |
Top three noisy pixels from each quadrant. If the there are fewer than three noisy pixels in the level2.evt file, extra rows are filled as -1
| Pixel properties | Quadrant properties | ||||||
|---|---|---|---|---|---|---|---|
| Quadrant | DetID | PixID | Counts | Sigma | Mean | Median | Sigma |
| A | 1 | 162 | 15948 | 103.29 | 731 | 718 | 147.5 |
| A | 4 | 2 | 7740 | 47.62 | 731 | 718 | 147.5 |
| A | 10 | 229 | 7519 | 46.12 | 731 | 718 | 147.5 |
| B | 3 | 64 | 103456 | 752.01 | 719 | 703 | 136.6 |
| B | 3 | 209 | 41303 | 297.14 | 719 | 703 | 136.6 |
| B | 0 | 197 | 37054 | 266.04 | 719 | 703 | 136.6 |
| C | 3 | 233 | 259951 | 1621.97 | 697 | 702 | 159.8 |
| C | 13 | 61 | 5030 | 27.08 | 697 | 702 | 159.8 |
| C | 0 | 207 | 2839 | 13.37 | 697 | 702 | 159.8 |
| D | 5 | 222 | 484939 | 2921.64 | 698 | 682 | 165.7 |
| D | 8 | 195 | 150291 | 902.63 | 698 | 682 | 165.7 |
| D | 13 | 249 | 89342 | 534.91 | 698 | 682 | 165.7 |
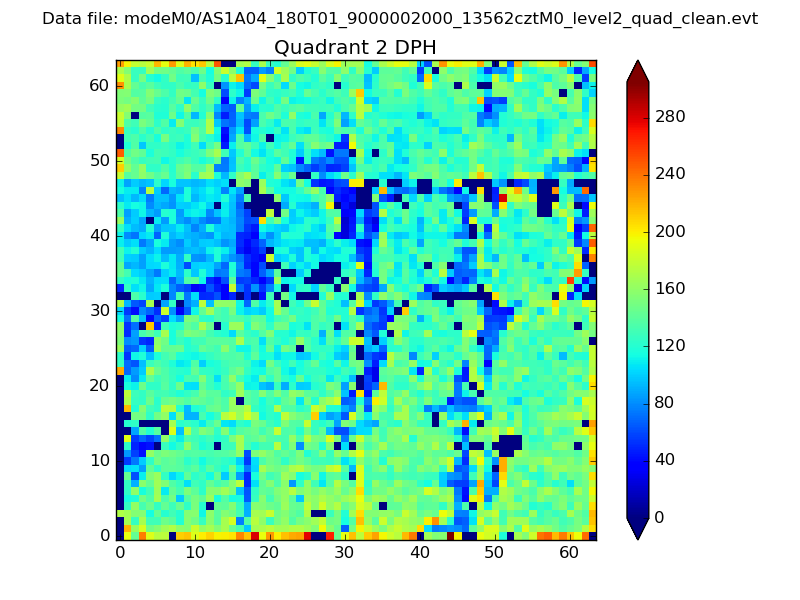
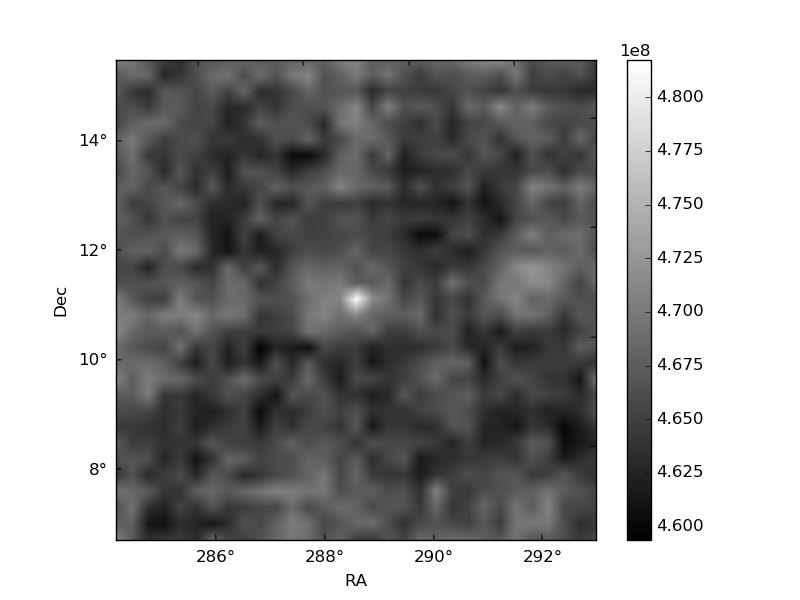
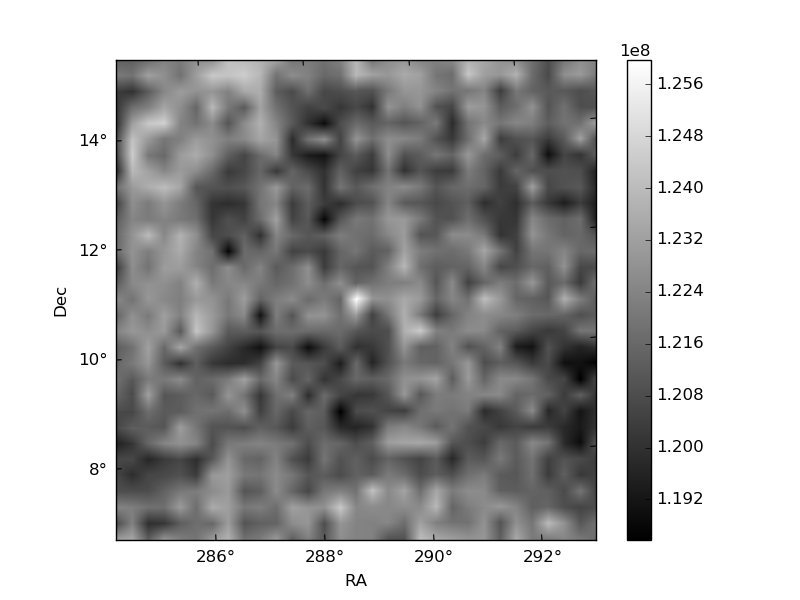
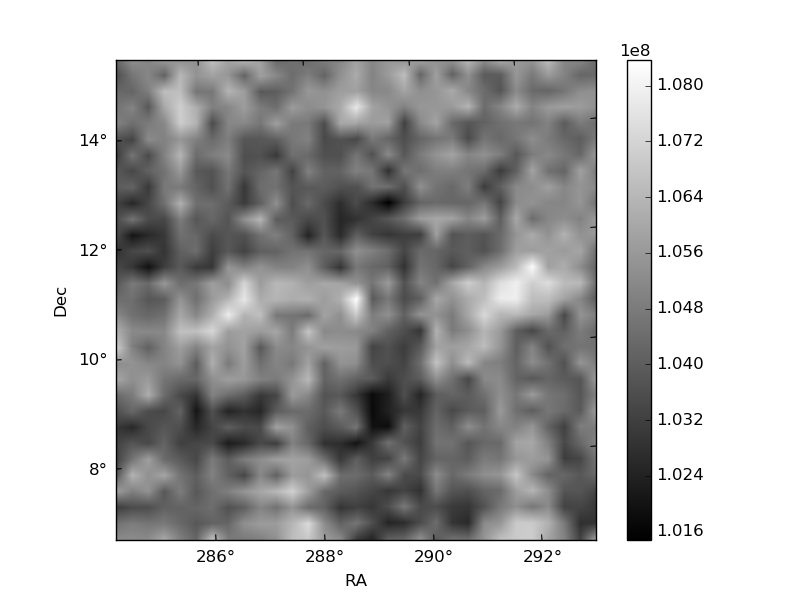
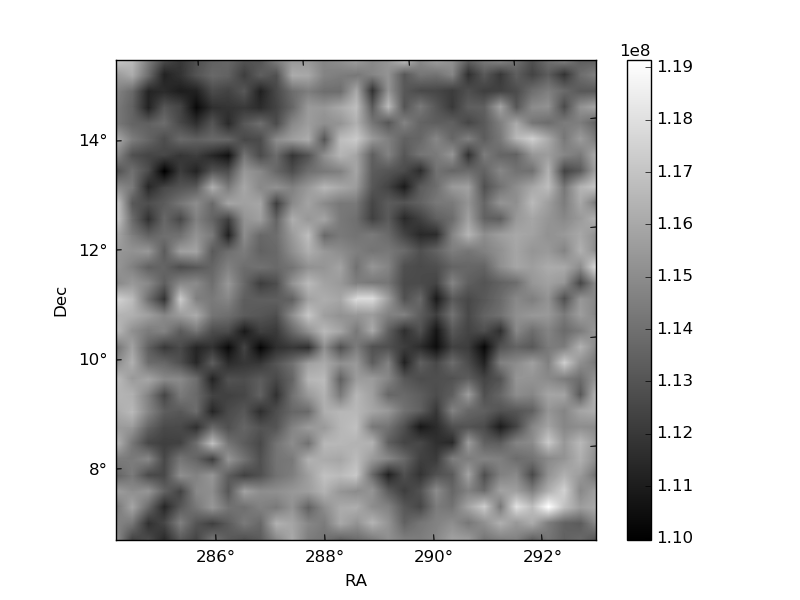
Histogram calculated using DETX and DETY for each event in the final _common_clean file
| Quadrant A | 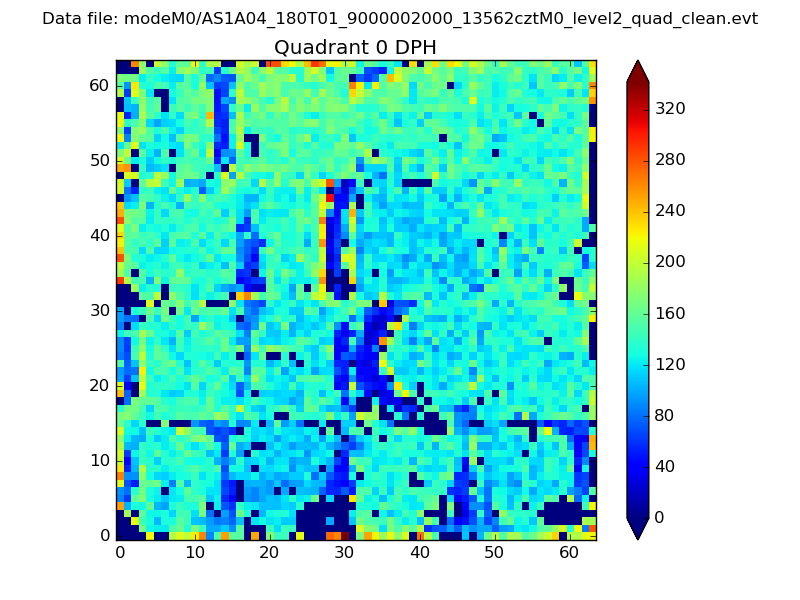 |
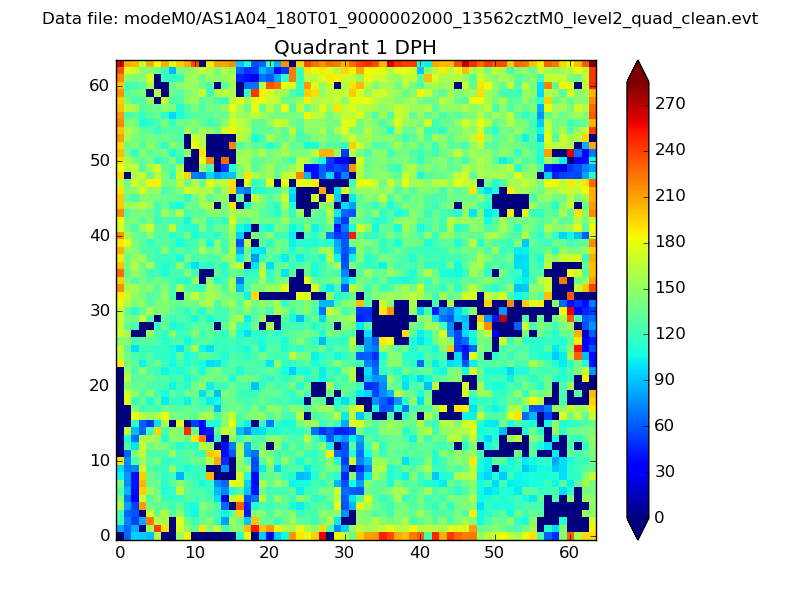 |
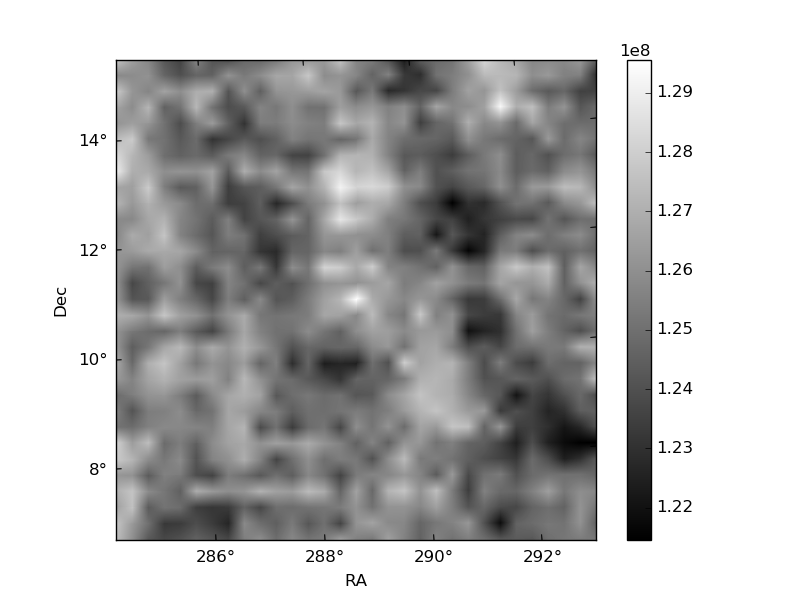
Quadrant B |
|---|---|---|---|
| Quadrant D | 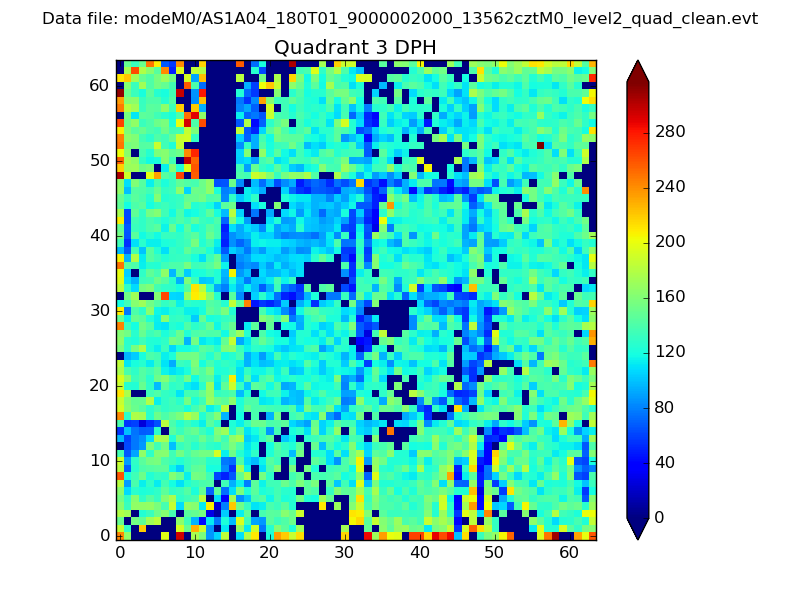 |
 |
Quadrant C |
| Plot type | Count rate plots | Images |
|---|---|---|
| Comparison with Poisson distribution Blue bars denote a histogram of data divided into 1 sec bins. Red curve is a Poisson curve with rate = median count rate of data. |
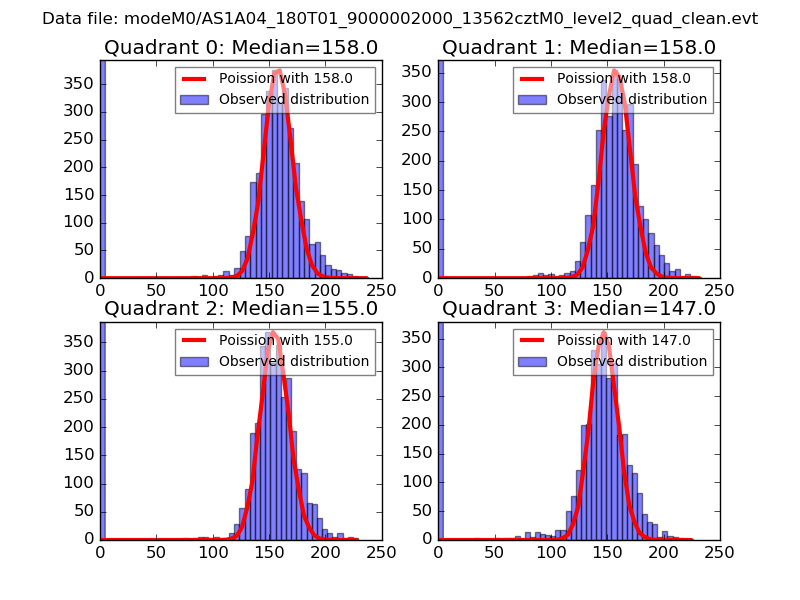 |
 |
| Quadrant-wise count rates Data is divided into 100 sec bins |
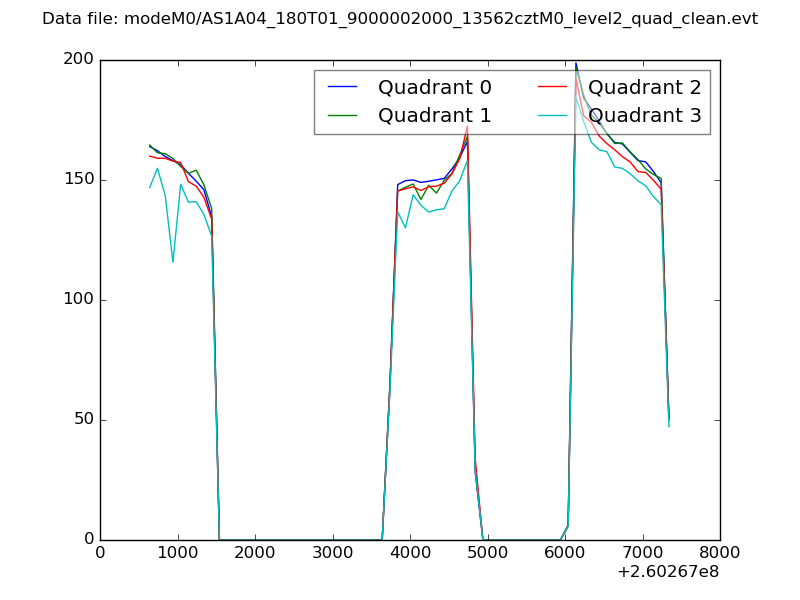 |
|
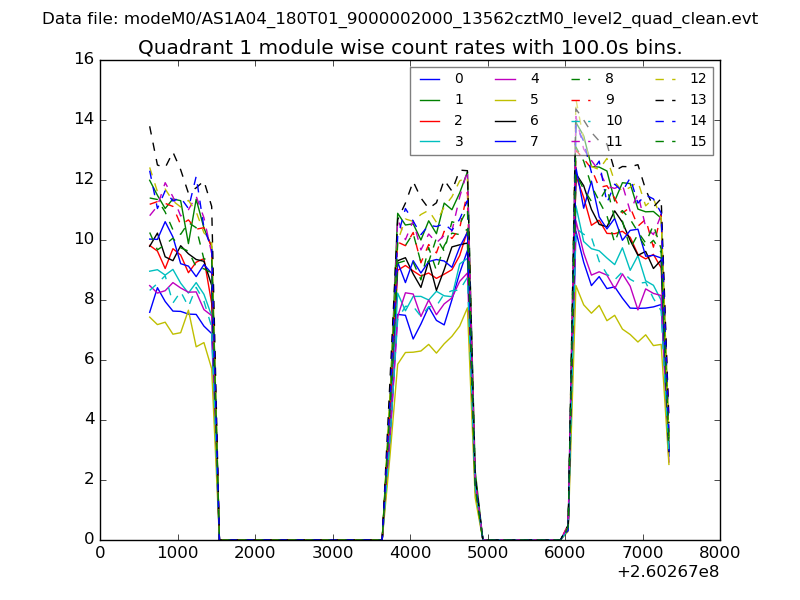
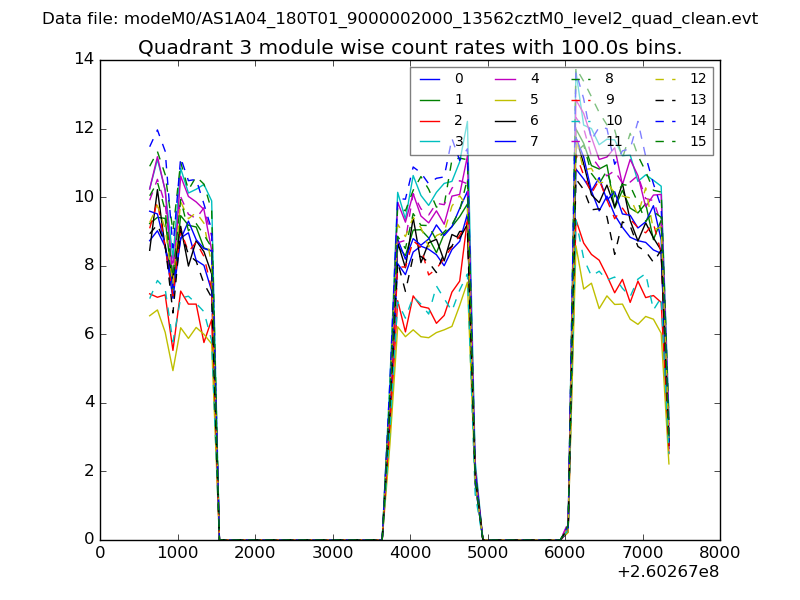
| Module-wise count rates for Quadrant A Data is divided into 100 sec bins |
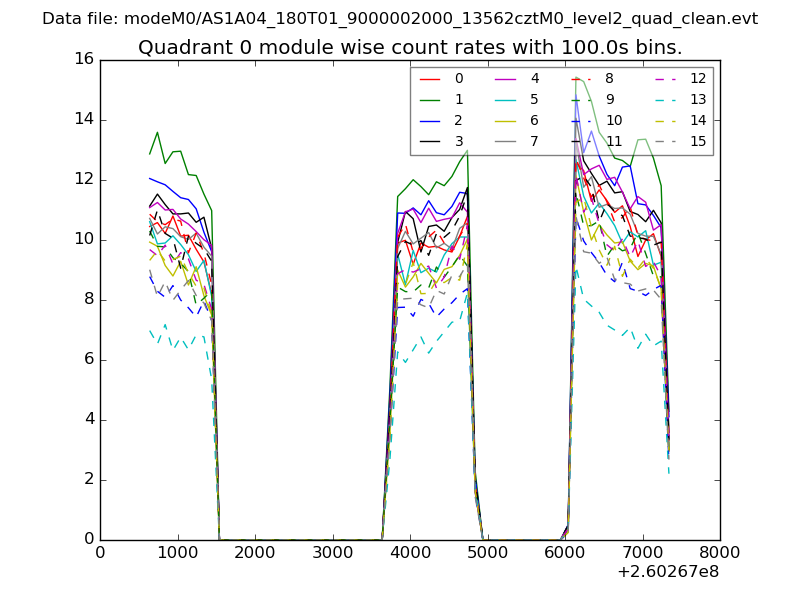 |
 |
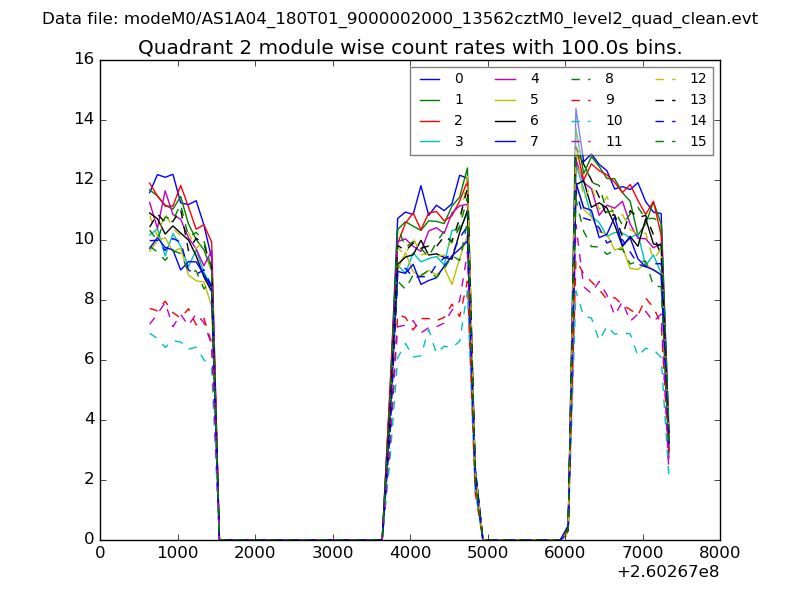
| Module-wise count rates for Quadrant B Data is divided into 100 sec bins |
 |
 |
| Module-wise count rates for Quadrant C Data is divided into 100 sec bins |
 |
 |
| Module-wise count rates for Quadrant D Data is divided into 100 sec bins |
 |
 |
| Parameter | Plot |
|---|---|
| CZT HV Monitor | 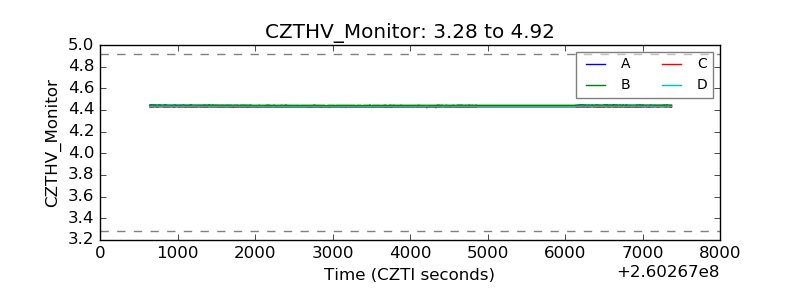 |
| D_VDD | 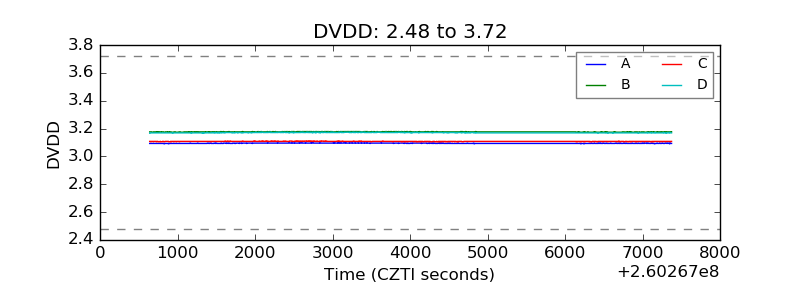 |
| Temperature 1 | 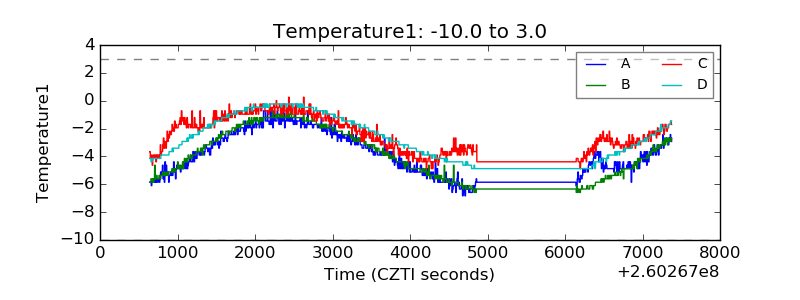 |
| Veto HV Monitor |  |
| Veto LLD | 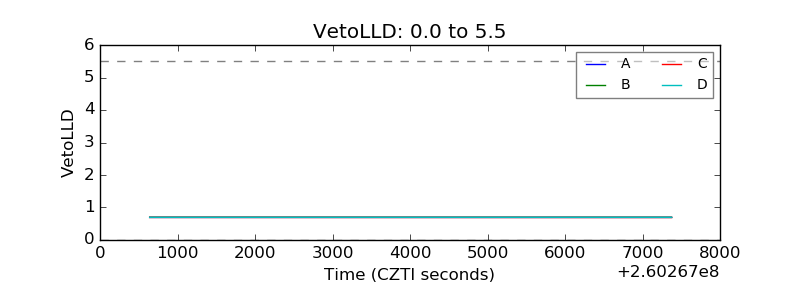 |
| Alpha Counter | 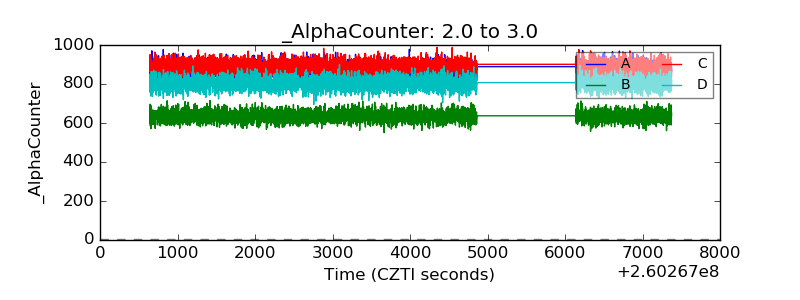 |
| _CPM_Rate | 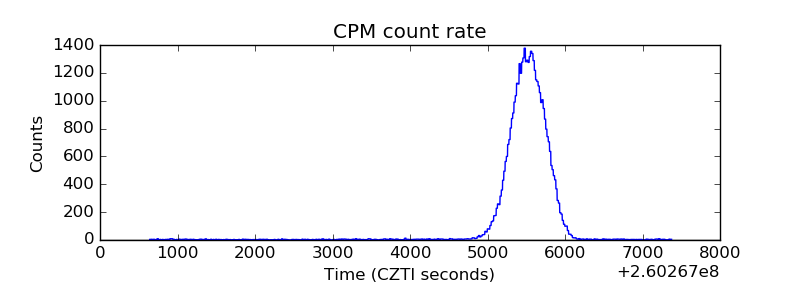 |
| CZT Counter | 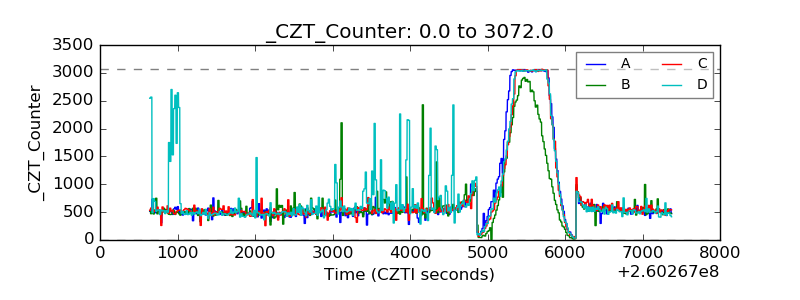 |
| +2.5 Volts monitor |  |
| +5 Volts monitor |  |
| _ROLL_ROT | 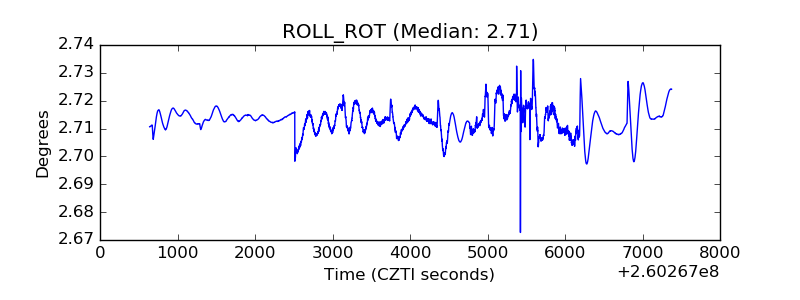 |
| _Roll_DEC | 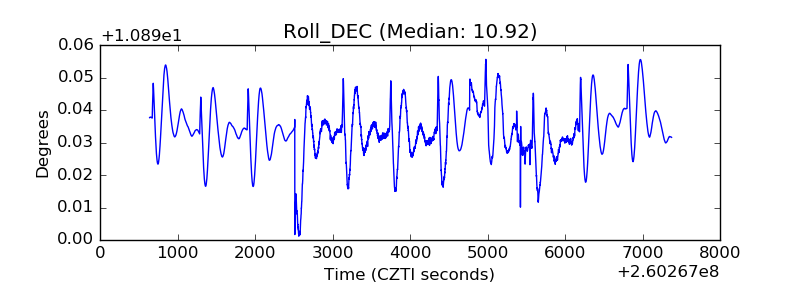 |
| _Roll_RA | 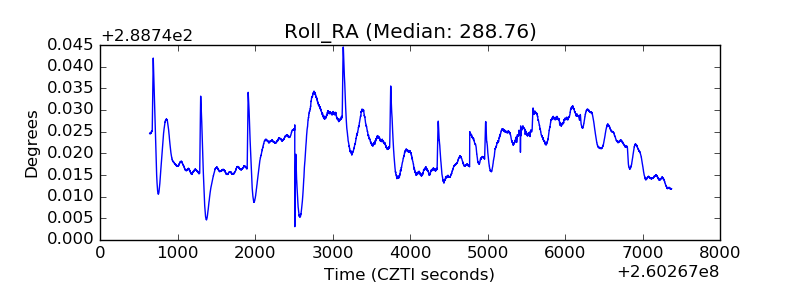 |
| Veto Counter | 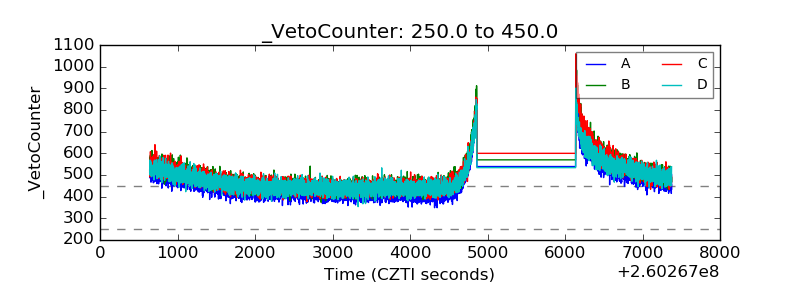 |