| Param | Original file | Final file |
|---|---|---|
| Filename | modeM0/AS1A04_180T01_9000002000_13563cztM0_level2.evt | modeM0/AS1A04_180T01_9000002000_13563cztM0_level2_quad_clean.evt |
| Size (bytes) | 464,097,600 | 86,627,520 |
| Size | 442.6 MB | 82.6 MB |
| Events in quadrant A | 3,204,465 | 559,079 |
| Events in quadrant B | 3,344,377 | 559,478 |
| Events in quadrant C | 3,412,412 | 549,410 |
| Events in quadrant D | 3,672,897 | 522,356 |
| Mode SS | |||
|---|---|---|---|
| Quadrant | BADHDUFLAG | Total packets | Discarded packets |
| A | 0 | 126 | 0 |
| B | 0 | 126 | 0 |
| C | 0 | 126 | 0 |
| D | 0 | 126 | 0 |
| Mode M9 | |||
|---|---|---|---|
| Quadrant | BADHDUFLAG | Total packets | Discarded packets |
| A | 0 | 13 | 0 |
| B | 0 | 13 | 0 |
| C | 0 | 13 | 0 |
| D | 0 | 14 | 0 |
| Mode M0 | |||
|---|---|---|---|
| Quadrant | BADHDUFLAG | Total packets | Discarded packets |
| A | 0 | 13012 | 3 |
| B | 0 | 13448 | 2 |
| C | 0 | 13531 | 2 |
| D | 0 | 14634 | 2 |
| Quadrant | Total seconds | Saturated seconds | Saturation percentage |
|---|---|---|---|
| A | 6203 | 74 | 1.192971% |
| B | 6203 | 81 | 1.305820% |
| C | 6203 | 42 | 0.677092% |
| D | 6203 | 125 | 2.015154% |
Noise dominated data is calculated using 1-second bins in cleaned event files. If a bin has >2000 counts, and if more than 50% of those come from <1% of pixels, then it is considered to be noise-dominated and hence unusable.
| Quadrant | # 1 sec bins | Bins with >0 counts | Bins with >2000 counts | High rate bins dominated by noise | Noise dominated (total time) | Noise dominated (detector-on time) | Marked lightcurve |
|---|---|---|---|---|---|---|---|
| A | 7474 | 6204 | 0 | 0 | 0.00% | 0.00% | 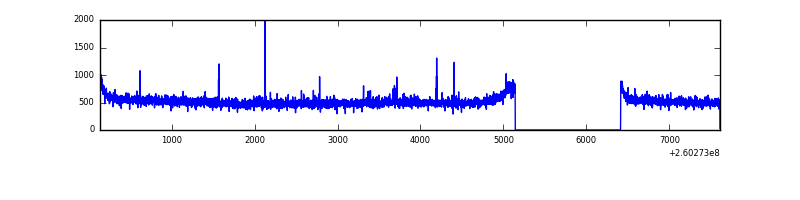 |
| B | 7474 | 6204 | 6 | 6 | 0.08% | 0.10% | 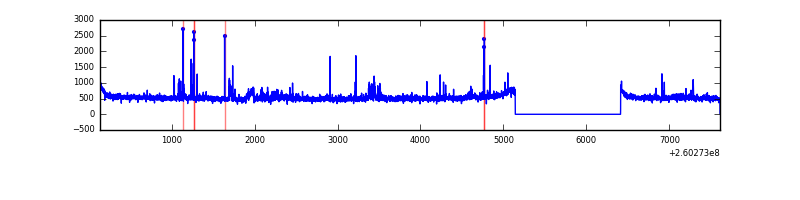 |
| C | 7474 | 6204 | 0 | 0 | 0.00% | 0.00% | 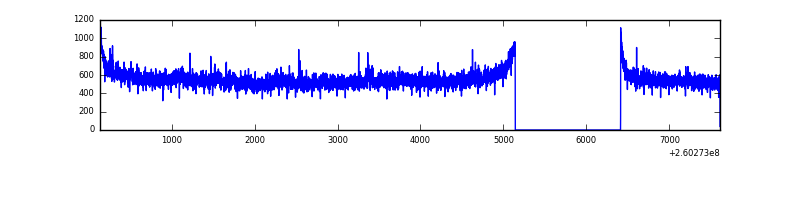 |
| D | 7474 | 6204 | 59 | 59 | 0.79% | 0.95% | 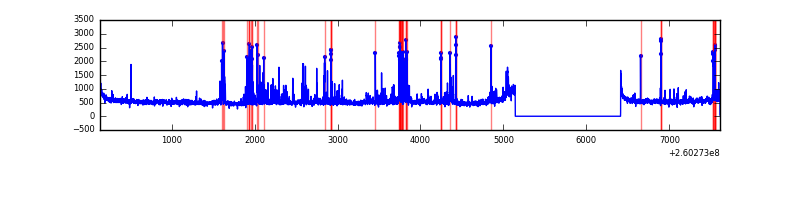 |
Top three noisy pixels from each quadrant. If the there are fewer than three noisy pixels in the level2.evt file, extra rows are filled as -1
| Pixel properties | Quadrant properties | ||||||
|---|---|---|---|---|---|---|---|
| Quadrant | DetID | PixID | Counts | Sigma | Mean | Median | Sigma |
| A | 15 | 69 | 9638 | 53.34 | 825 | 812 | 165.5 |
| A | 12 | 189 | 8249 | 44.95 | 825 | 812 | 165.5 |
| A | 0 | 226 | 7616 | 41.12 | 825 | 812 | 165.5 |
| B | 3 | 64 | 37381 | 236.68 | 812 | 792 | 154.6 |
| B | 4 | 216 | 30457 | 191.89 | 812 | 792 | 154.6 |
| B | 4 | 80 | 29718 | 187.11 | 812 | 792 | 154.6 |
| C | 3 | 233 | 338061 | 1865.96 | 787 | 793 | 180.7 |
| C | 13 | 61 | 5674 | 27.0 | 787 | 793 | 180.7 |
| C | 14 | 234 | 2290 | 8.28 | 787 | 793 | 180.7 |
| D | 13 | 104 | 211940 | 1119.66 | 791 | 771 | 188.6 |
| D | 8 | 195 | 180623 | 953.61 | 791 | 771 | 188.6 |
| D | 2 | 14 | 131952 | 695.55 | 791 | 771 | 188.6 |
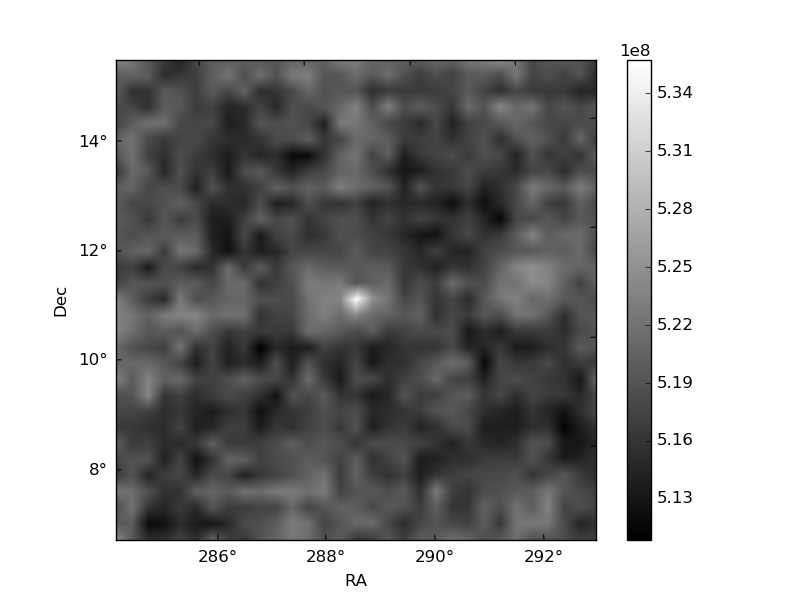
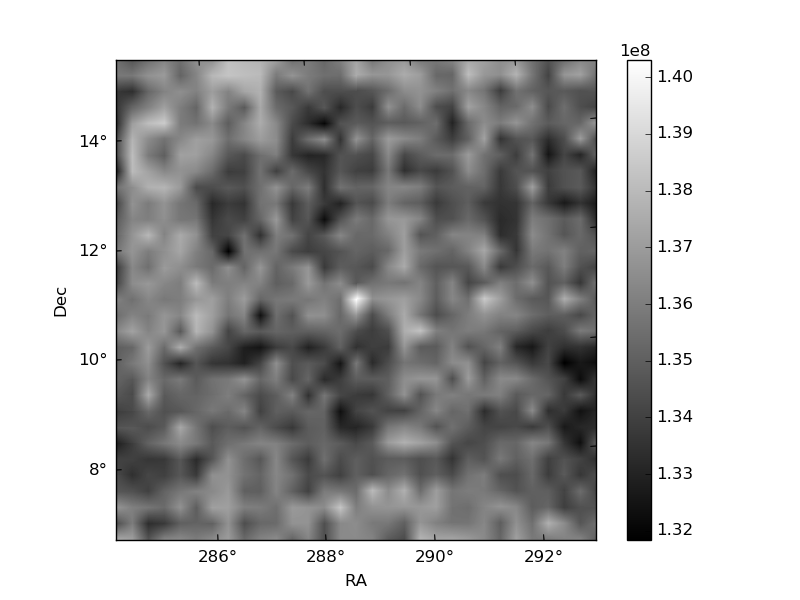
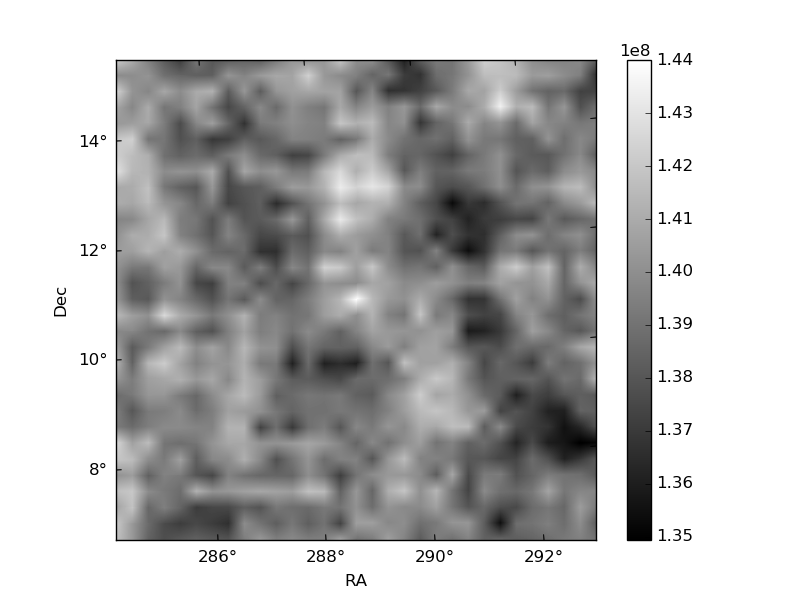
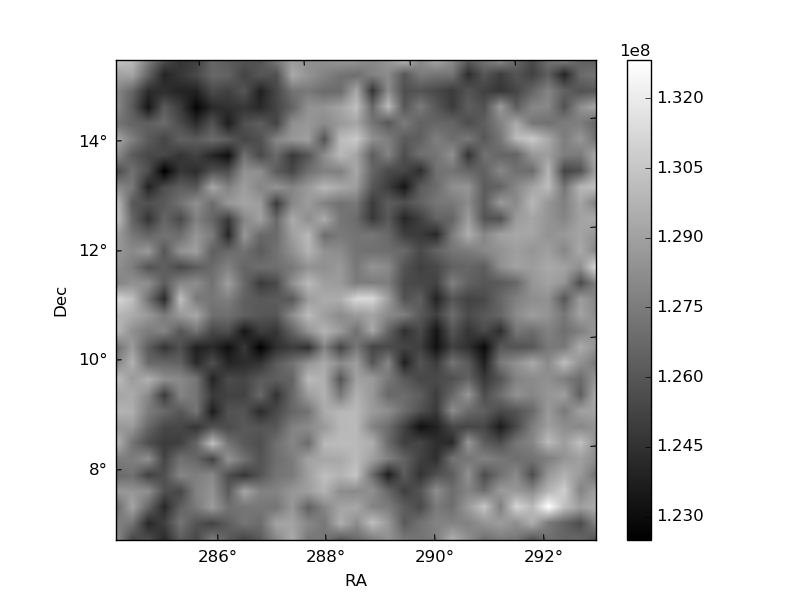
Histogram calculated using DETX and DETY for each event in the final _common_clean file
| Quadrant A | 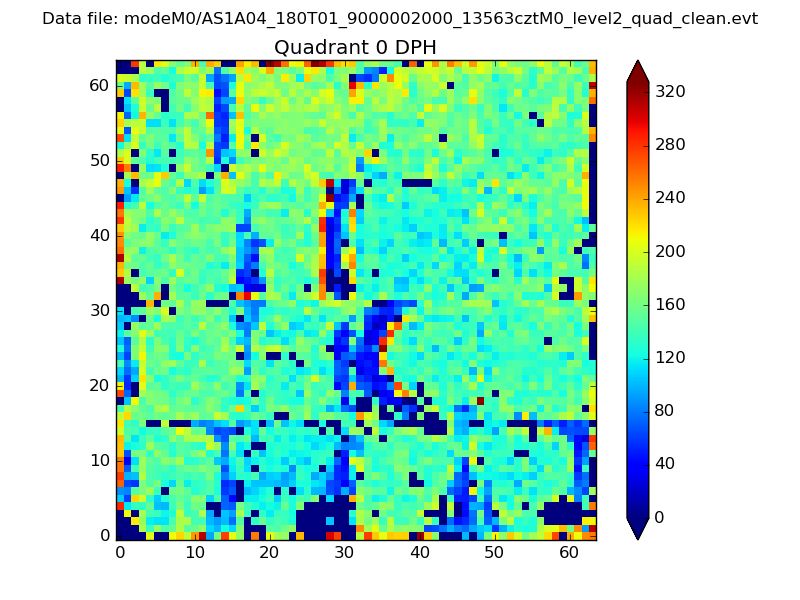 |
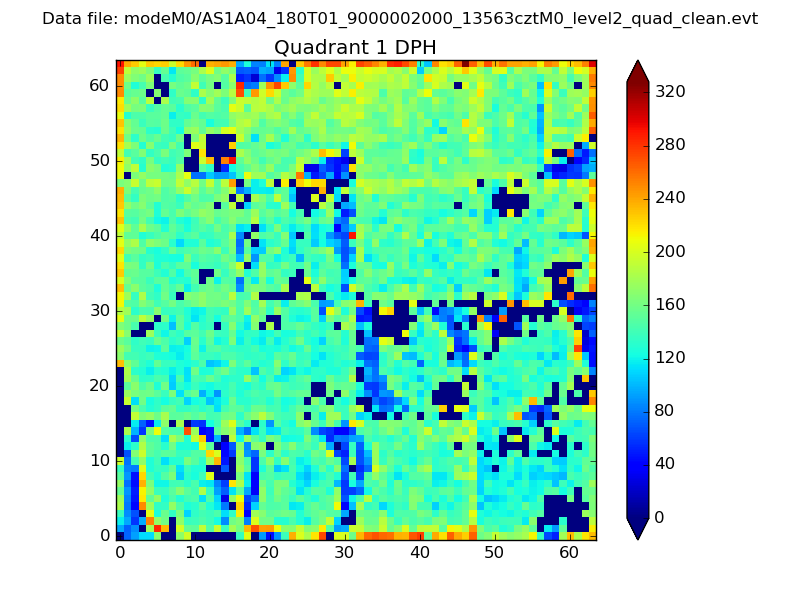 |
Quadrant B |
|---|---|---|---|
| Quadrant D | 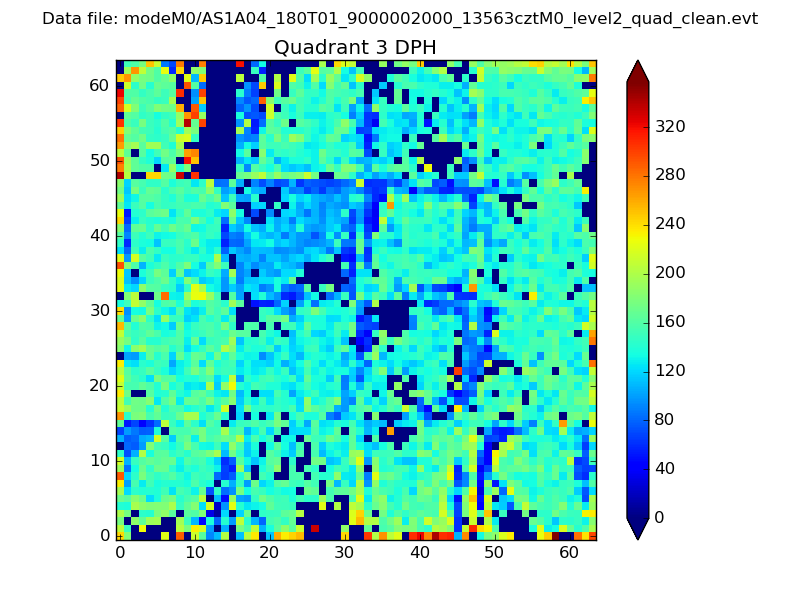 |
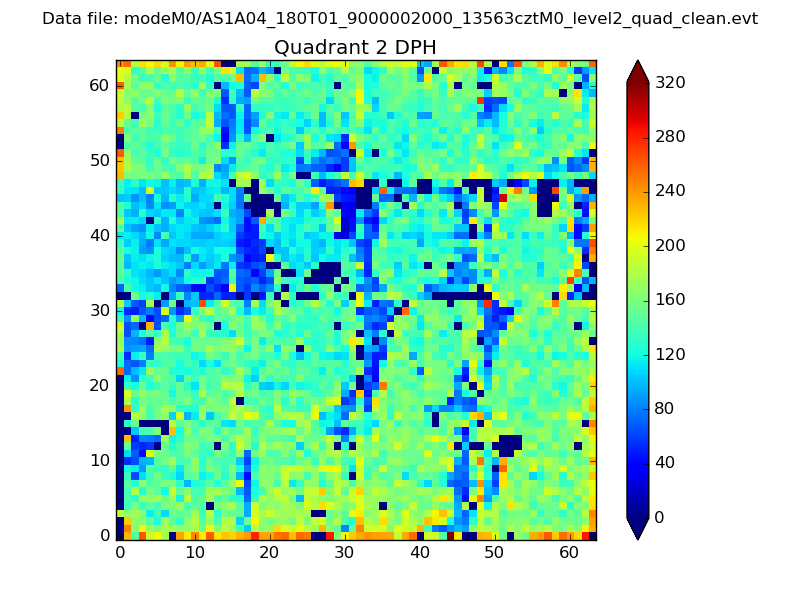 |
Quadrant C |
| Plot type | Count rate plots | Images |
|---|---|---|
| Comparison with Poisson distribution Blue bars denote a histogram of data divided into 1 sec bins. Red curve is a Poisson curve with rate = median count rate of data. |
 |
 |
| Quadrant-wise count rates Data is divided into 100 sec bins |
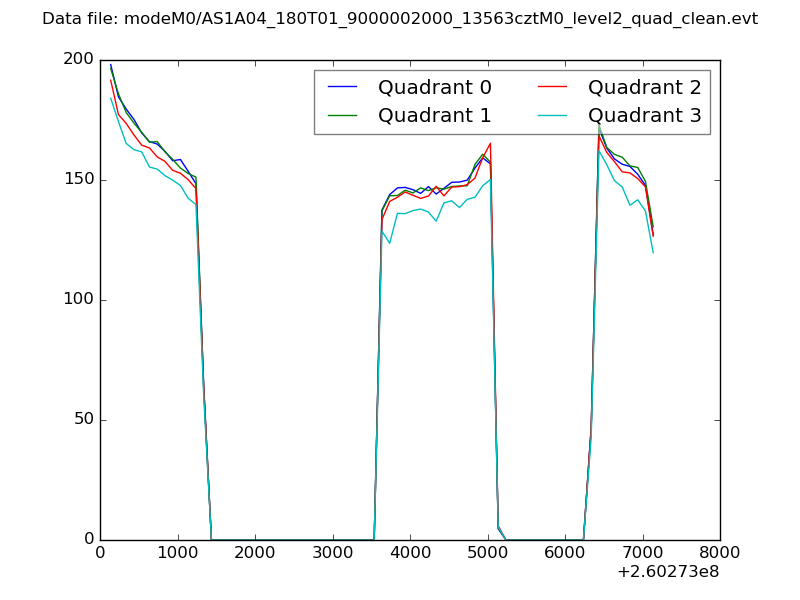 |
|
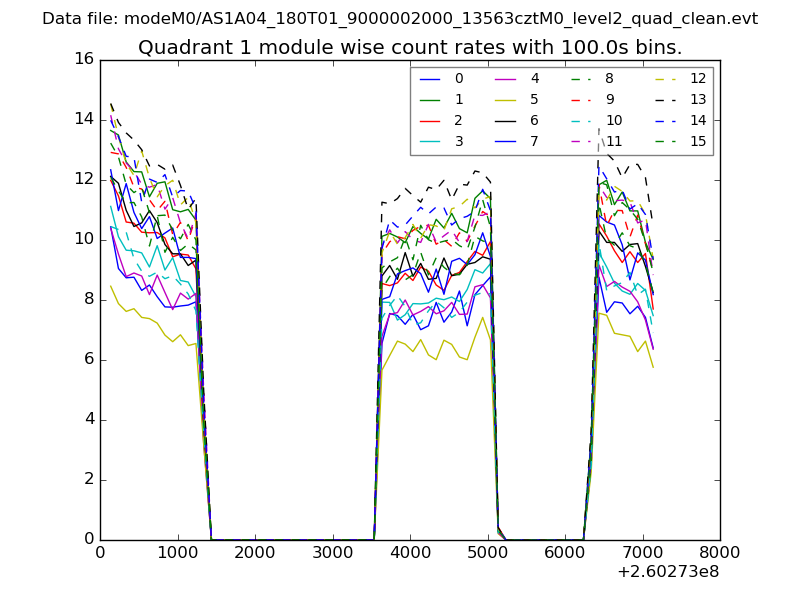
| Module-wise count rates for Quadrant A Data is divided into 100 sec bins |
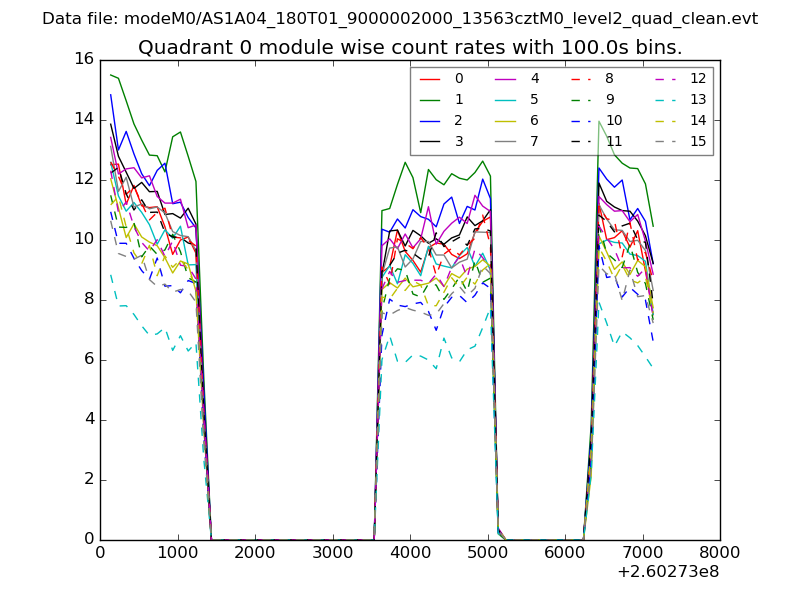 |
 |
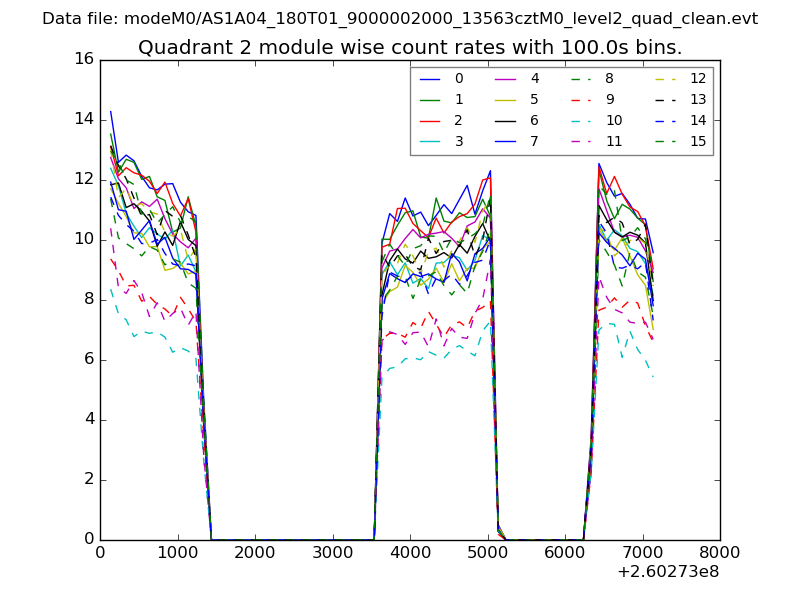
| Module-wise count rates for Quadrant B Data is divided into 100 sec bins |
 |
 |
| Module-wise count rates for Quadrant C Data is divided into 100 sec bins |
 |
 |
| Module-wise count rates for Quadrant D Data is divided into 100 sec bins |
 |
 |
| Parameter | Plot |
|---|---|
| CZT HV Monitor | 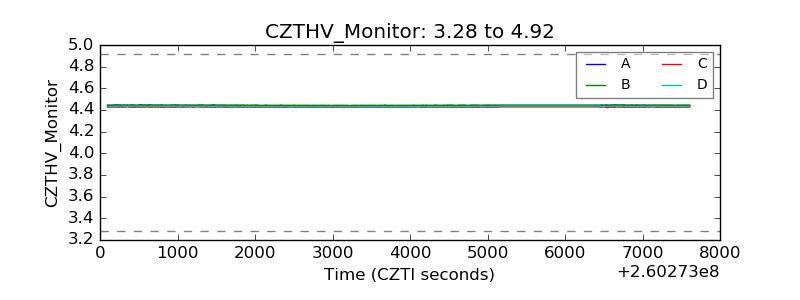 |
| D_VDD | 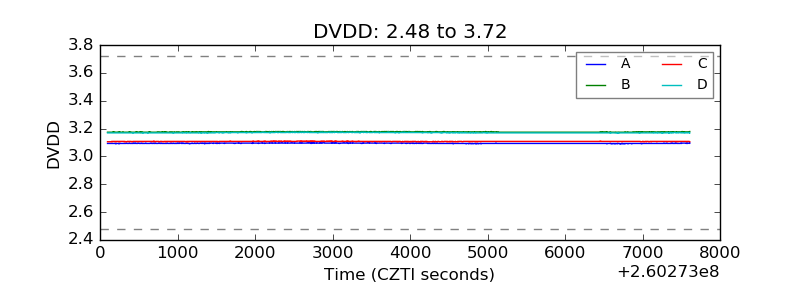 |
| Temperature 1 | 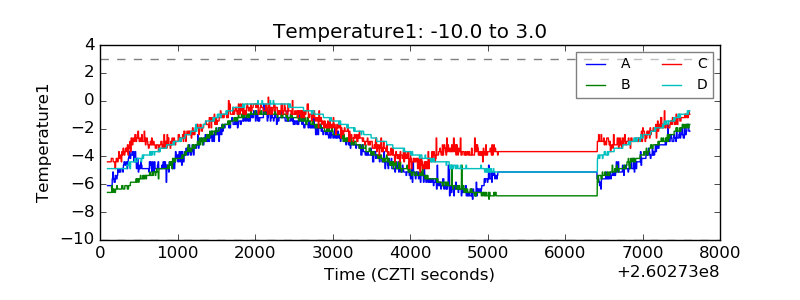 |
| Veto HV Monitor | 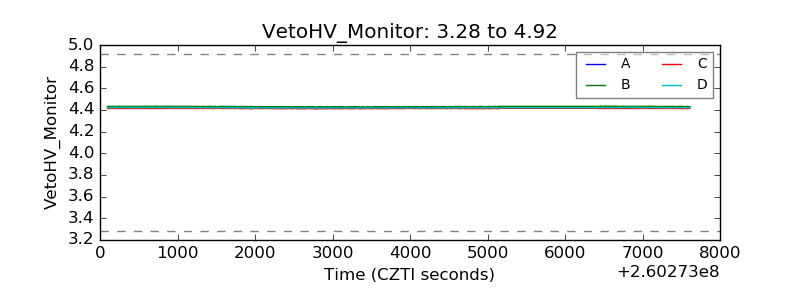 |
| Veto LLD |  |
| Alpha Counter | 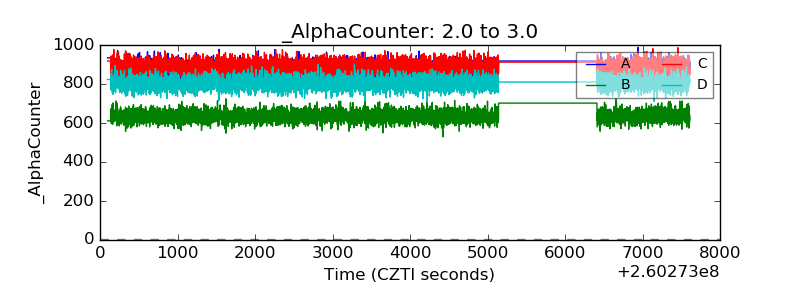 |
| _CPM_Rate | 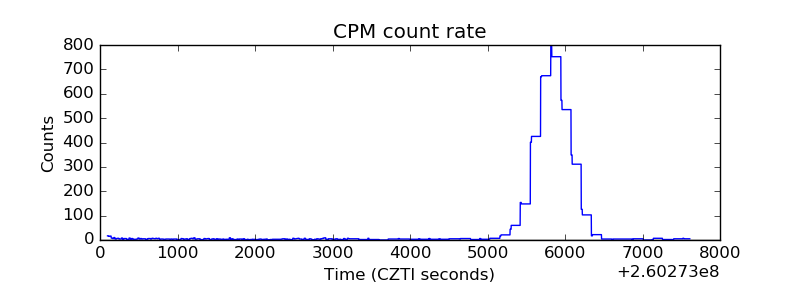 |
| CZT Counter | 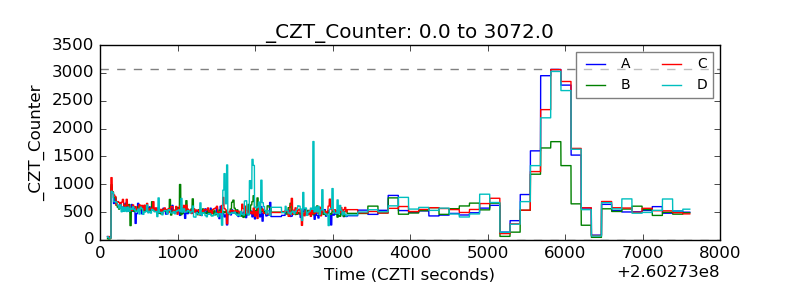 |
| +2.5 Volts monitor |  |
| +5 Volts monitor |  |
| _ROLL_ROT |  |
| _Roll_DEC | 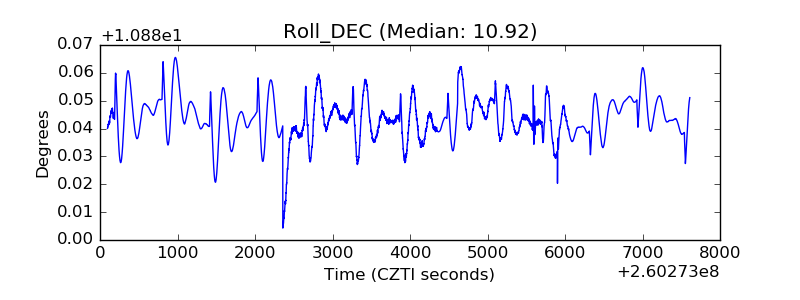 |
| _Roll_RA | 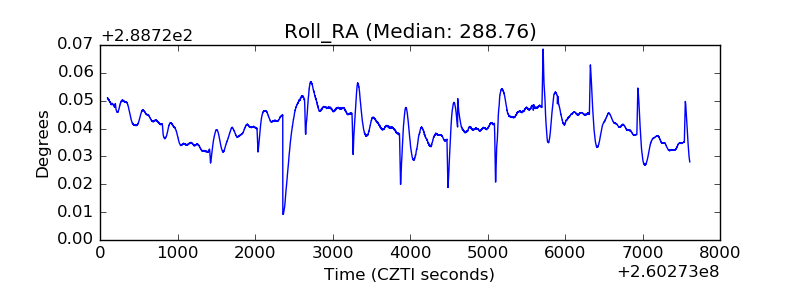 |
| Veto Counter | 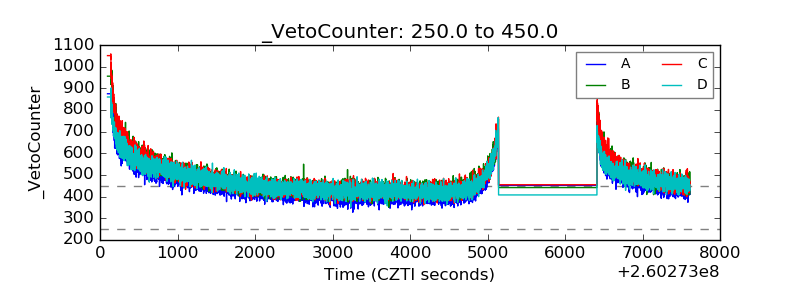 |