| Param | Original file | Final file |
|---|---|---|
| Filename | modeM0/AS1A04_180T01_9000002000_13566cztM0_level2.evt | modeM0/AS1A04_180T01_9000002000_13566cztM0_level2_quad_clean.evt |
| Size (bytes) | 591,094,080 | 80,470,080 |
| Size | 563.7 MB | 76.7 MB |
| Events in quadrant A | 3,693,567 | 491,784 |
| Events in quadrant B | 3,899,755 | 489,718 |
| Events in quadrant C | 4,120,437 | 485,248 |
| Events in quadrant D | 5,678,531 | 447,292 |
| Mode SS | |||
|---|---|---|---|
| Quadrant | BADHDUFLAG | Total packets | Discarded packets |
| A | 0 | 152 | 0 |
| B | 0 | 152 | 0 |
| C | 0 | 152 | 0 |
| D | 0 | 152 | 0 |
| Mode M9 | |||
|---|---|---|---|
| Quadrant | BADHDUFLAG | Total packets | Discarded packets |
| A | 0 | 7 | 0 |
| B | 0 | 7 | 0 |
| C | 0 | 7 | 0 |
| D | 0 | 8 | 0 |
| Mode M0 | |||
|---|---|---|---|
| Quadrant | BADHDUFLAG | Total packets | Discarded packets |
| A | 0 | 15707 | 3 |
| B | 0 | 16238 | 2 |
| C | 0 | 16413 | 2 |
| D | 0 | 21754 | 2 |
| Quadrant | Total seconds | Saturated seconds | Saturation percentage |
|---|---|---|---|
| A | 7507 | 117 | 1.558545% |
| B | 7507 | 190 | 2.530971% |
| C | 7507 | 134 | 1.785001% |
| D | 7507 | 539 | 7.179965% |
Noise dominated data is calculated using 1-second bins in cleaned event files. If a bin has >2000 counts, and if more than 50% of those come from <1% of pixels, then it is considered to be noise-dominated and hence unusable.
| Quadrant | # 1 sec bins | Bins with >0 counts | Bins with >2000 counts | High rate bins dominated by noise | Noise dominated (total time) | Noise dominated (detector-on time) | Marked lightcurve |
|---|---|---|---|---|---|---|---|
| A | 7803 | 7508 | 0 | 0 | 0.00% | 0.00% |  |
| B | 7803 | 7508 | 51 | 51 | 0.65% | 0.68% | 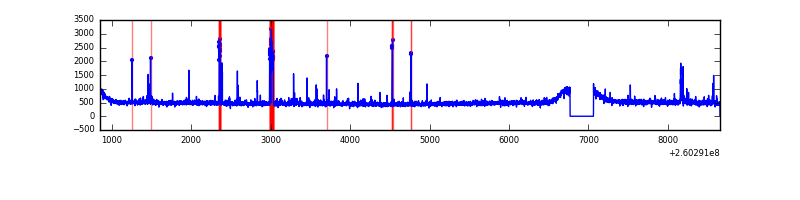 |
| C | 7803 | 7508 | 0 | 0 | 0.00% | 0.00% | 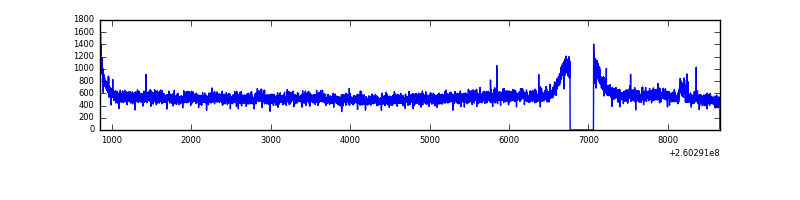 |
| D | 7803 | 7508 | 396 | 396 | 5.07% | 5.27% | 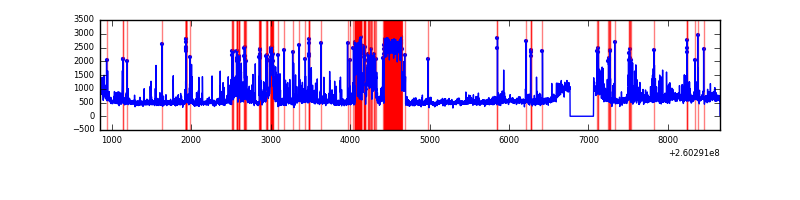 |
Top three noisy pixels from each quadrant. If the there are fewer than three noisy pixels in the level2.evt file, extra rows are filled as -1
| Pixel properties | Quadrant properties | ||||||
|---|---|---|---|---|---|---|---|
| Quadrant | DetID | PixID | Counts | Sigma | Mean | Median | Sigma |
| A | 1 | 162 | 23319 | 116.12 | 945 | 926 | 192.8 |
| A | 4 | 2 | 12168 | 58.3 | 945 | 926 | 192.8 |
| A | 0 | 226 | 9174 | 42.77 | 945 | 926 | 192.8 |
| B | 0 | 182 | 113614 | 622.11 | 935 | 912 | 181.2 |
| B | 3 | 64 | 65209 | 354.92 | 935 | 912 | 181.2 |
| B | 3 | 209 | 29775 | 159.32 | 935 | 912 | 181.2 |
| C | 3 | 233 | 563103 | 2634.95 | 910 | 914 | 213.4 |
| C | 13 | 61 | 6522 | 26.28 | 910 | 914 | 213.4 |
| C | 8 | 128 | 3755 | 13.32 | 910 | 914 | 213.4 |
| D | 13 | 122 | 843690 | 3840.69 | 898 | 873 | 219.4 |
| D | 8 | 195 | 525194 | 2389.32 | 898 | 873 | 219.4 |
| D | 13 | 104 | 347000 | 1577.29 | 898 | 873 | 219.4 |
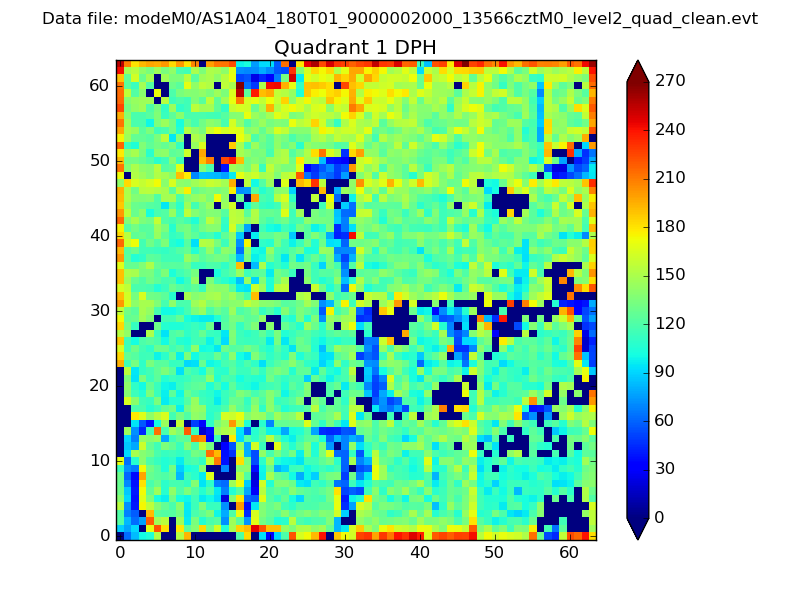
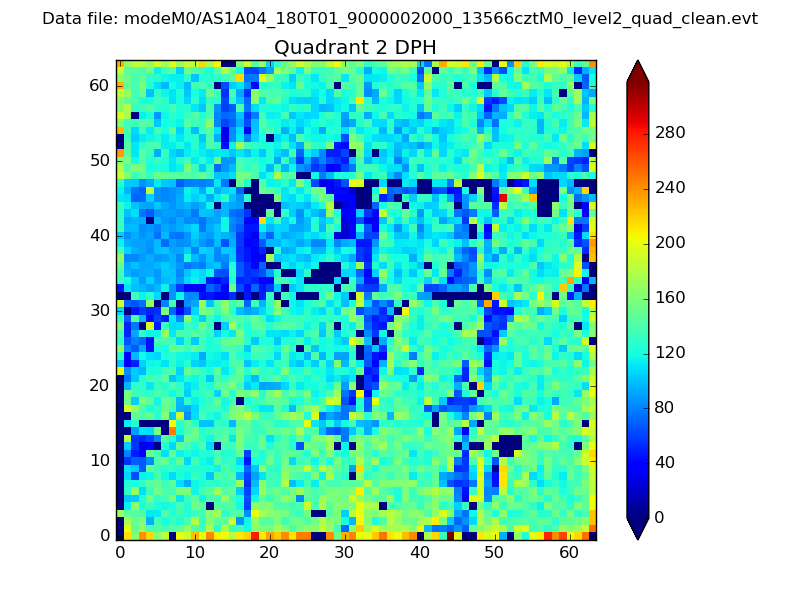
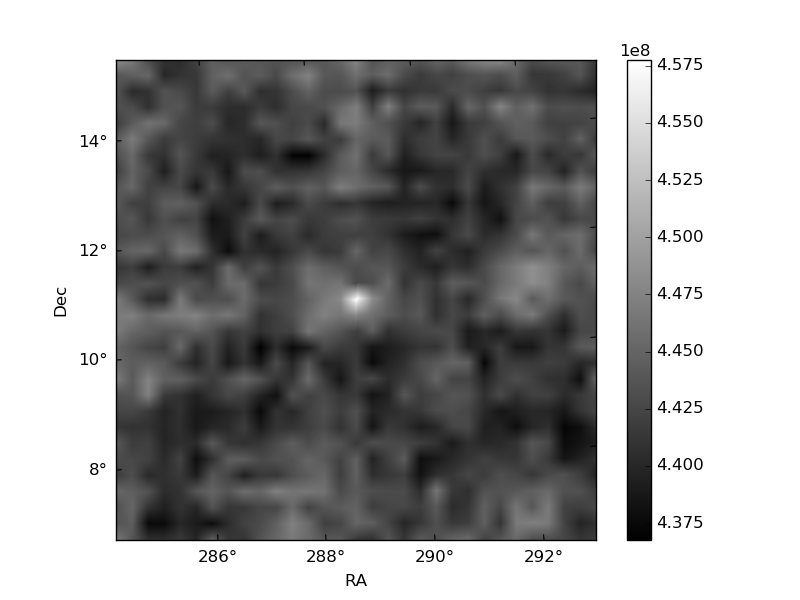
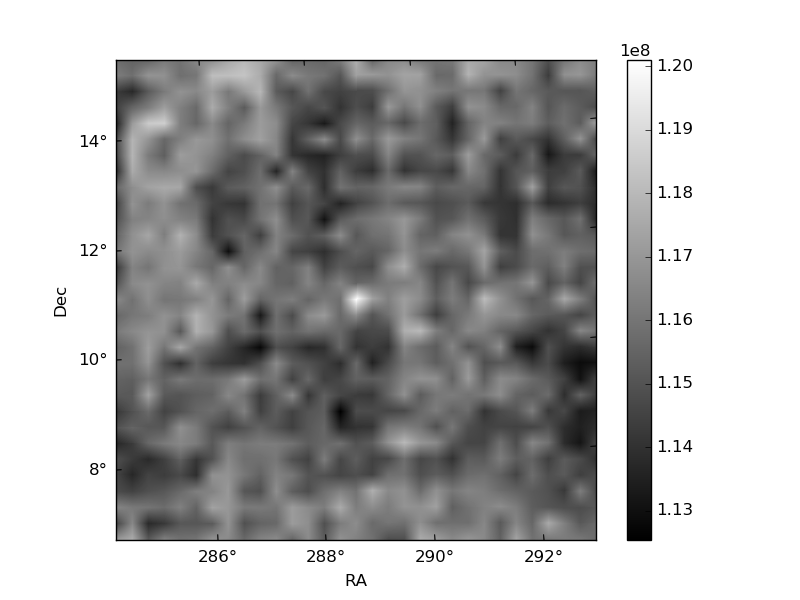
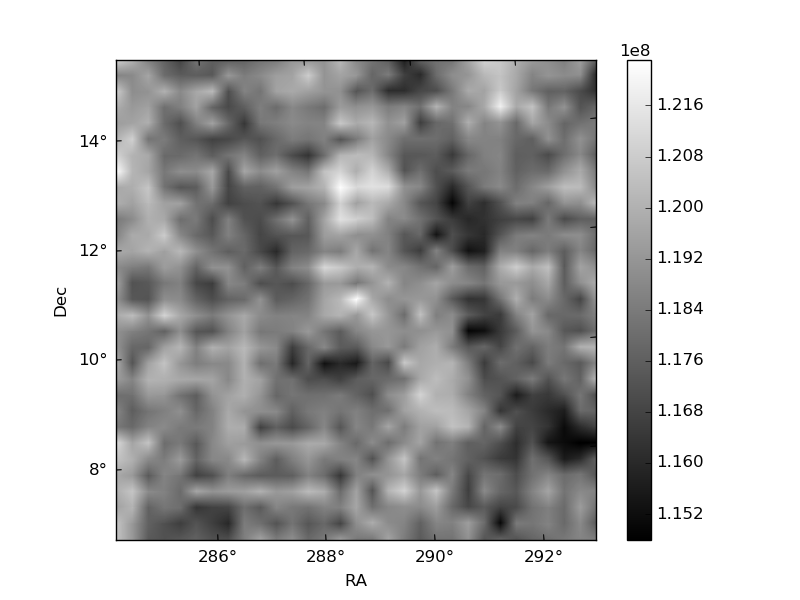
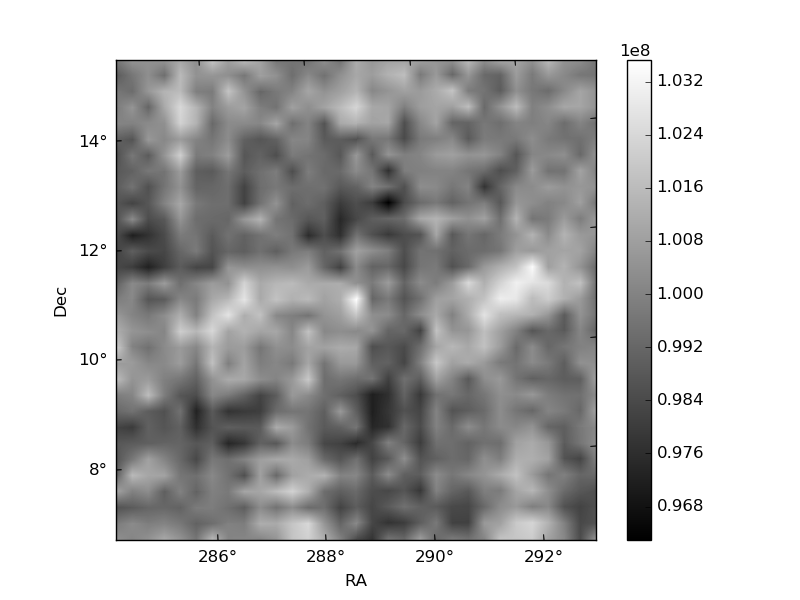
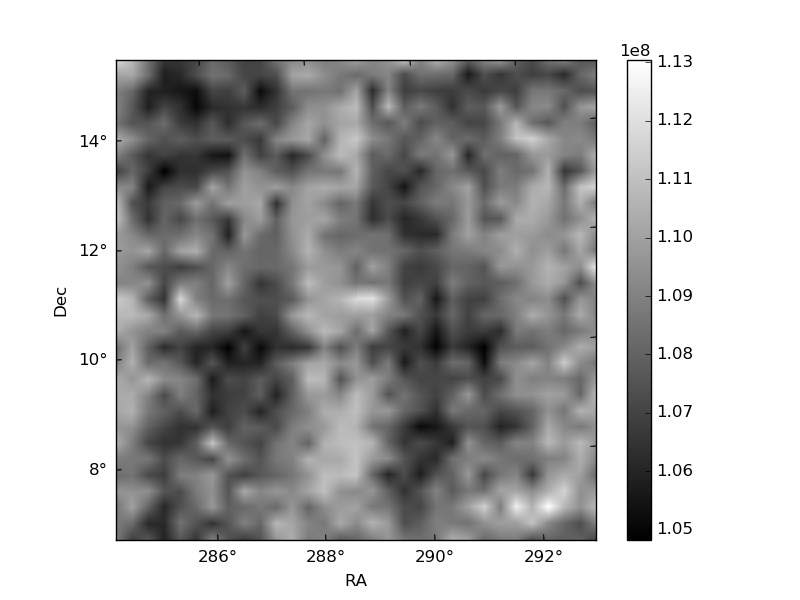
Histogram calculated using DETX and DETY for each event in the final _common_clean file
| Quadrant A | 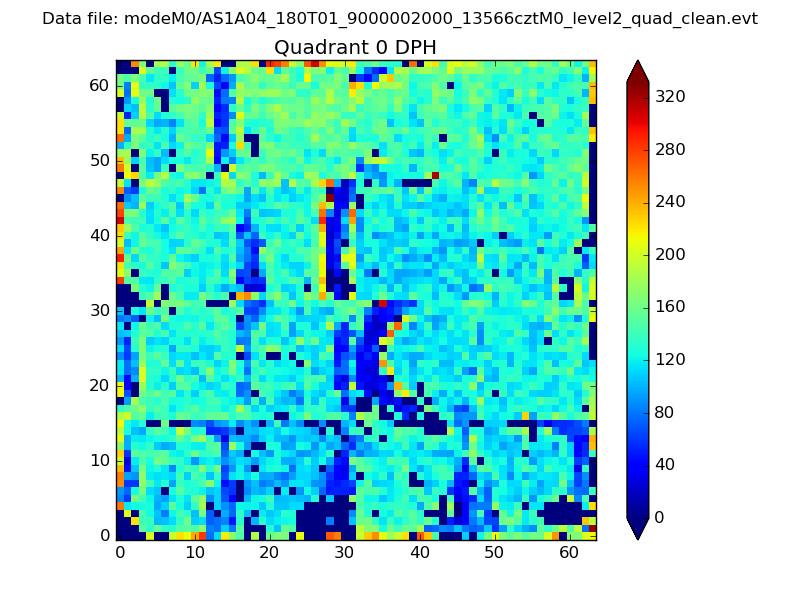 |
 |
Quadrant B |
|---|---|---|---|
| Quadrant D | 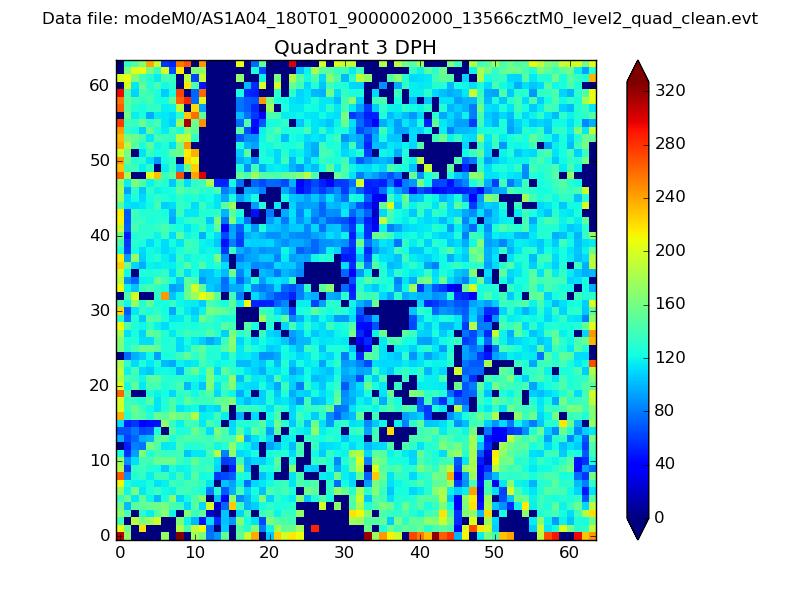 |
 |
Quadrant C |
| Plot type | Count rate plots | Images |
|---|---|---|
| Comparison with Poisson distribution Blue bars denote a histogram of data divided into 1 sec bins. Red curve is a Poisson curve with rate = median count rate of data. |
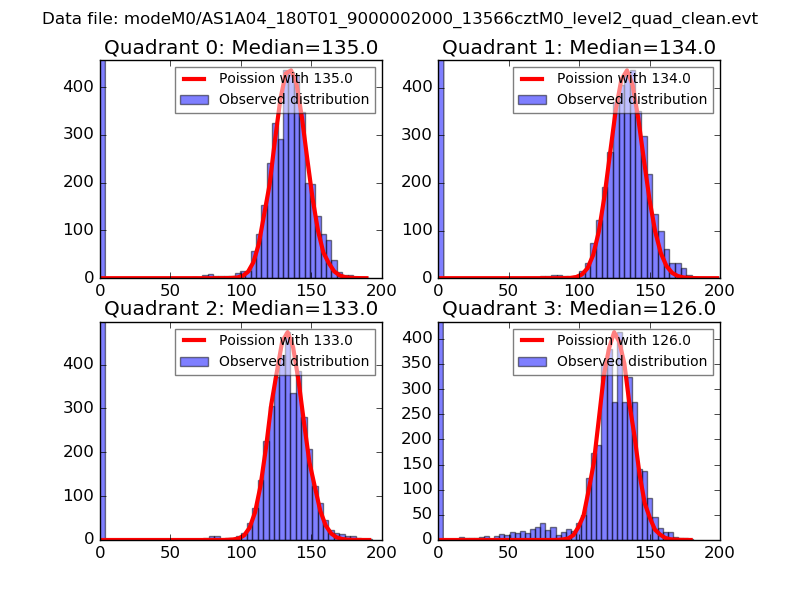 |
 |
| Quadrant-wise count rates Data is divided into 100 sec bins |
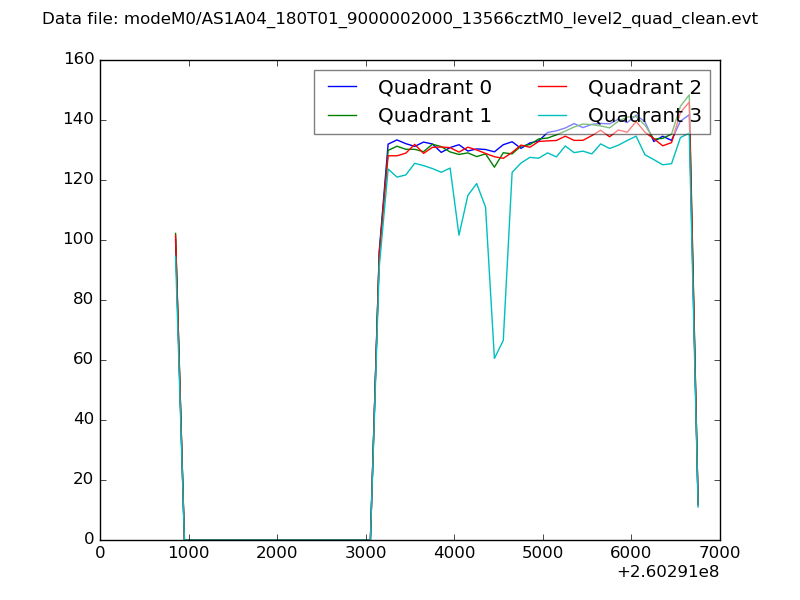 |
|
| Module-wise count rates for Quadrant A Data is divided into 100 sec bins |
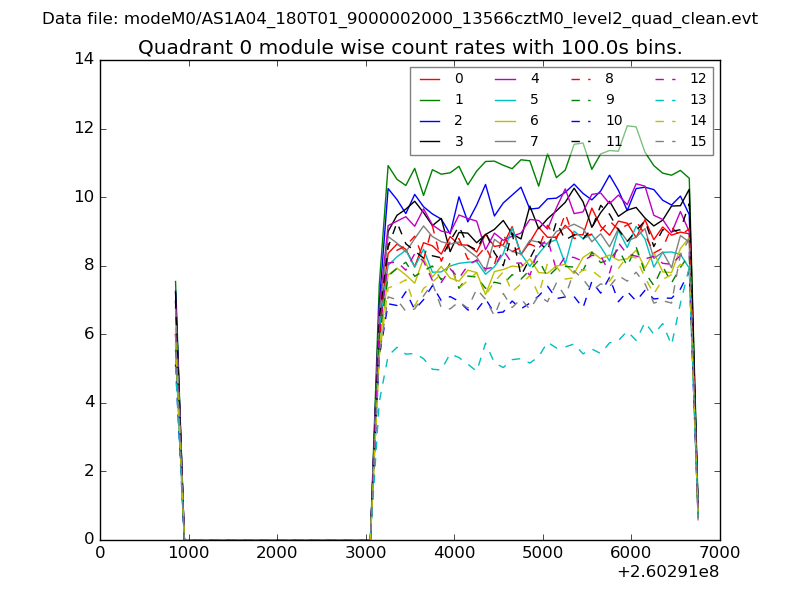 |
 |
| Module-wise count rates for Quadrant B Data is divided into 100 sec bins |
 |
 |
| Module-wise count rates for Quadrant C Data is divided into 100 sec bins |
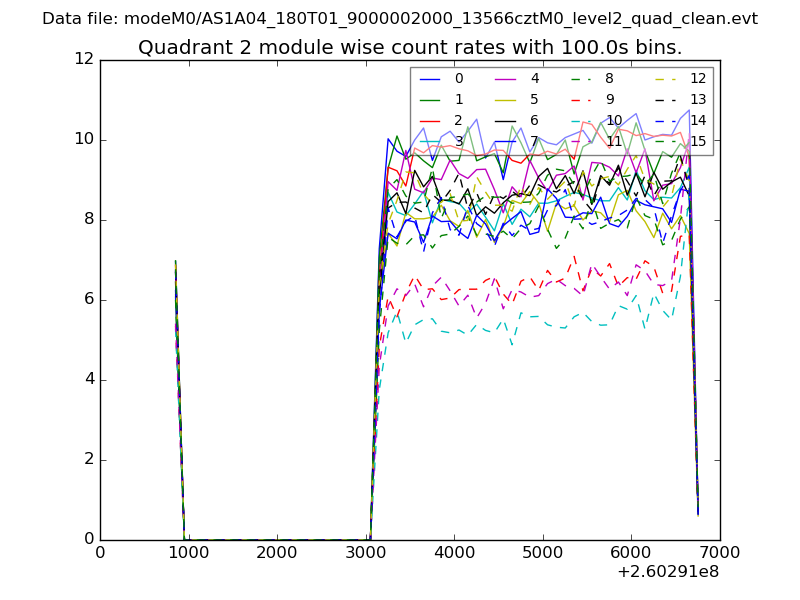 |
 |
| Module-wise count rates for Quadrant D Data is divided into 100 sec bins |
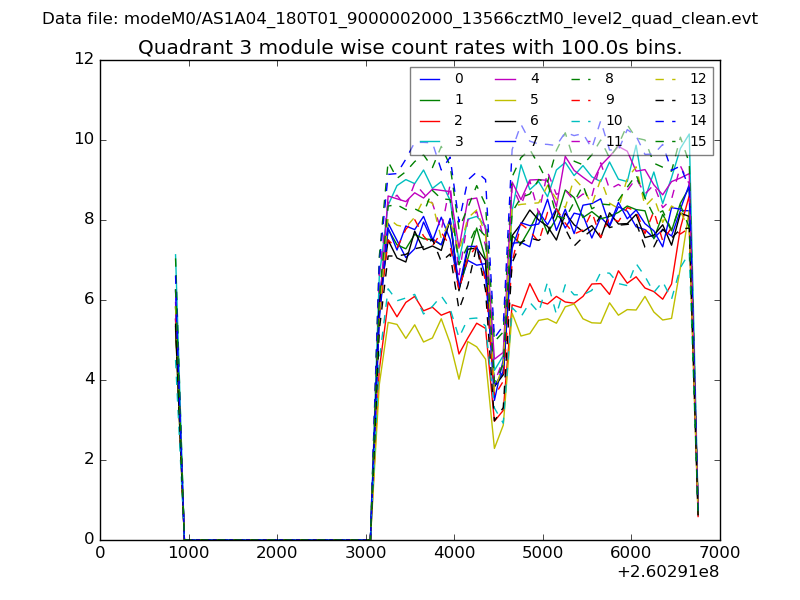 |
 |
| Parameter | Plot |
|---|---|
| CZT HV Monitor | 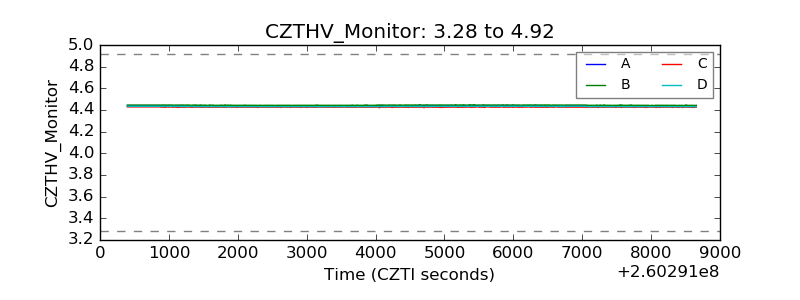 |
| D_VDD |  |
| Temperature 1 | 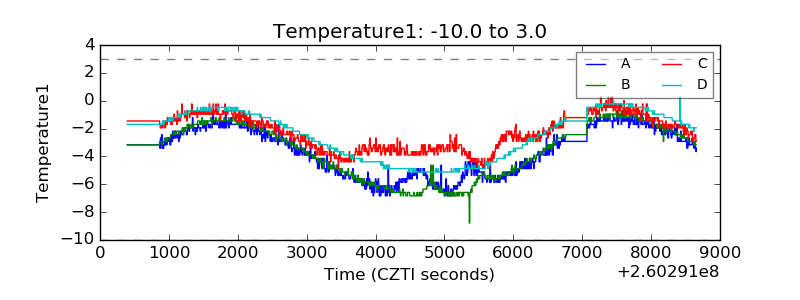 |
| Veto HV Monitor | 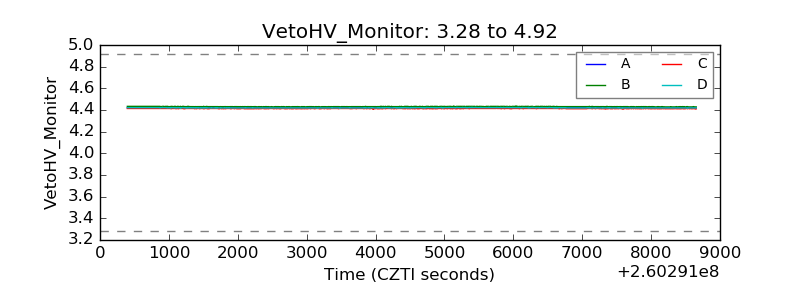 |
| Veto LLD | 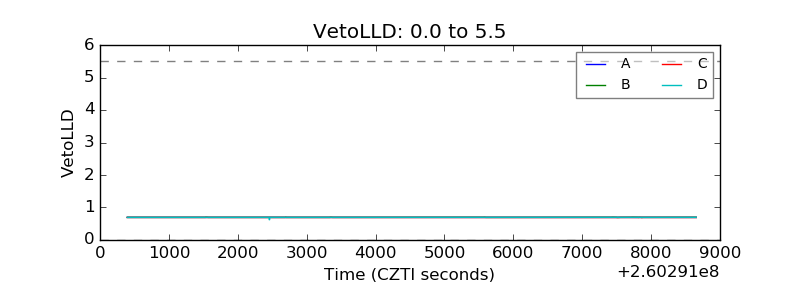 |
| Alpha Counter | 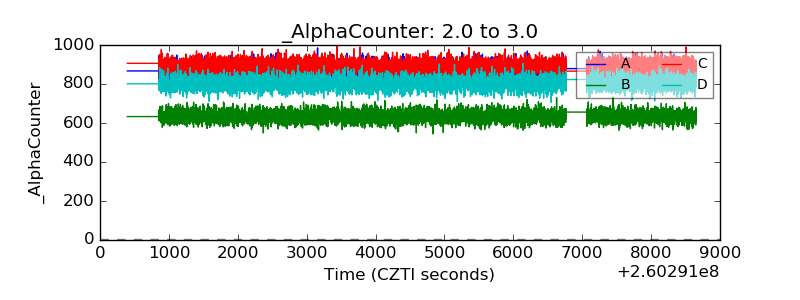 |
| _CPM_Rate | 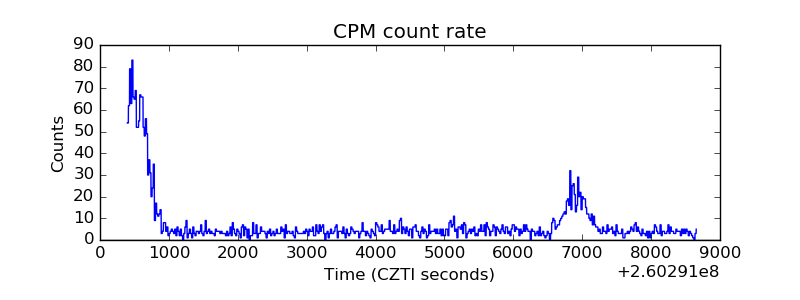 |
| CZT Counter | 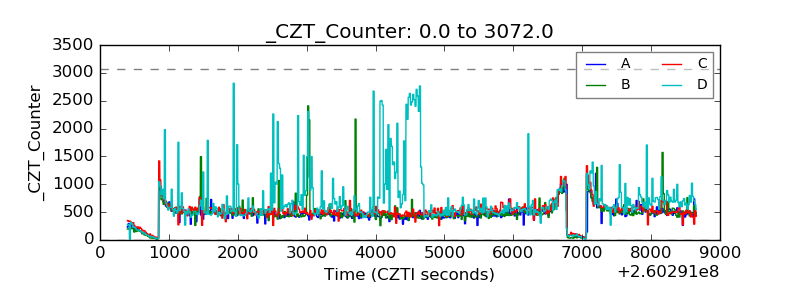 |
| +2.5 Volts monitor |  |
| +5 Volts monitor |  |
| _ROLL_ROT | 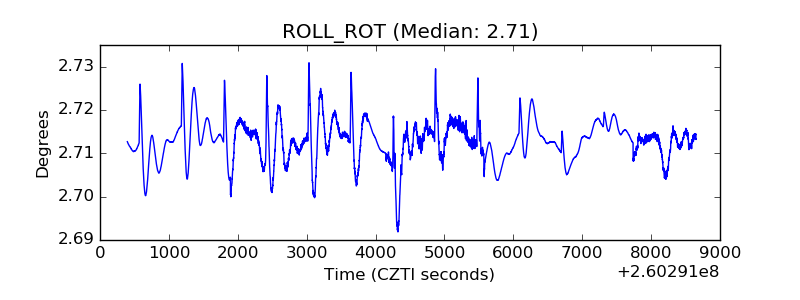 |
| _Roll_DEC | 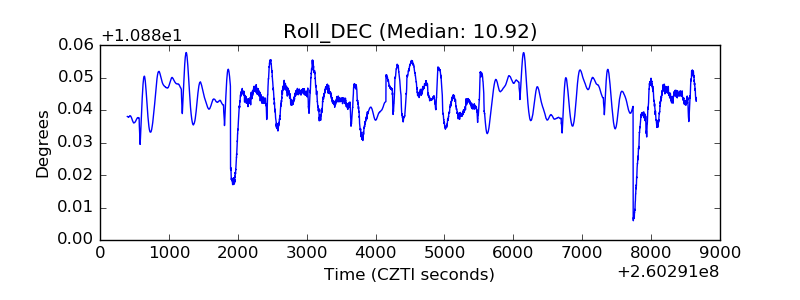 |
| _Roll_RA | 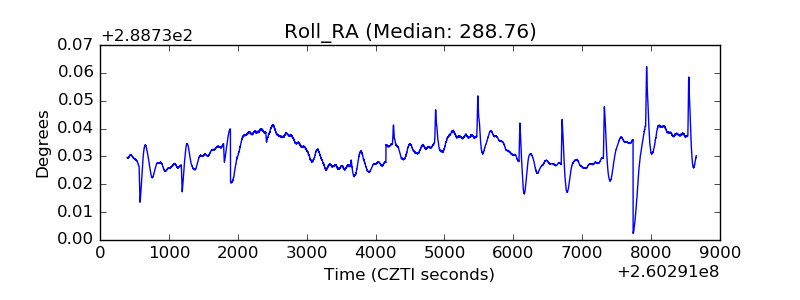 |
| Veto Counter | 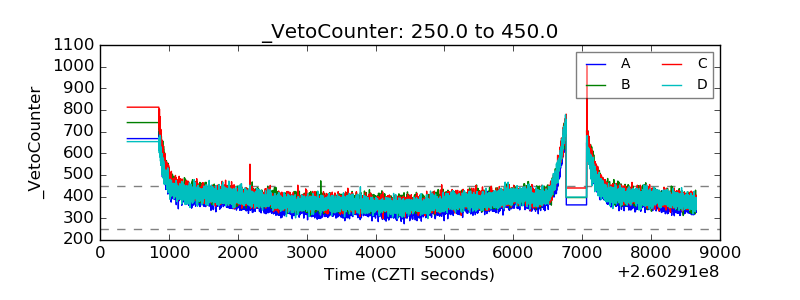 |