| Param | Original file | Final file |
|---|---|---|
| Filename | modeM0/AS1G08_047T01_9000002002cztM0_level2.fits | modeM0/AS1G08_047T01_9000002002cztM0_level2_quad_clean.evt |
| Size (bytes) | 746,706,240 | 726,618,240 |
| Size | 712.1 MB | 693.0 MB |
| Events in quadrant A | 4,581,510 | 4,391,517 |
| Events in quadrant B | 4,384,468 | 4,304,135 |
| Events in quadrant C | 4,485,918 | 4,206,636 |
| Events in quadrant D | 3,884,956 | 3,826,577 |
| Mode SS | |||
|---|---|---|---|
| Quadrant | BADHDUFLAG | Total packets | Discarded packets |
| A | 0 | 1568 | 0 |
| B | 0 | 1568 | 0 |
| C | 0 | 1568 | 0 |
| D | 0 | 1568 | 0 |
| Mode M0 | |||
|---|---|---|---|
| Quadrant | BADHDUFLAG | Total packets | Discarded packets |
| A | 0 | 159689 | 0 |
| B | 0 | 174389 | 0 |
| C | 0 | 162868 | 0 |
| D | 0 | 183695 | 0 |
| Mode M9 | |||
|---|---|---|---|
| Quadrant | BADHDUFLAG | Total packets | Discarded packets |
| A | 0 | 117 | 0 |
| B | 0 | 117 | 0 |
| C | 0 | 117 | 0 |
| D | 0 | 117 | 0 |
| Quadrant | Total seconds | Saturated seconds | Saturation percentage |
|---|---|---|---|
| A | 76959 | 705 | 0.916072% |
| B | 76959 | 2055 | 2.670253% |
| C | 76959 | 577 | 0.749750% |
| D | 76959 | 1861 | 2.418171% |
Noise dominated data is calculated using 1-second bins in cleaned event files. If a bin has >2000 counts, and if more than 50% of those come from <1% of pixels, then it is considered to be noise-dominated and hence unusable.
| Quadrant | # 1 sec bins | Bins with >0 counts | Bins with >2000 counts | High rate bins dominated by noise | Noise dominated (total time) | Noise dominated (detector-on time) | Marked lightcurve |
|---|---|---|---|---|---|---|---|
| A | 88683 | 76947 | 0 | 0 | 0.00% | 0.00% | 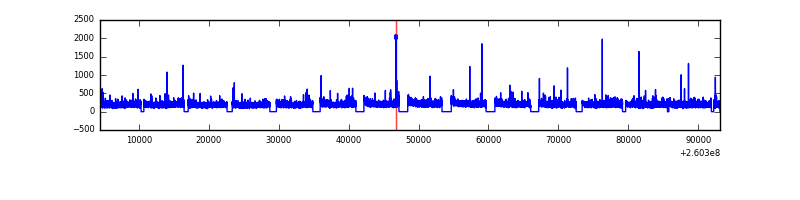 |
| B | 88683 | 76915 | 0 | 0 | 0.00% | 0.00% | 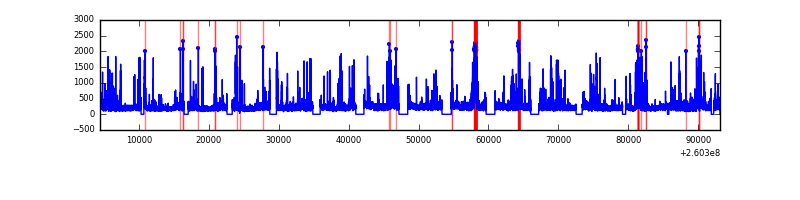 |
| C | 88683 | 76945 | 0 | 0 | 0.00% | 0.00% | 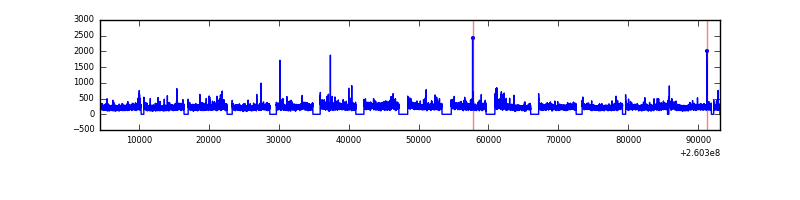 |
| D | 88683 | 76918 | 0 | 0 | 0.00% | 0.00% | 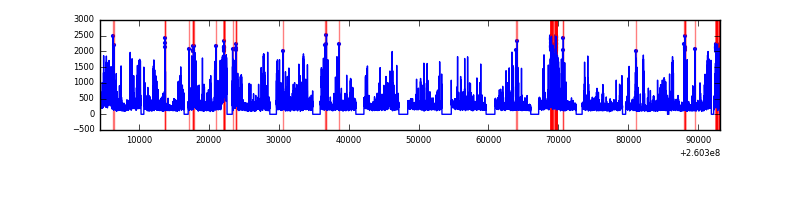 |
Top three noisy pixels from each quadrant. If the there are fewer than three noisy pixels in the level2.evt file, extra rows are filled as -1
| Pixel properties | Quadrant properties | ||||||
|---|---|---|---|---|---|---|---|
| Quadrant | DetID | PixID | Counts | Sigma | Mean | Median | Sigma |
| A | 0 | 29 | 4231 | 10.56 | 1192 | 1117 | 295.0 |
| A | 7 | 110 | 3650 | 8.59 | 1192 | 1117 | 295.0 |
| A | 9 | 19 | 3492 | 8.05 | 1192 | 1117 | 295.0 |
| B | 2 | 9 | 3645 | 11.23 | 1155 | 1103 | 226.4 |
| B | 3 | 17 | 2865 | 7.78 | 1155 | 1103 | 226.4 |
| B | 14 | 254 | 2820 | 7.58 | 1155 | 1103 | 226.4 |
| C | 1 | 80 | 3376 | 7.42 | 1185 | 1105 | 306.0 |
| C | 12 | 241 | 3319 | 7.24 | 1185 | 1105 | 306.0 |
| C | 1 | 81 | 3286 | 7.13 | 1185 | 1105 | 306.0 |
| D | 3 | 14 | 2964 | 6.61 | 1110 | 1011 | 295.5 |
| D | 6 | 231 | 2910 | 6.43 | 1110 | 1011 | 295.5 |
| D | 3 | 31 | 2707 | 5.74 | 1110 | 1011 | 295.5 |
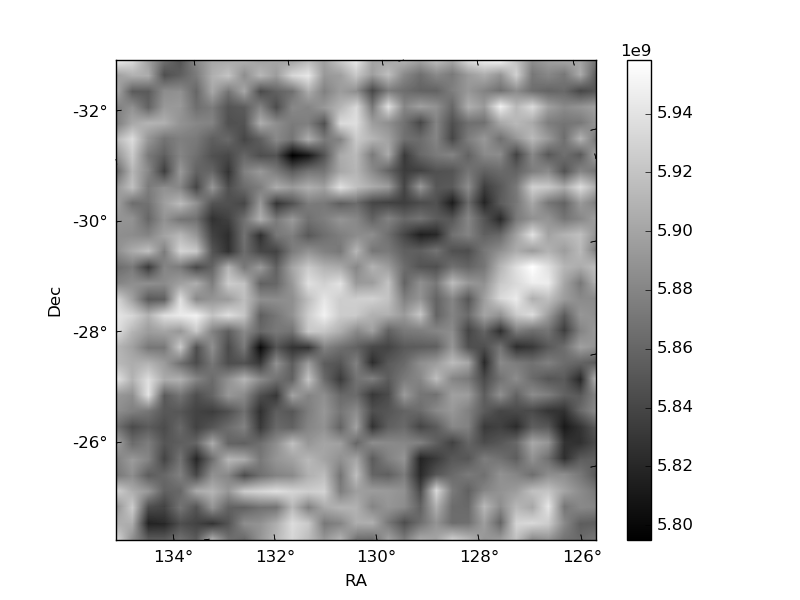
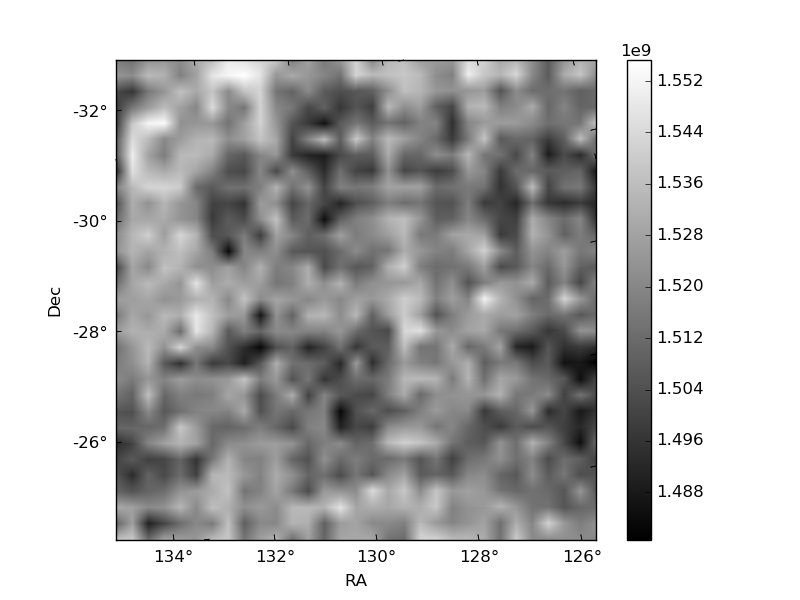
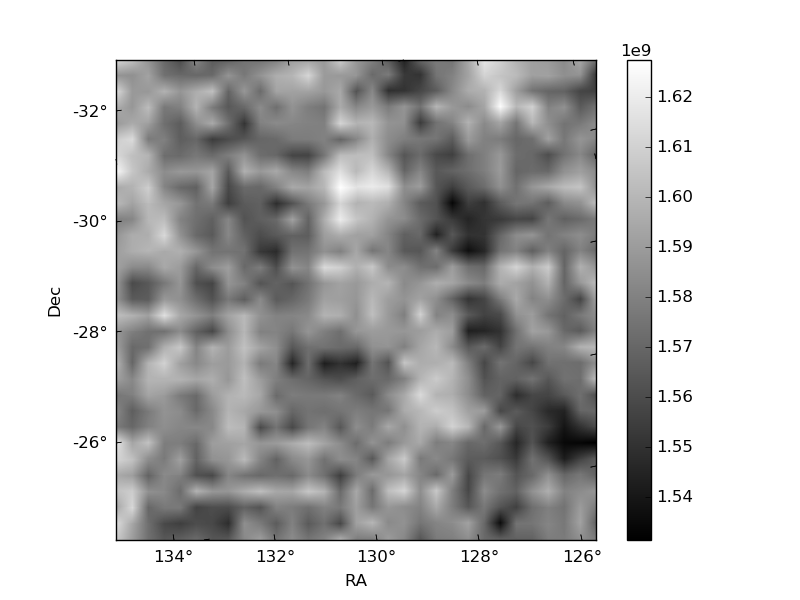
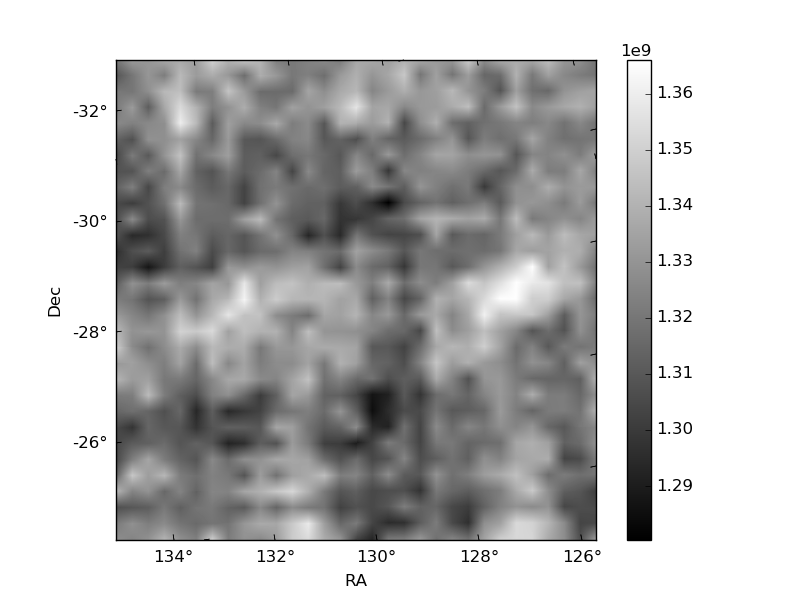
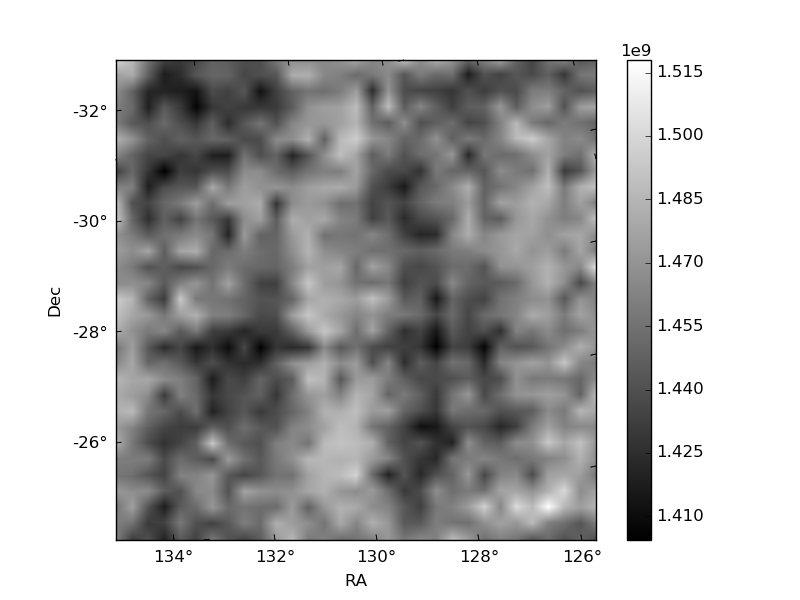
Histogram calculated using DETX and DETY for each event in the final _common_clean file
| Quadrant A | 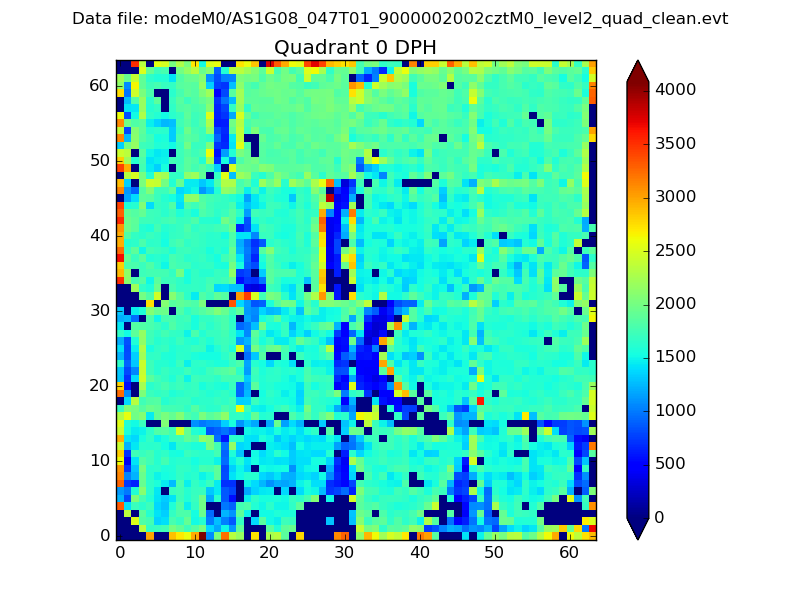 |
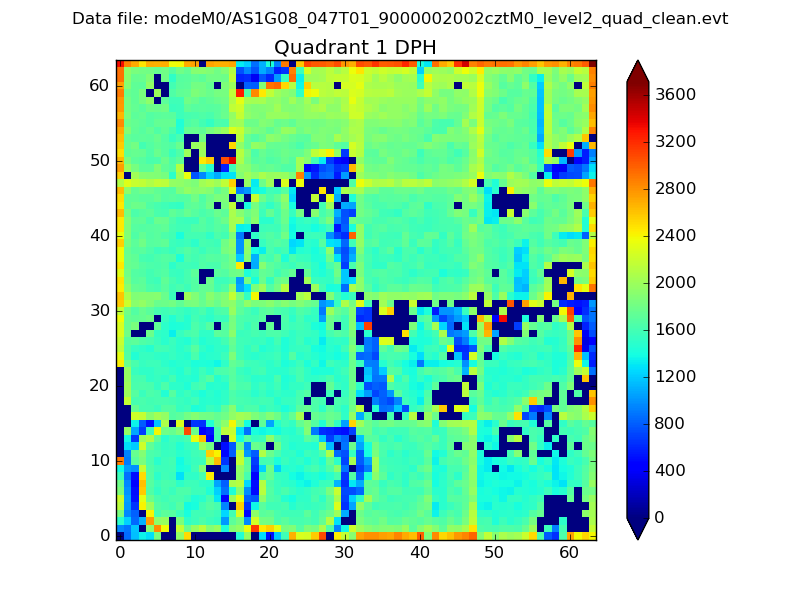 |
Quadrant B |
|---|---|---|---|
| Quadrant D | 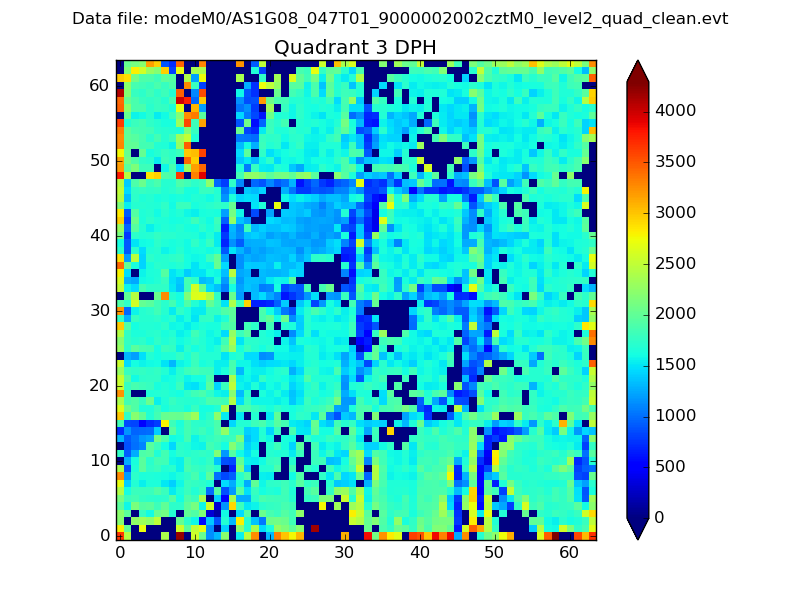 |
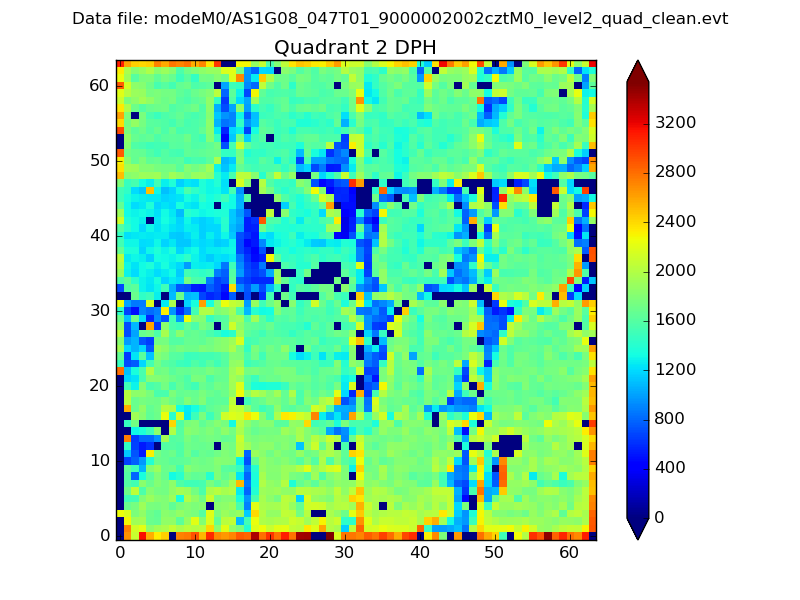 |
Quadrant C |
| Plot type | Count rate plots | Images |
|---|---|---|
| Comparison with Poisson distribution Blue bars denote a histogram of data divided into 1 sec bins. Red curve is a Poisson curve with rate = median count rate of data. |
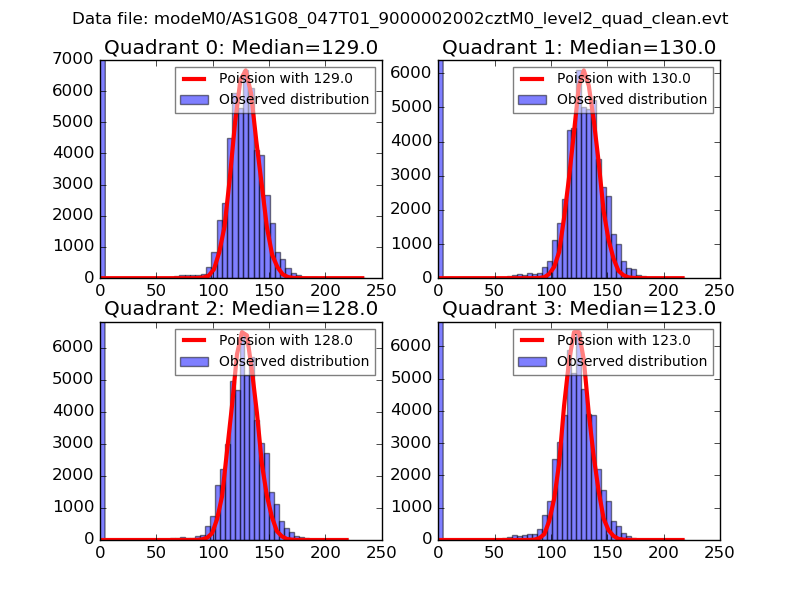 |
 |
| Quadrant-wise count rates Data is divided into 100 sec bins |
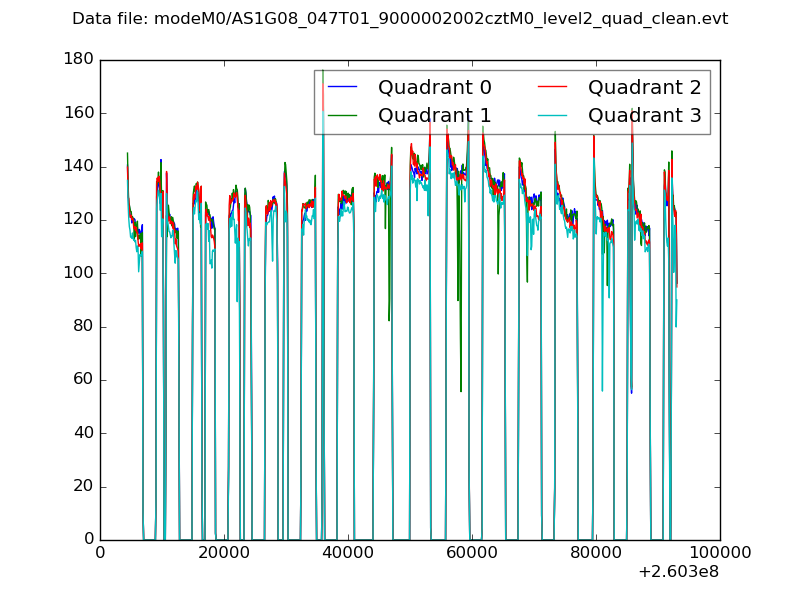 |
|
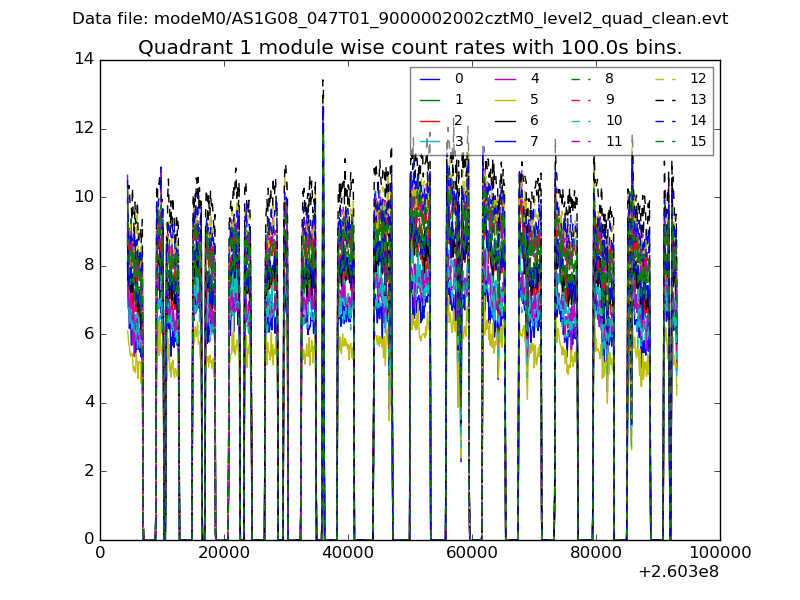
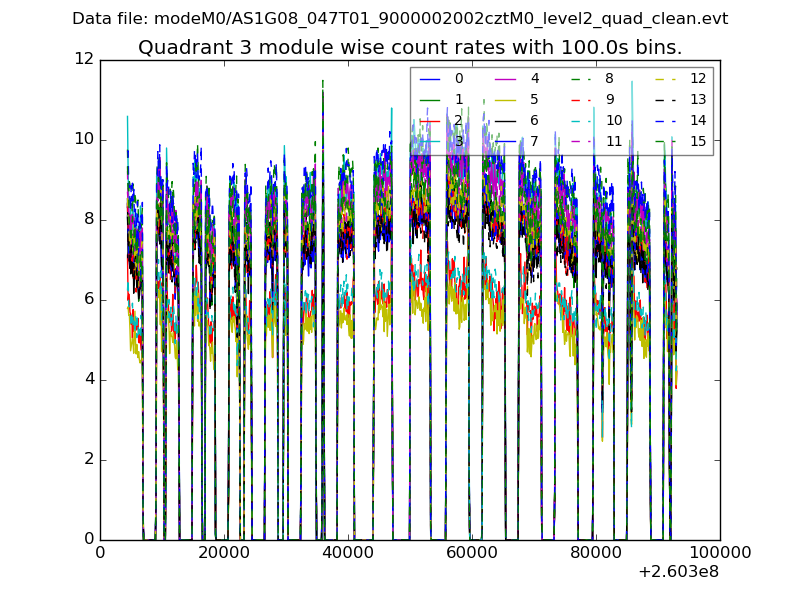
| Module-wise count rates for Quadrant A Data is divided into 100 sec bins |
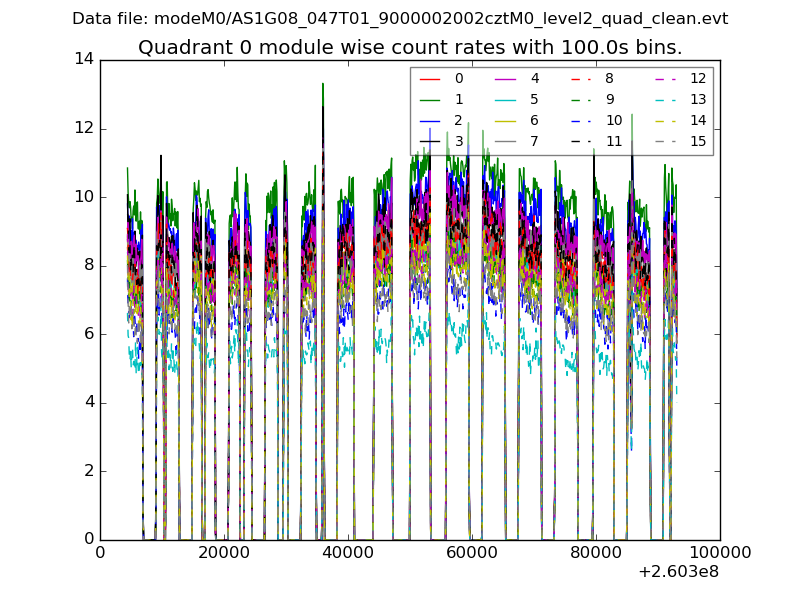 |
 |
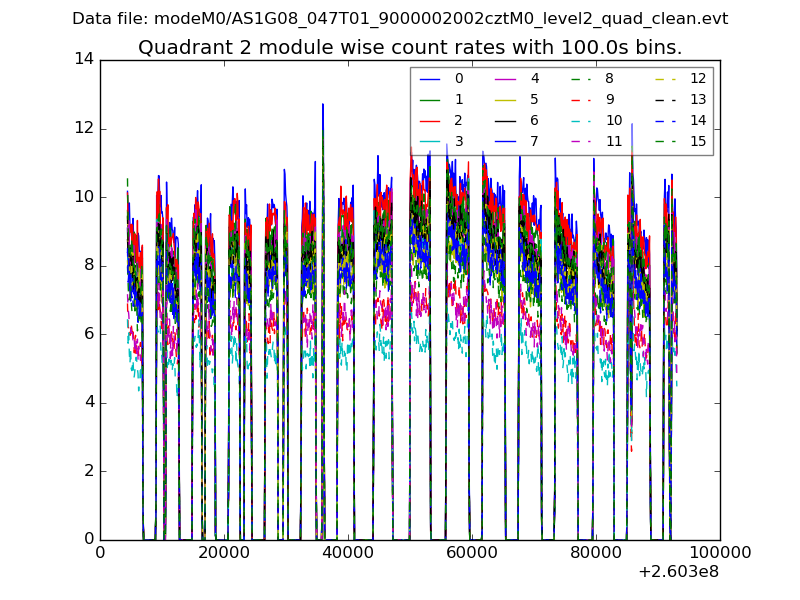
| Module-wise count rates for Quadrant B Data is divided into 100 sec bins |
 |
 |
| Module-wise count rates for Quadrant C Data is divided into 100 sec bins |
 |
 |
| Module-wise count rates for Quadrant D Data is divided into 100 sec bins |
 |
 |
| Parameter | Plot |
|---|---|
| CZT HV Monitor | 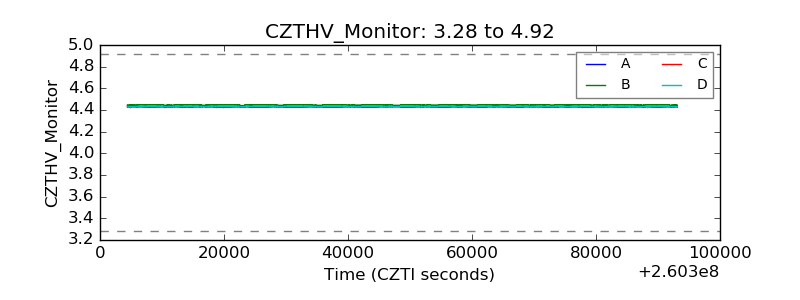 |
| D_VDD | 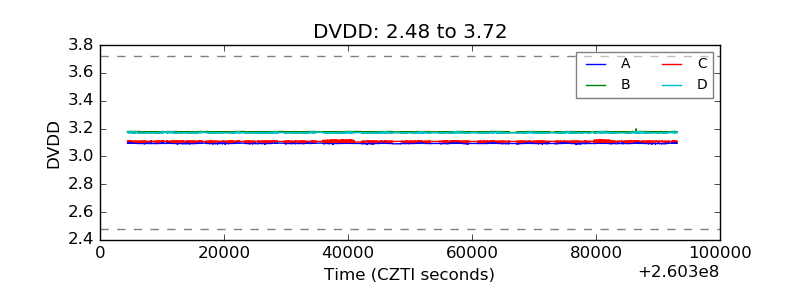 |
| Temperature 1 | 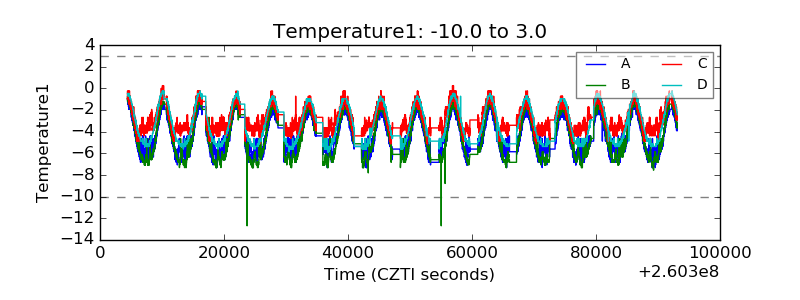 |
| Veto HV Monitor | 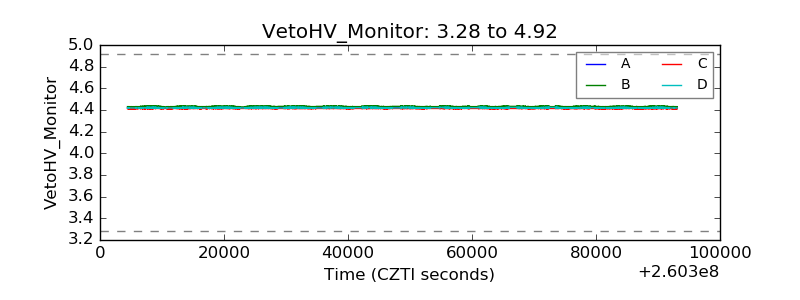 |
| Veto LLD | 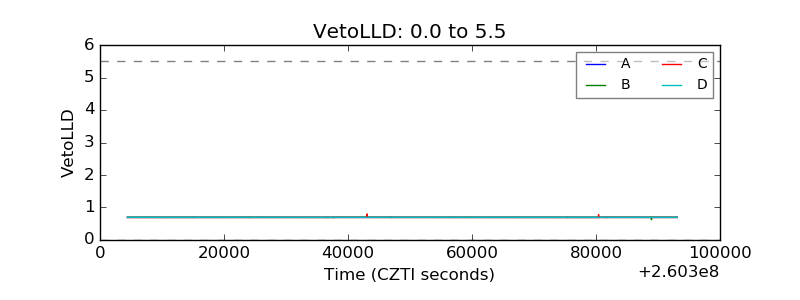 |
| Alpha Counter | 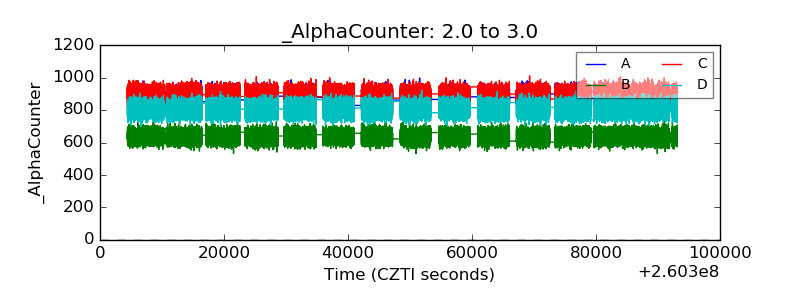 |
| _CPM_Rate | 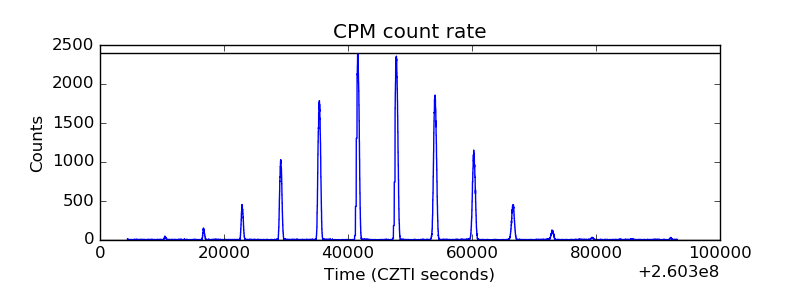 |
| CZT Counter | 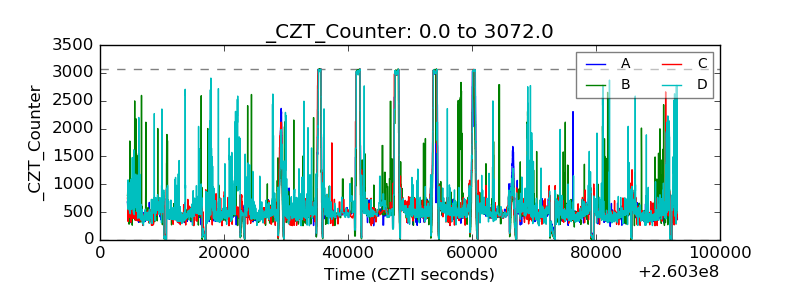 |
| +2.5 Volts monitor | 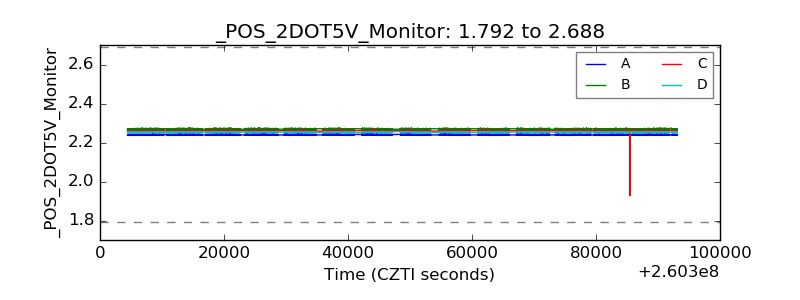 |
| +5 Volts monitor | 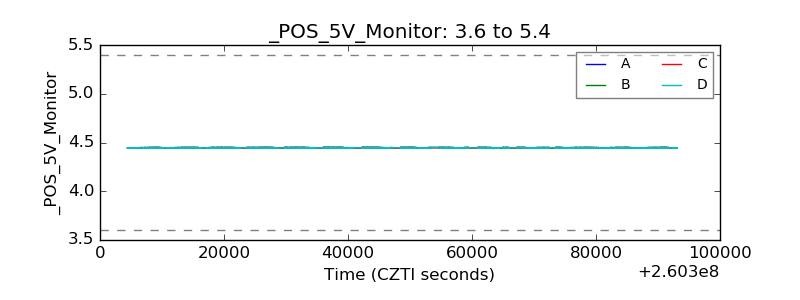 |
| _ROLL_ROT | 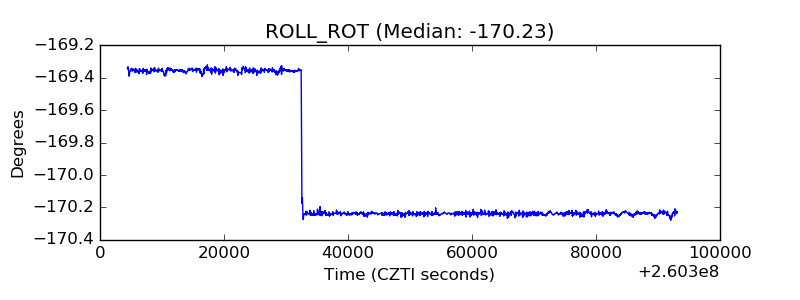 |
| _Roll_DEC | 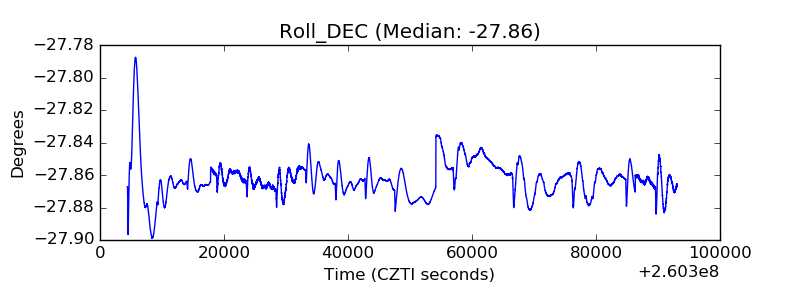 |
| _Roll_RA | 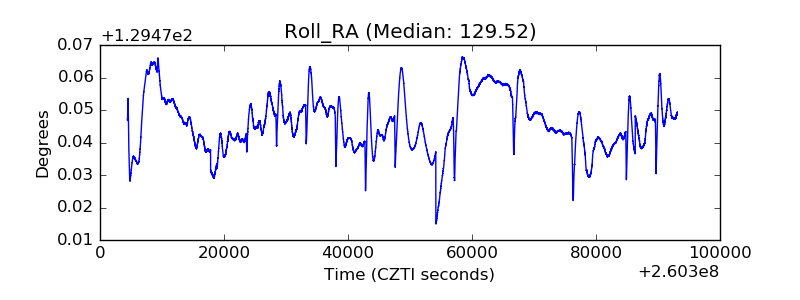 |
| Veto Counter | 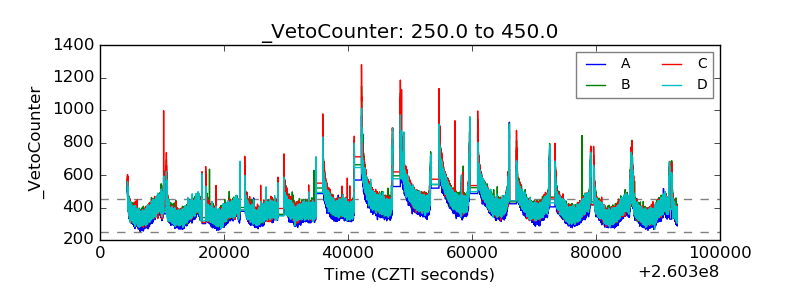 |