| Param | Original file | Final file |
|---|---|---|
| Filename | modeM0/AS1G08_047T01_9000002002_13567cztM0_level2.evt | modeM0/AS1G08_047T01_9000002002_13567cztM0_level2_quad_clean.evt |
| Size (bytes) | 114,382,080 | 26,853,120 |
| Size | 109.1 MB | 25.6 MB |
| Events in quadrant A | 697,469 | 178,287 |
| Events in quadrant B | 841,911 | 178,944 |
| Events in quadrant C | 690,285 | 177,871 |
| Events in quadrant D | 1,133,199 | 169,836 |
| Mode SS | |||
|---|---|---|---|
| Quadrant | BADHDUFLAG | Total packets | Discarded packets |
| A | 0 | 28 | 0 |
| B | 0 | 28 | 0 |
| C | 0 | 28 | 0 |
| D | 0 | 28 | 0 |
| Mode M0 | |||
|---|---|---|---|
| Quadrant | BADHDUFLAG | Total packets | Discarded packets |
| A | 0 | 3018 | 1 |
| B | 0 | 3453 | 0 |
| C | 0 | 3006 | 0 |
| D | 0 | 4494 | 0 |
| Quadrant | Total seconds | Saturated seconds | Saturation percentage |
|---|---|---|---|
| A | 1453 | 3 | 0.206469% |
| B | 1453 | 22 | 1.514109% |
| C | 1453 | 0 | 0.000000% |
| D | 1453 | 13 | 0.894701% |
Noise dominated data is calculated using 1-second bins in cleaned event files. If a bin has >2000 counts, and if more than 50% of those come from <1% of pixels, then it is considered to be noise-dominated and hence unusable.
| Quadrant | # 1 sec bins | Bins with >0 counts | Bins with >2000 counts | High rate bins dominated by noise | Noise dominated (total time) | Noise dominated (detector-on time) | Marked lightcurve |
|---|---|---|---|---|---|---|---|
| A | 1454 | 1454 | 0 | 0 | 0.00% | 0.00% | 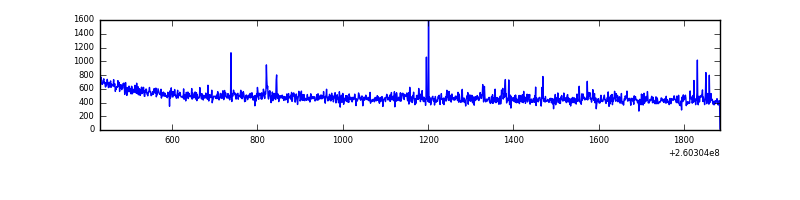 |
| B | 1454 | 1454 | 17 | 17 | 1.17% | 1.17% | 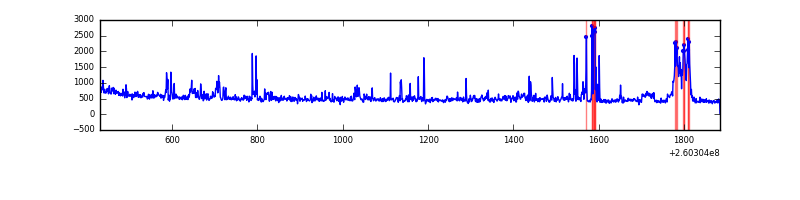 |
| C | 1454 | 1454 | 0 | 0 | 0.00% | 0.00% | 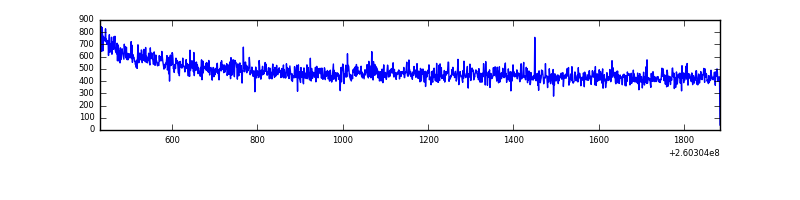 |
| D | 1454 | 1454 | 15 | 15 | 1.03% | 1.03% | 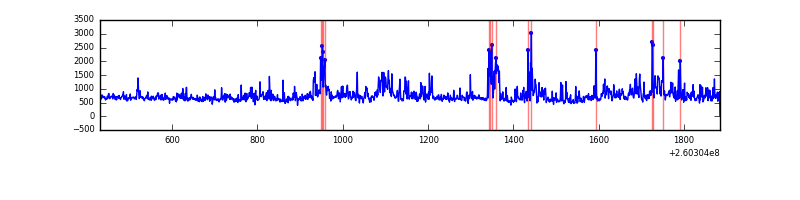 |
Top three noisy pixels from each quadrant. If the there are fewer than three noisy pixels in the level2.evt file, extra rows are filled as -1
| Pixel properties | Quadrant properties | ||||||
|---|---|---|---|---|---|---|---|
| Quadrant | DetID | PixID | Counts | Sigma | Mean | Median | Sigma |
| A | 1 | 162 | 12518 | 326.12 | 174 | 169 | 37.9 |
| A | 1 | 178 | 4470 | 113.58 | 174 | 169 | 37.9 |
| A | 1 | 161 | 4188 | 106.14 | 174 | 169 | 37.9 |
| B | 0 | 190 | 51731 | 1452.54 | 171 | 166 | 35.5 |
| B | 10 | 246 | 39814 | 1116.85 | 171 | 166 | 35.5 |
| B | 0 | 182 | 35104 | 984.17 | 171 | 166 | 35.5 |
| C | 3 | 233 | 52190 | 1302.23 | 163 | 164 | 40.0 |
| C | 13 | 61 | 1221 | 26.46 | 163 | 164 | 40.0 |
| C | -1 | -1 | -1 | -1.0 | 163 | 164 | 40.0 |
| D | 8 | 195 | 218579 | 5089.14 | 165 | 160 | 42.9 |
| D | 5 | 222 | 195118 | 4542.5 | 165 | 160 | 42.9 |
| D | 1 | 20 | 43452 | 1008.7 | 165 | 160 | 42.9 |
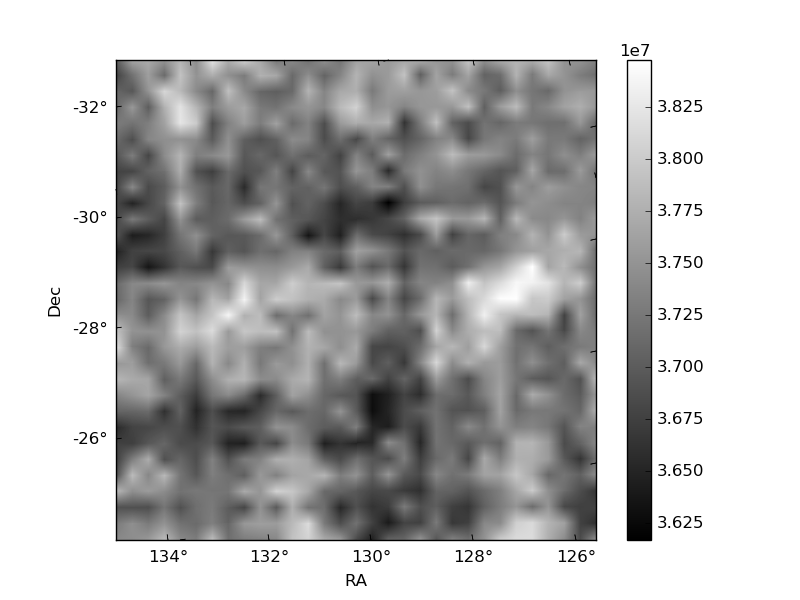
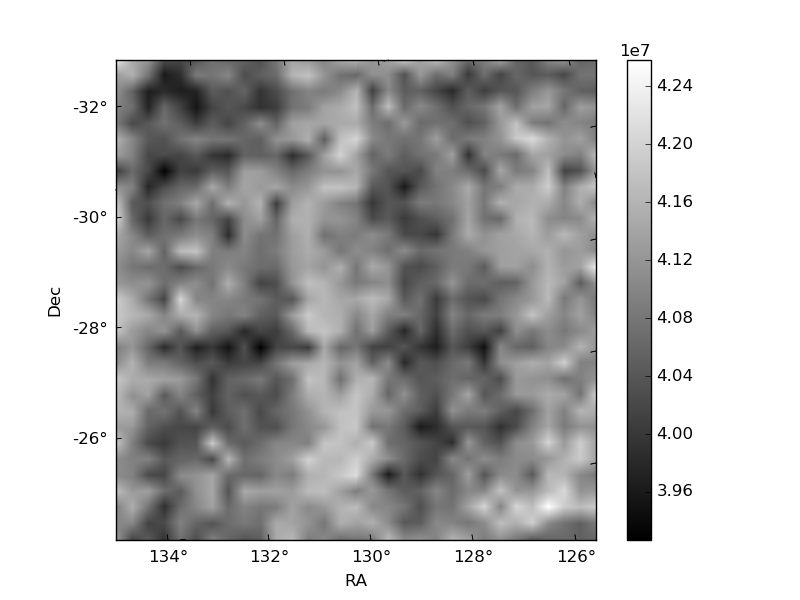
Histogram calculated using DETX and DETY for each event in the final _common_clean file
| Quadrant A | 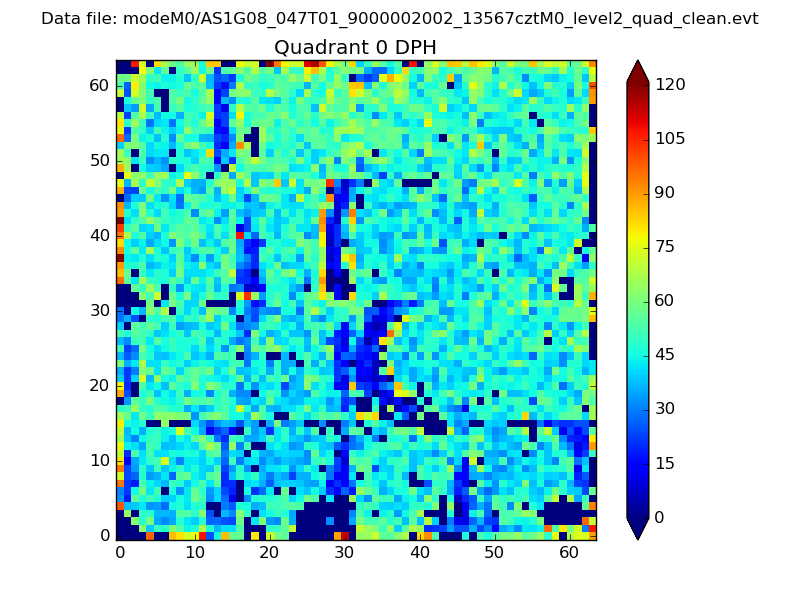 |
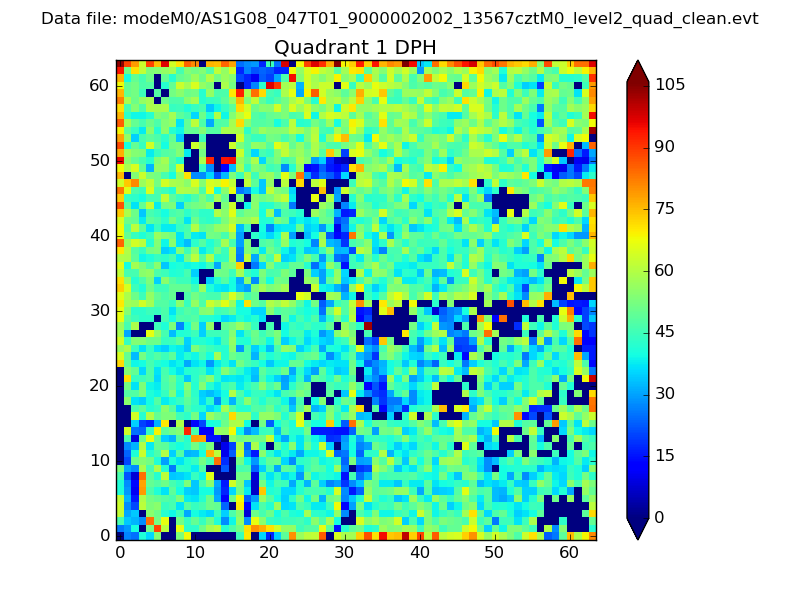 |
Quadrant B |
|---|---|---|---|
| Quadrant D | 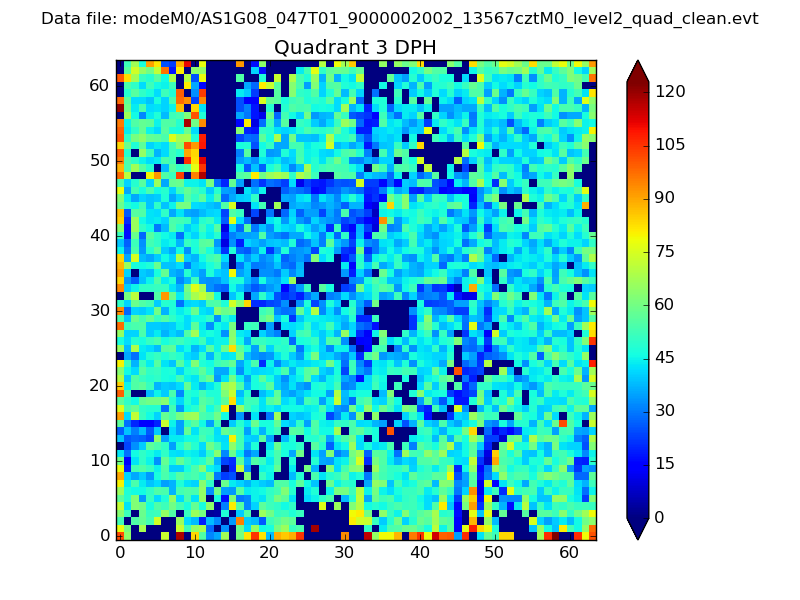 |
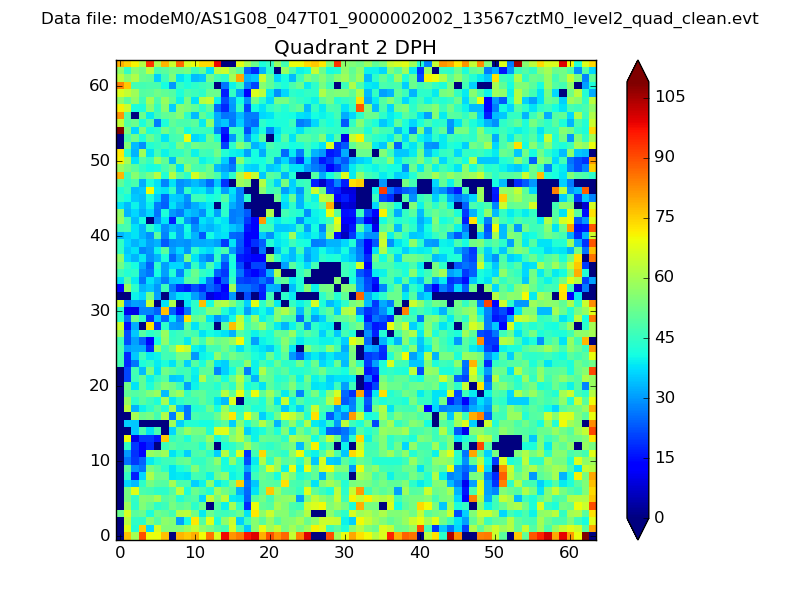 |
Quadrant C |
| Plot type | Count rate plots | Images |
|---|---|---|
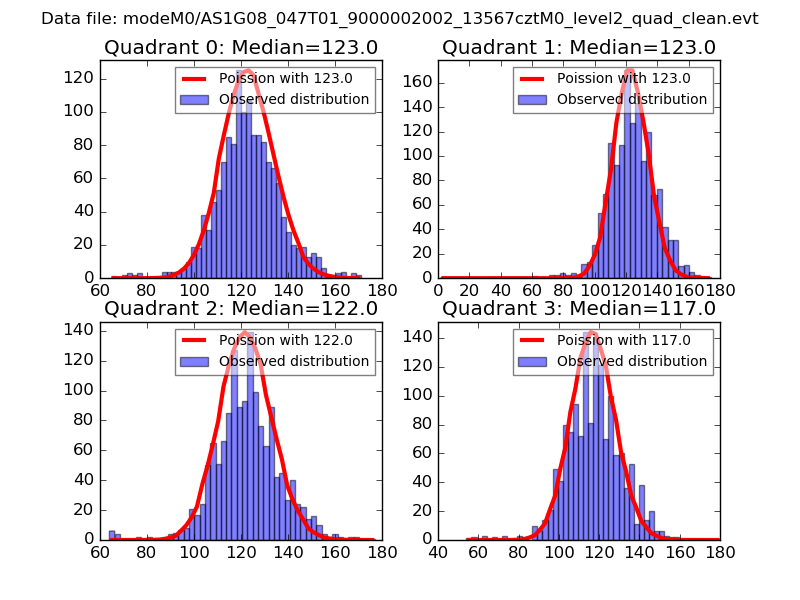
| Comparison with Poisson distribution Blue bars denote a histogram of data divided into 1 sec bins. Red curve is a Poisson curve with rate = median count rate of data. |
 |
 |
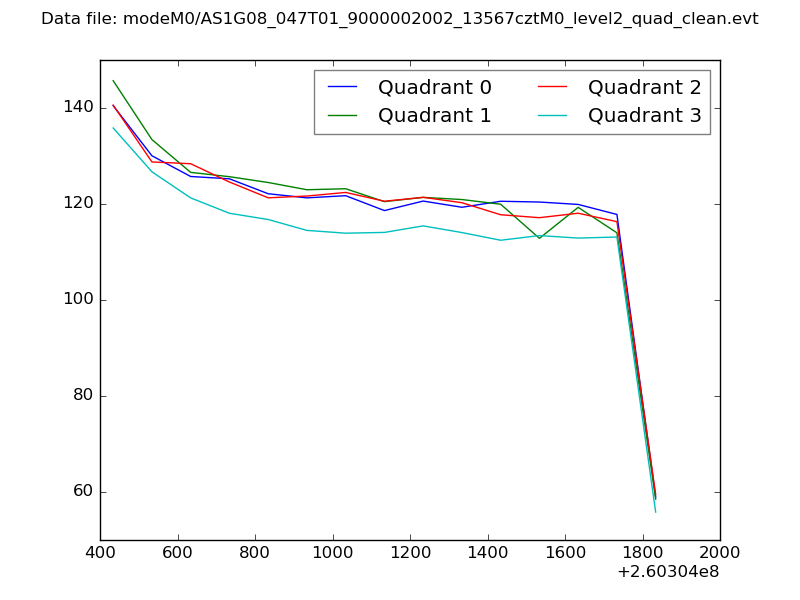
| Quadrant-wise count rates Data is divided into 100 sec bins |
 |
|
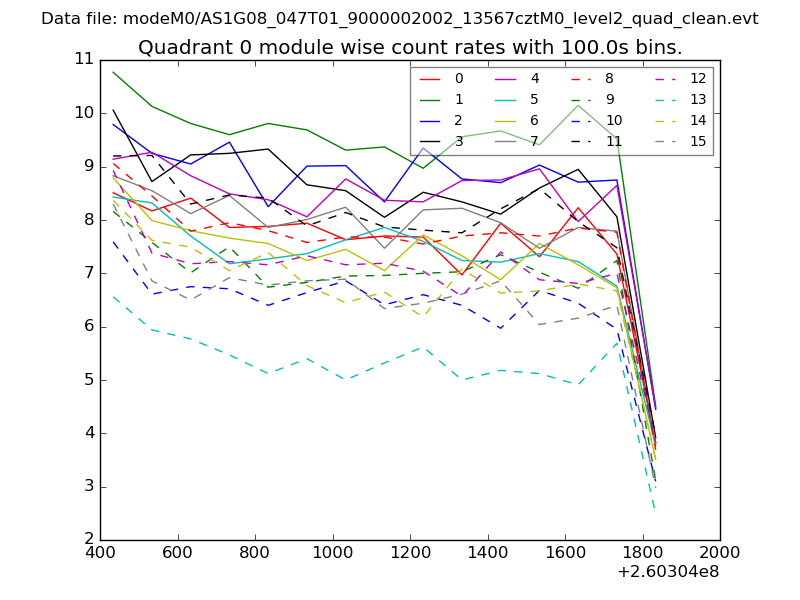
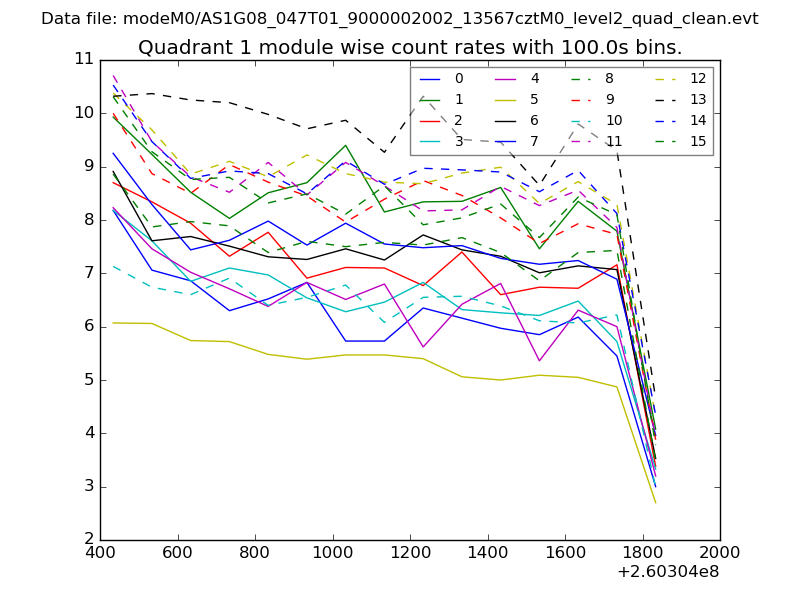
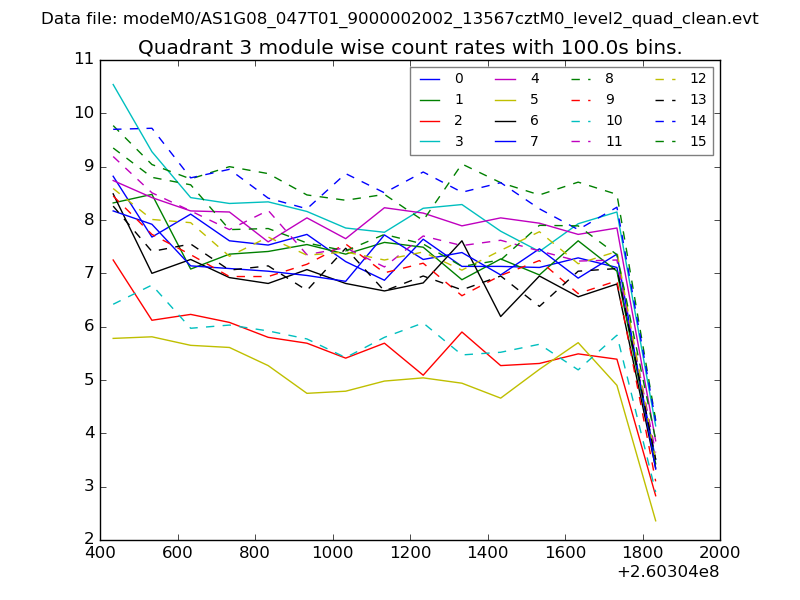
| Module-wise count rates for Quadrant A Data is divided into 100 sec bins |
 |
 |
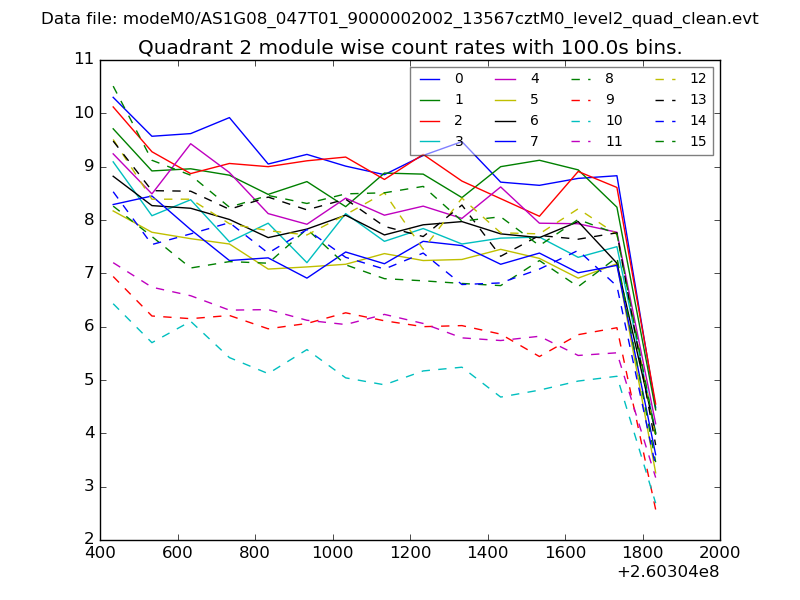
| Module-wise count rates for Quadrant B Data is divided into 100 sec bins |
 |
 |
| Module-wise count rates for Quadrant C Data is divided into 100 sec bins |
 |
 |
| Module-wise count rates for Quadrant D Data is divided into 100 sec bins |
 |
 |
| Parameter | Plot |
|---|---|
| CZT HV Monitor | 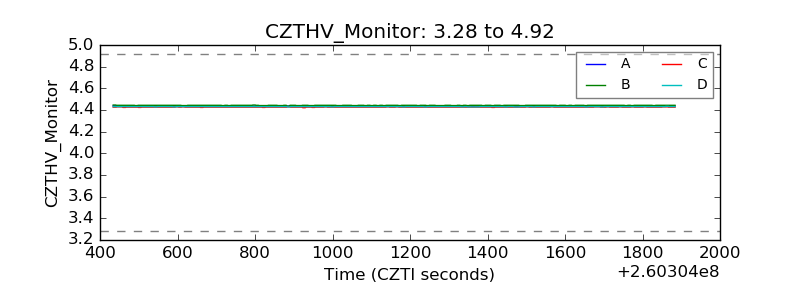 |
| D_VDD | 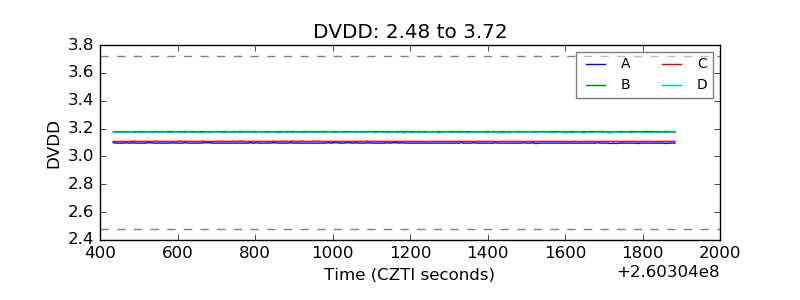 |
| Temperature 1 | 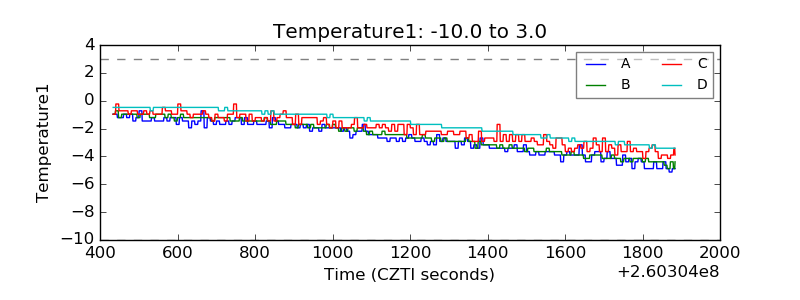 |
| Veto HV Monitor | 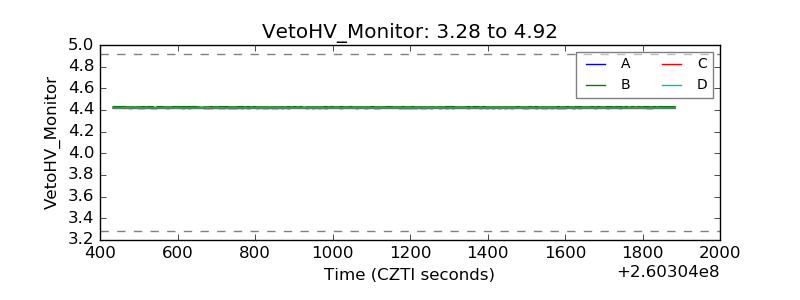 |
| Veto LLD |  |
| Alpha Counter | 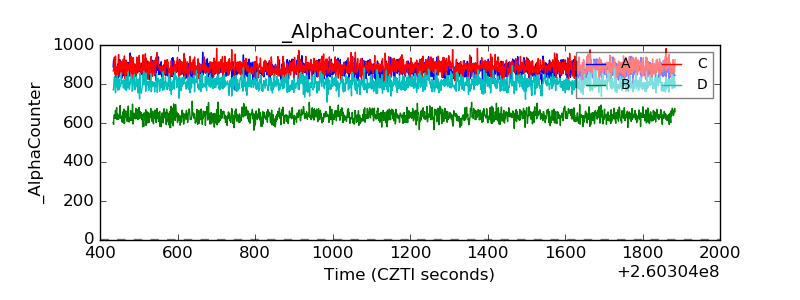 |
| _CPM_Rate | 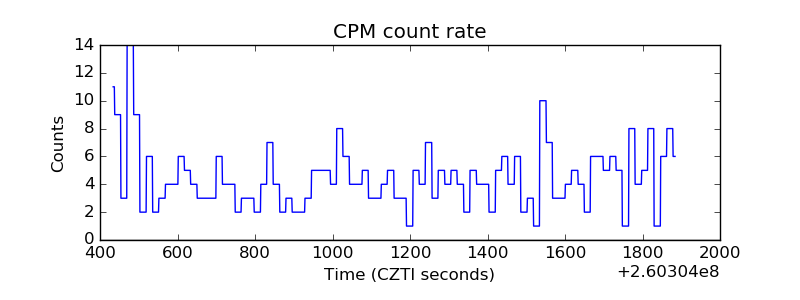 |
| CZT Counter | 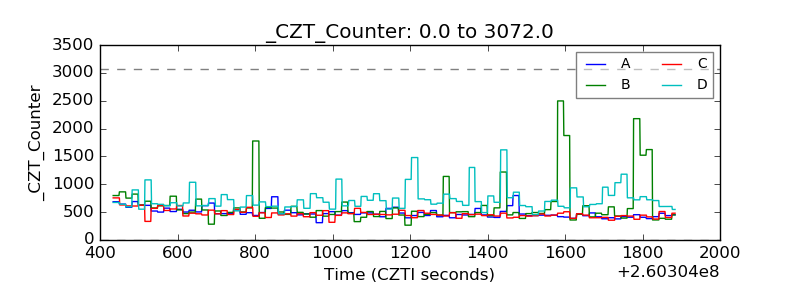 |
| +2.5 Volts monitor |  |
| +5 Volts monitor |  |
| _ROLL_ROT | 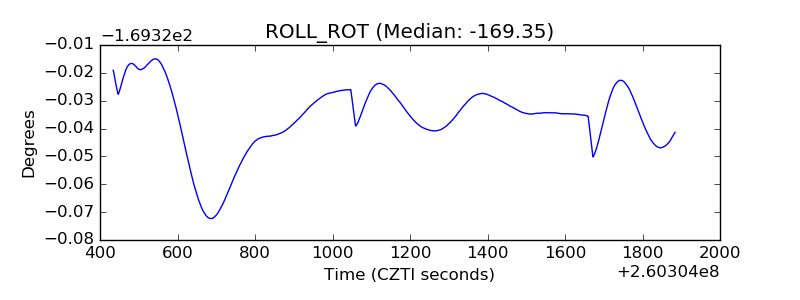 |
| _Roll_DEC | 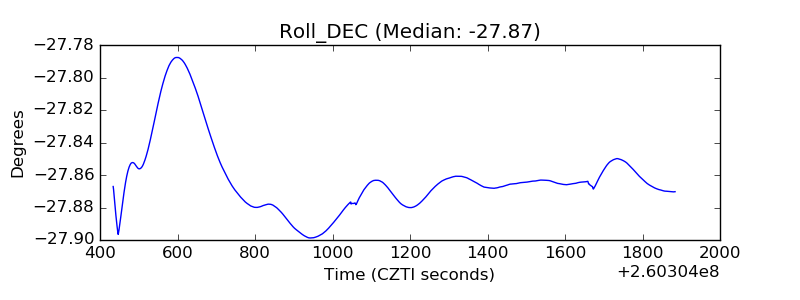 |
| _Roll_RA | 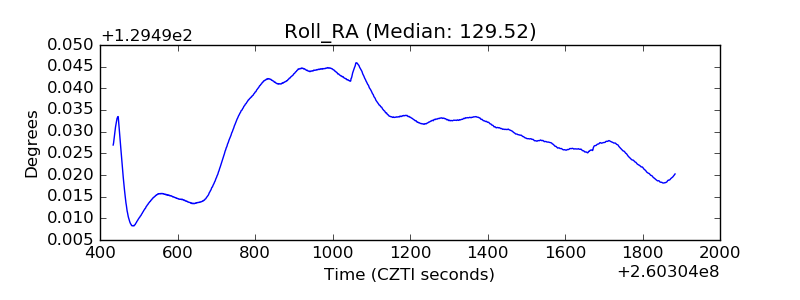 |
| Veto Counter | 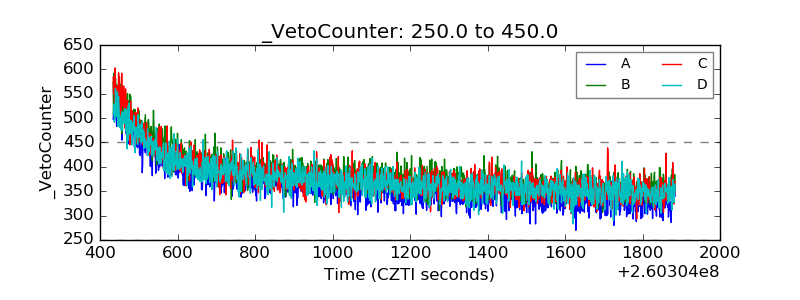 |