| Param | Original file | Final file |
|---|---|---|
| Filename | modeM0/AS1G08_047T01_9000002002_13568cztM0_level2.evt | modeM0/AS1G08_047T01_9000002002_13568cztM0_level2_quad_clean.evt |
| Size (bytes) | 528,145,920 | 101,548,800 |
| Size | 503.7 MB | 96.8 MB |
| Events in quadrant A | 3,426,394 | 649,041 |
| Events in quadrant B | 3,898,452 | 648,136 |
| Events in quadrant C | 3,558,371 | 644,048 |
| Events in quadrant D | 4,605,907 | 615,557 |
| Mode SS | |||
|---|---|---|---|
| Quadrant | BADHDUFLAG | Total packets | Discarded packets |
| A | 0 | 150 | 0 |
| B | 0 | 150 | 0 |
| C | 0 | 150 | 0 |
| D | 0 | 150 | 0 |
| Mode M0 | |||
|---|---|---|---|
| Quadrant | BADHDUFLAG | Total packets | Discarded packets |
| A | 0 | 15295 | 2 |
| B | 0 | 16569 | 1 |
| C | 0 | 15489 | 1 |
| D | 0 | 18904 | 1 |
| Mode M9 | |||
|---|---|---|---|
| Quadrant | BADHDUFLAG | Total packets | Discarded packets |
| A | 0 | 4 | 0 |
| B | 0 | 4 | 0 |
| C | 0 | 4 | 0 |
| D | 0 | 4 | 0 |
| Quadrant | Total seconds | Saturated seconds | Saturation percentage |
|---|---|---|---|
| A | 7455 | 14 | 0.187793% |
| B | 7455 | 157 | 2.105969% |
| C | 7455 | 20 | 0.268276% |
| D | 7455 | 118 | 1.582830% |
Noise dominated data is calculated using 1-second bins in cleaned event files. If a bin has >2000 counts, and if more than 50% of those come from <1% of pixels, then it is considered to be noise-dominated and hence unusable.
| Quadrant | # 1 sec bins | Bins with >0 counts | Bins with >2000 counts | High rate bins dominated by noise | Noise dominated (total time) | Noise dominated (detector-on time) | Marked lightcurve |
|---|---|---|---|---|---|---|---|
| A | 7856 | 7457 | 0 | 0 | 0.00% | 0.00% | 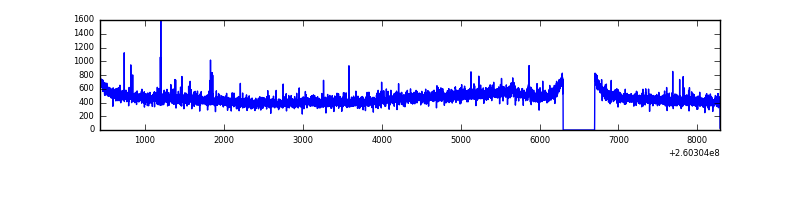 |
| B | 7856 | 7457 | 59 | 59 | 0.75% | 0.79% | 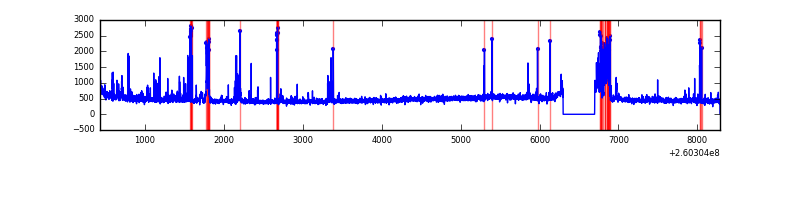 |
| C | 7856 | 7457 | 0 | 0 | 0.00% | 0.00% | 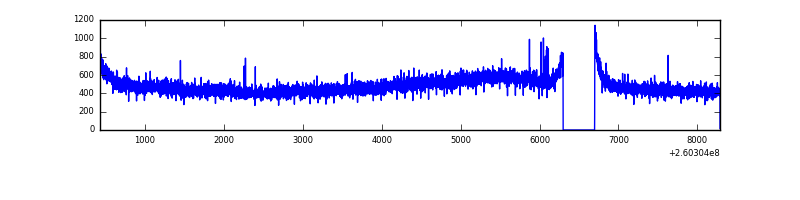 |
| D | 7856 | 7457 | 107 | 107 | 1.36% | 1.43% | 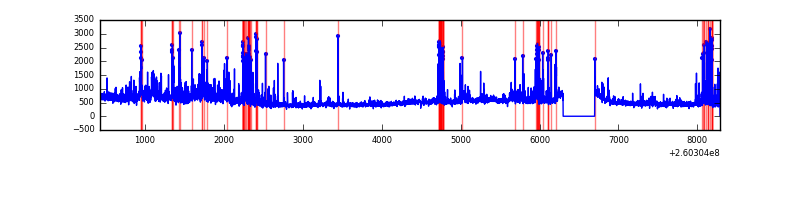 |
Top three noisy pixels from each quadrant. If the there are fewer than three noisy pixels in the level2.evt file, extra rows are filled as -1
| Pixel properties | Quadrant properties | ||||||
|---|---|---|---|---|---|---|---|
| Quadrant | DetID | PixID | Counts | Sigma | Mean | Median | Sigma |
| A | 1 | 162 | 21797 | 116.52 | 877 | 857 | 179.7 |
| A | 0 | 226 | 8136 | 40.5 | 877 | 857 | 179.7 |
| A | 1 | 178 | 7646 | 37.78 | 877 | 857 | 179.7 |
| B | 0 | 182 | 204990 | 1212.01 | 871 | 851 | 168.4 |
| B | 3 | 64 | 59190 | 346.37 | 871 | 851 | 168.4 |
| B | 4 | 142 | 53408 | 312.04 | 871 | 851 | 168.4 |
| C | 3 | 233 | 266150 | 1351.54 | 842 | 846 | 196.3 |
| C | 0 | 207 | 8684 | 39.93 | 842 | 846 | 196.3 |
| C | 13 | 61 | 6081 | 26.67 | 842 | 846 | 196.3 |
| D | 8 | 195 | 478647 | 2335.59 | 838 | 812 | 204.6 |
| D | 5 | 222 | 422895 | 2063.08 | 838 | 812 | 204.6 |
| D | 2 | 14 | 147704 | 717.98 | 838 | 812 | 204.6 |
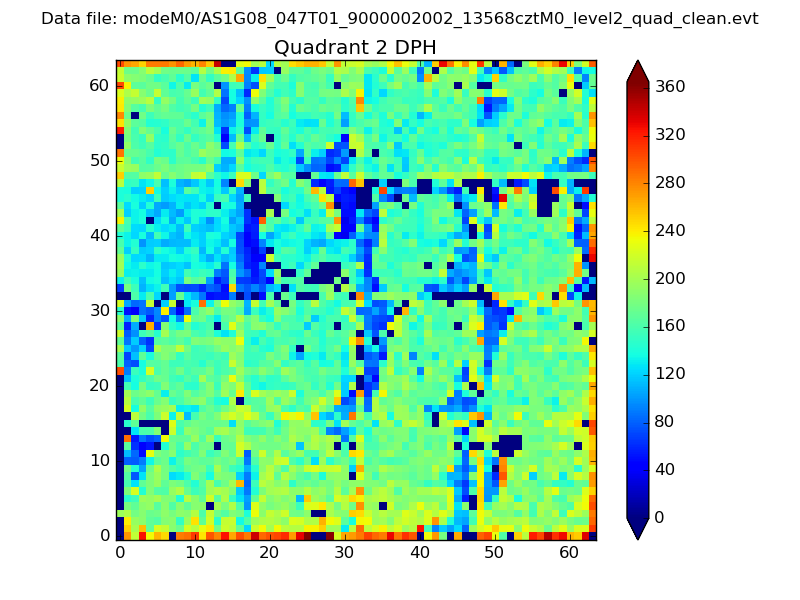
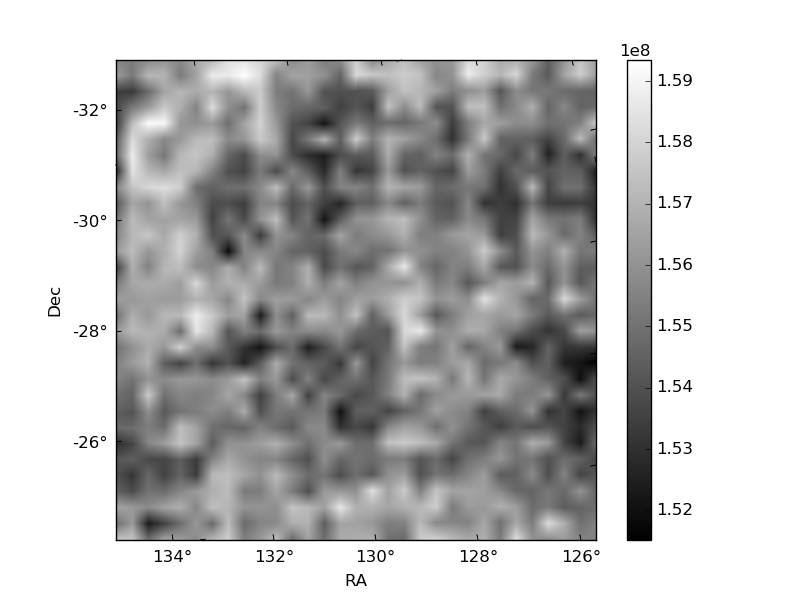
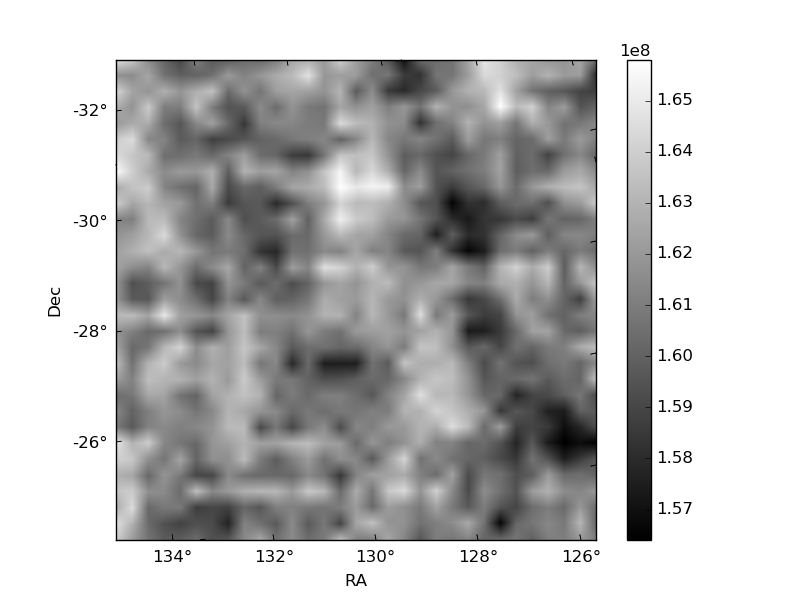
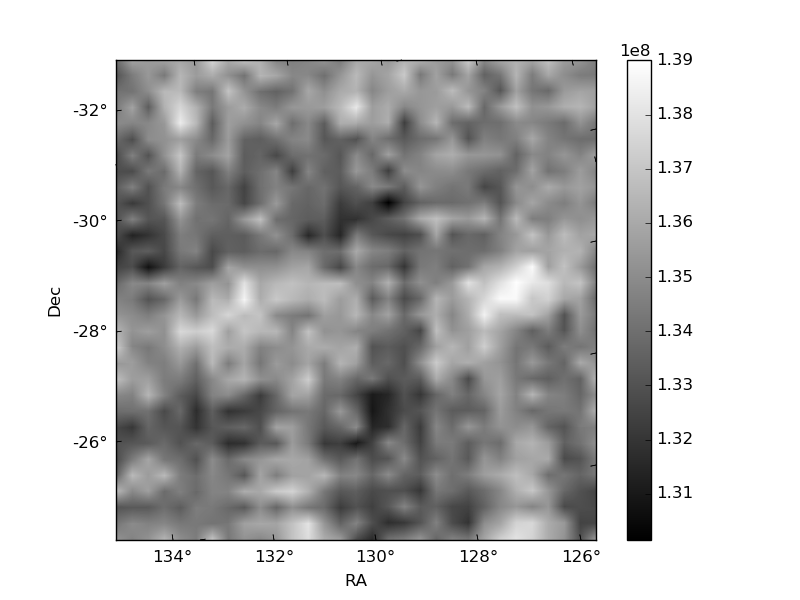
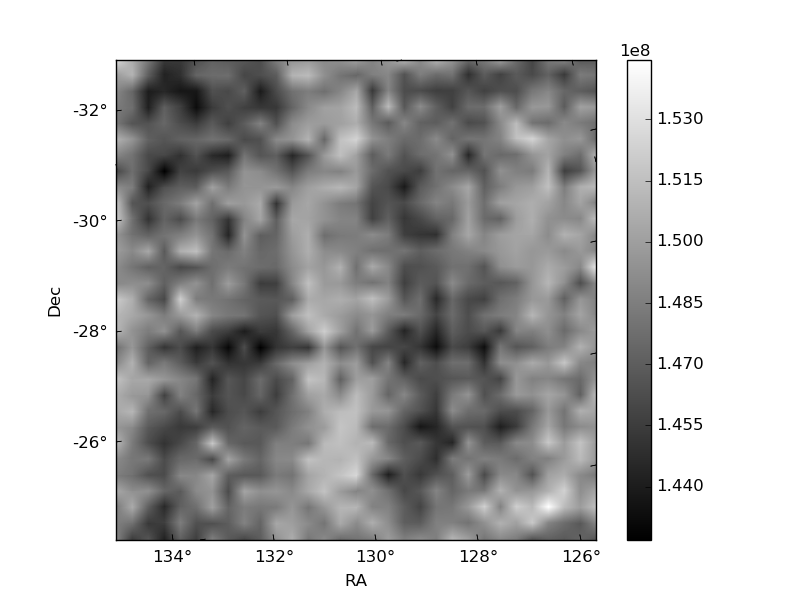
Histogram calculated using DETX and DETY for each event in the final _common_clean file
| Quadrant A |  |
 |
Quadrant B |
|---|---|---|---|
| Quadrant D | 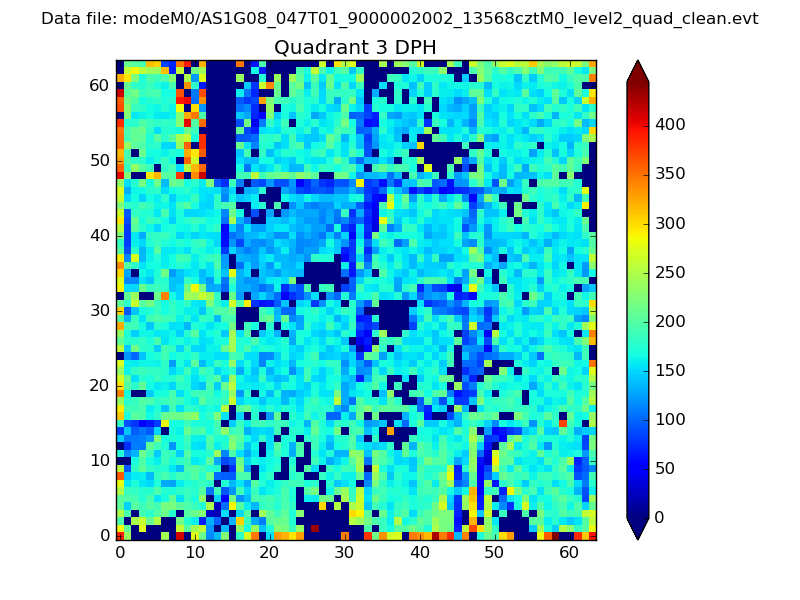 |
 |
Quadrant C |
| Plot type | Count rate plots | Images |
|---|---|---|
| Comparison with Poisson distribution Blue bars denote a histogram of data divided into 1 sec bins. Red curve is a Poisson curve with rate = median count rate of data. |
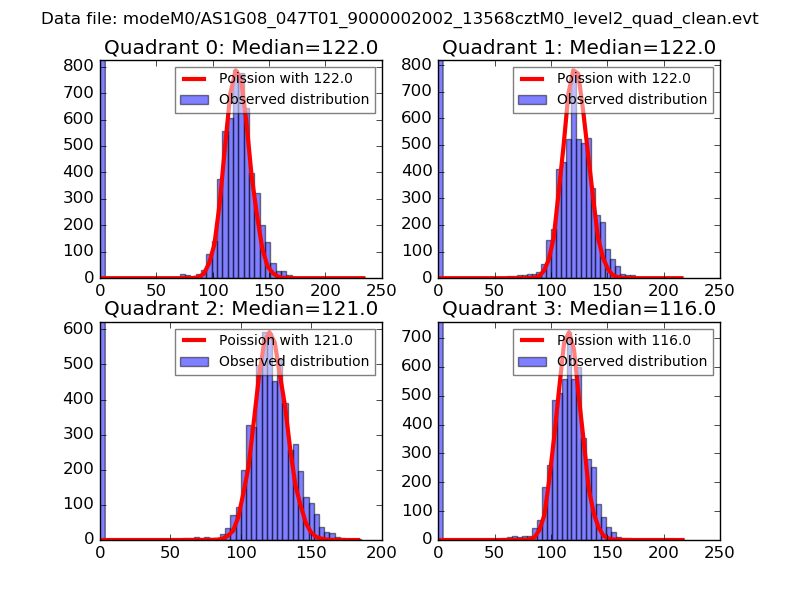 |
 |
| Quadrant-wise count rates Data is divided into 100 sec bins |
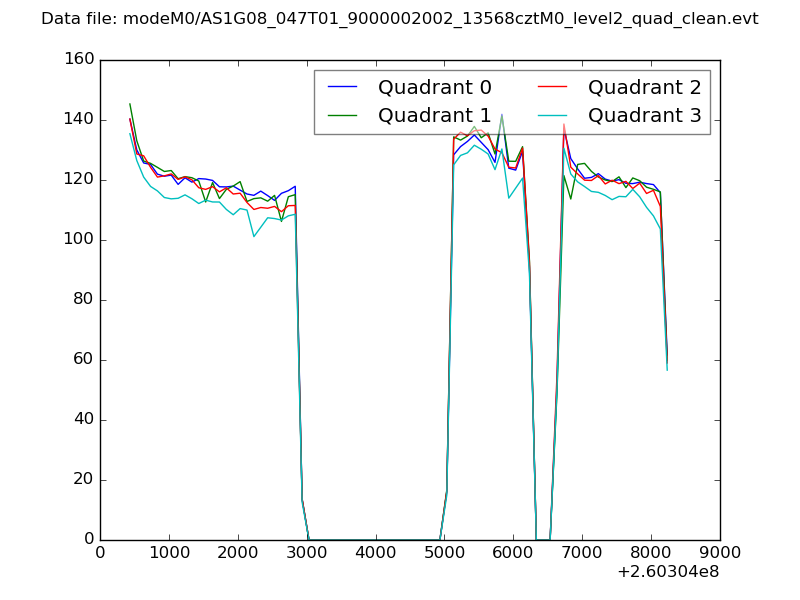 |
|
| Module-wise count rates for Quadrant A Data is divided into 100 sec bins |
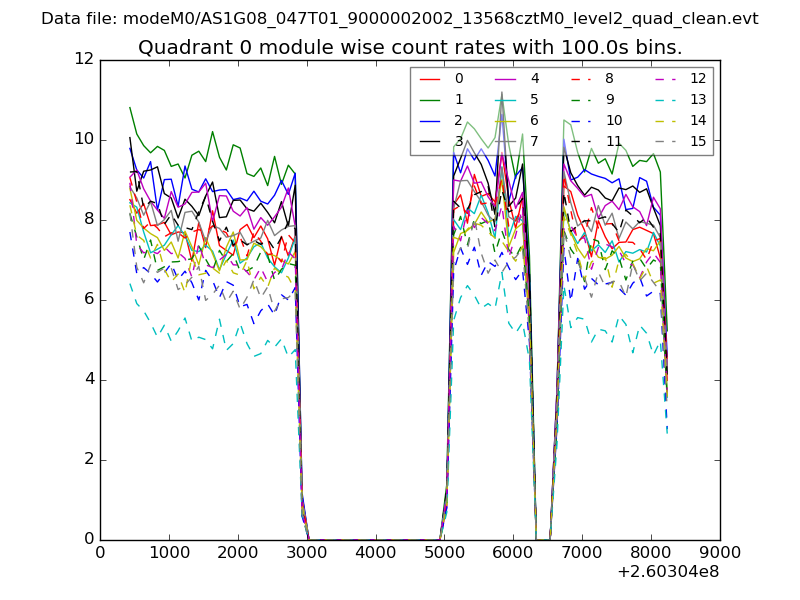 |
 |
| Module-wise count rates for Quadrant B Data is divided into 100 sec bins |
 |
 |
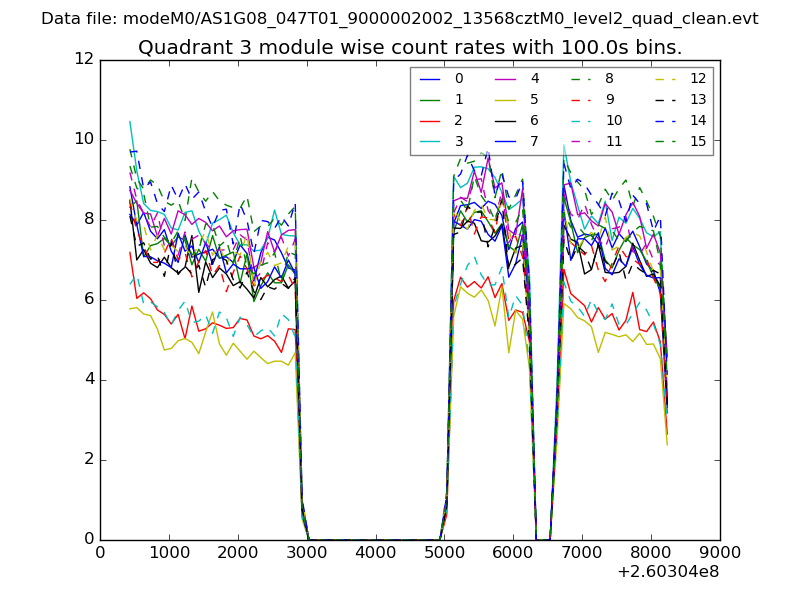
| Module-wise count rates for Quadrant C Data is divided into 100 sec bins |
 |
 |
| Module-wise count rates for Quadrant D Data is divided into 100 sec bins |
 |
 |
| Parameter | Plot |
|---|---|
| CZT HV Monitor | 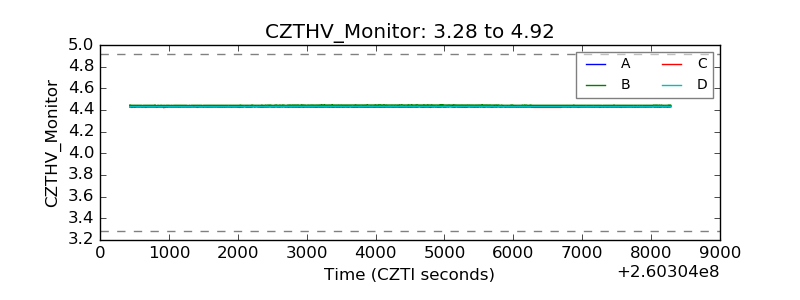 |
| D_VDD | 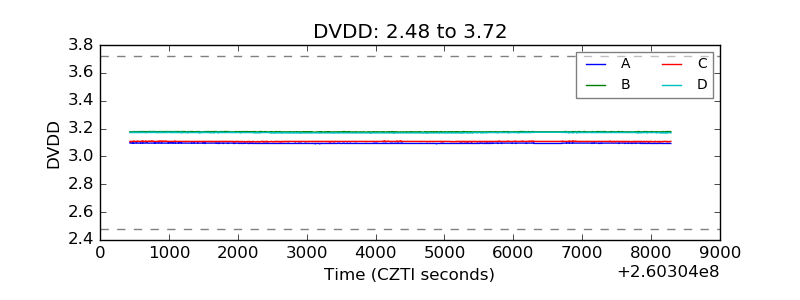 |
| Temperature 1 | 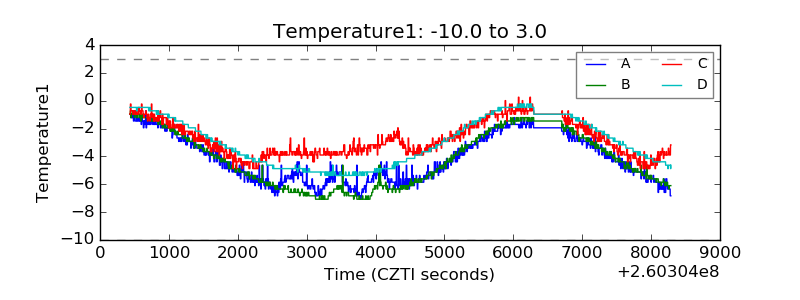 |
| Veto HV Monitor | 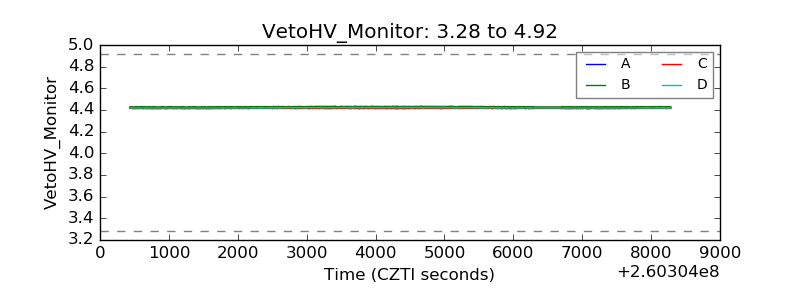 |
| Veto LLD | 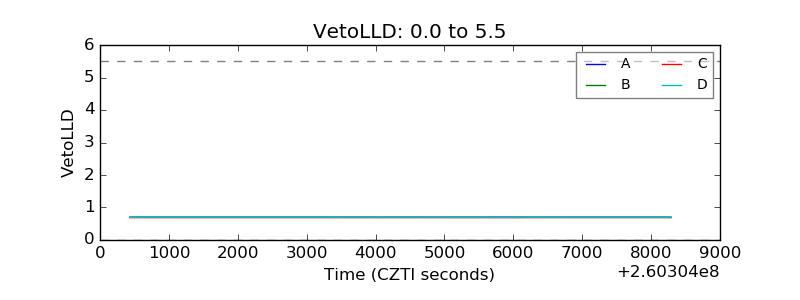 |
| Alpha Counter | 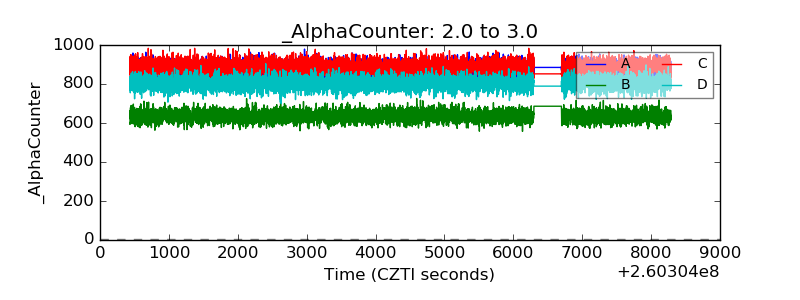 |
| _CPM_Rate | 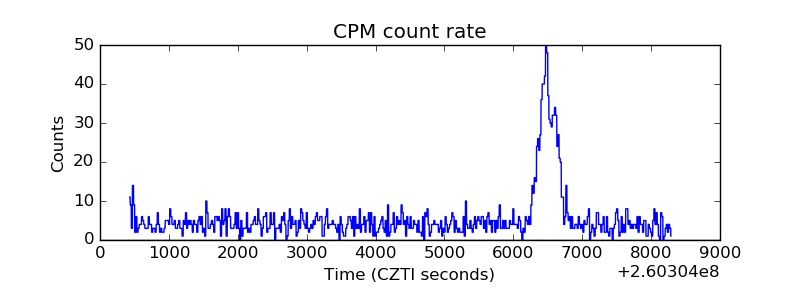 |
| CZT Counter | 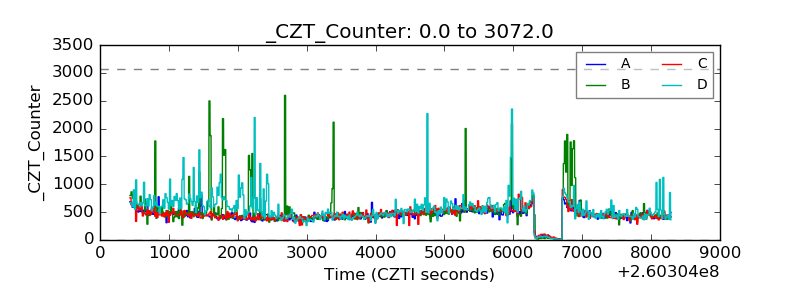 |
| +2.5 Volts monitor |  |
| +5 Volts monitor | 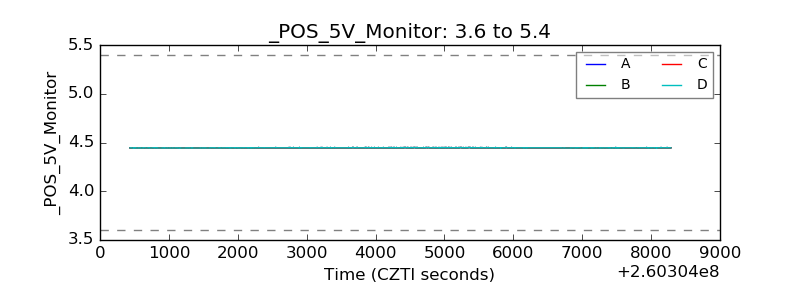 |
| _ROLL_ROT | 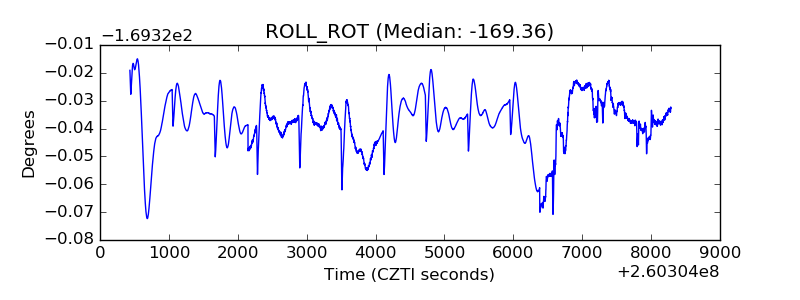 |
| _Roll_DEC | 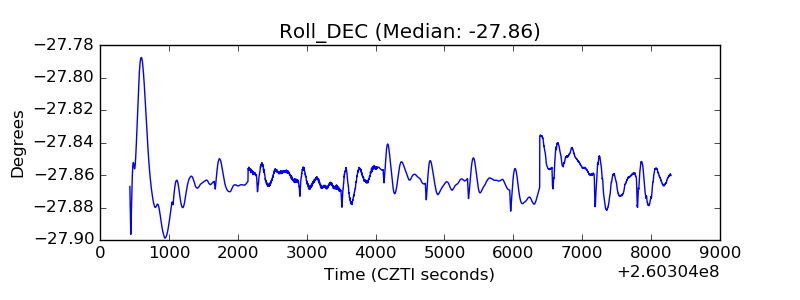 |
| _Roll_RA | 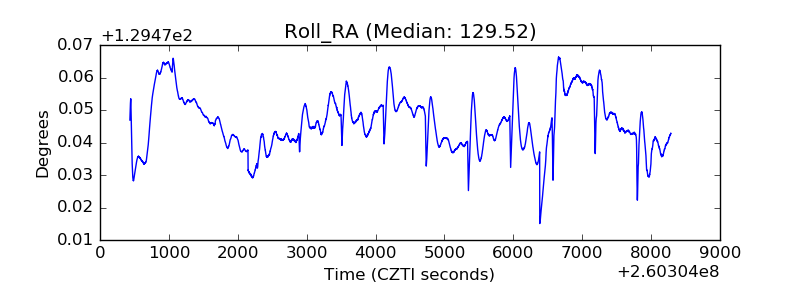 |
| Veto Counter | 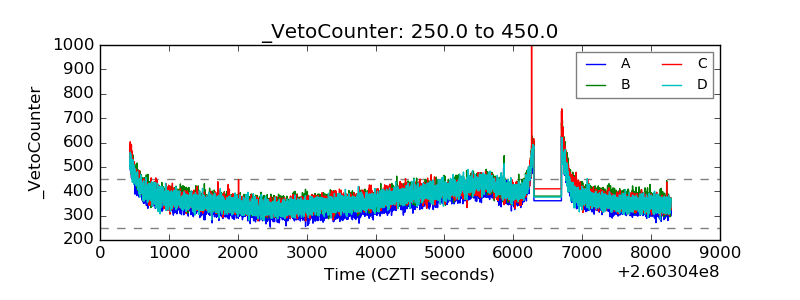 |