| Param | Original file | Final file |
|---|---|---|
| Filename | modeM0/AS1G08_047T01_9000002002_13570cztM0_level2.evt | modeM0/AS1G08_047T01_9000002002_13570cztM0_level2_quad_clean.evt |
| Size (bytes) | 945,115,200 | 166,006,080 |
| Size | 901.3 MB | 158.3 MB |
| Events in quadrant A | 6,054,237 | 1,044,978 |
| Events in quadrant B | 6,652,438 | 1,048,088 |
| Events in quadrant C | 6,405,305 | 1,039,306 |
| Events in quadrant D | 8,613,073 | 978,608 |
| Mode SS | |||
|---|---|---|---|
| Quadrant | BADHDUFLAG | Total packets | Discarded packets |
| A | 0 | 272 | 0 |
| B | 0 | 272 | 0 |
| C | 0 | 272 | 0 |
| D | 0 | 272 | 0 |
| Mode M0 | |||
|---|---|---|---|
| Quadrant | BADHDUFLAG | Total packets | Discarded packets |
| A | 0 | 27079 | 4 |
| B | 0 | 28528 | 3 |
| C | 0 | 27270 | 3 |
| D | 0 | 34593 | 3 |
| Mode M9 | |||
|---|---|---|---|
| Quadrant | BADHDUFLAG | Total packets | Discarded packets |
| A | 0 | 17 | 0 |
| B | 0 | 17 | 0 |
| C | 0 | 17 | 0 |
| D | 0 | 17 | 0 |
| Quadrant | Total seconds | Saturated seconds | Saturation percentage |
|---|---|---|---|
| A | 13266 | 48 | 0.361827% |
| B | 13266 | 241 | 1.816674% |
| C | 13266 | 48 | 0.361827% |
| D | 13266 | 432 | 3.256445% |
Noise dominated data is calculated using 1-second bins in cleaned event files. If a bin has >2000 counts, and if more than 50% of those come from <1% of pixels, then it is considered to be noise-dominated and hence unusable.
| Quadrant | # 1 sec bins | Bins with >0 counts | Bins with >2000 counts | High rate bins dominated by noise | Noise dominated (total time) | Noise dominated (detector-on time) | Marked lightcurve |
|---|---|---|---|---|---|---|---|
| A | 15002 | 13268 | 2 | 2 | 0.01% | 0.02% | 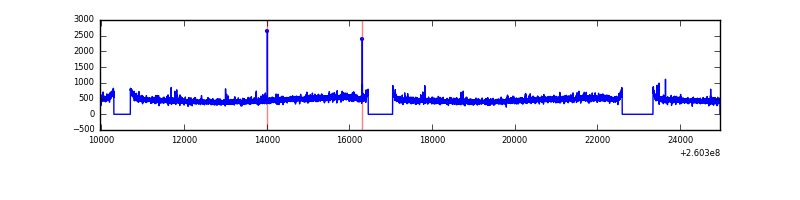 |
| B | 15002 | 13269 | 115 | 115 | 0.77% | 0.87% | 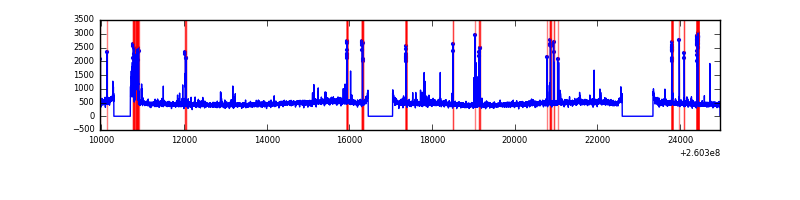 |
| C | 15002 | 13269 | 0 | 0 | 0.00% | 0.00% | 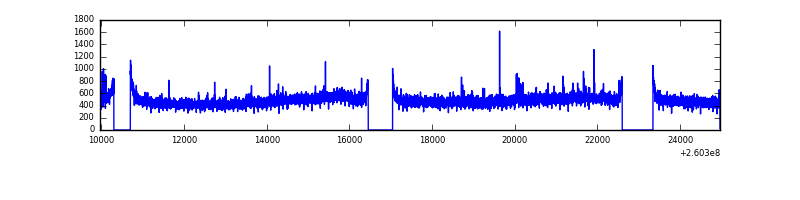 |
| D | 15002 | 13269 | 335 | 335 | 2.23% | 2.52% | 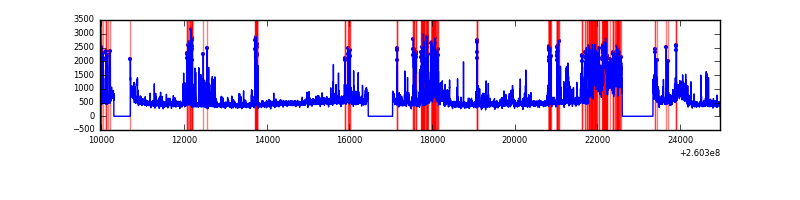 |
Top three noisy pixels from each quadrant. If the there are fewer than three noisy pixels in the level2.evt file, extra rows are filled as -1
| Pixel properties | Quadrant properties | ||||||
|---|---|---|---|---|---|---|---|
| Quadrant | DetID | PixID | Counts | Sigma | Mean | Median | Sigma |
| A | 2 | 250 | 34814 | 105.73 | 1553 | 1519 | 314.9 |
| A | 4 | 2 | 17170 | 49.7 | 1553 | 1519 | 314.9 |
| A | 1 | 162 | 14682 | 41.8 | 1553 | 1519 | 314.9 |
| B | 3 | 64 | 247353 | 830.87 | 1549 | 1511 | 295.9 |
| B | 0 | 182 | 170248 | 570.28 | 1549 | 1511 | 295.9 |
| B | 4 | 142 | 64808 | 213.92 | 1549 | 1511 | 295.9 |
| C | 3 | 233 | 529294 | 1517.08 | 1502 | 1507 | 347.9 |
| C | 0 | 207 | 19180 | 50.8 | 1502 | 1507 | 347.9 |
| C | 13 | 61 | 10828 | 26.79 | 1502 | 1507 | 347.9 |
| D | 13 | 122 | 1346612 | 3761.18 | 1482 | 1444 | 357.6 |
| D | 5 | 222 | 495703 | 1381.98 | 1482 | 1444 | 357.6 |
| D | 2 | 14 | 367738 | 1024.18 | 1482 | 1444 | 357.6 |
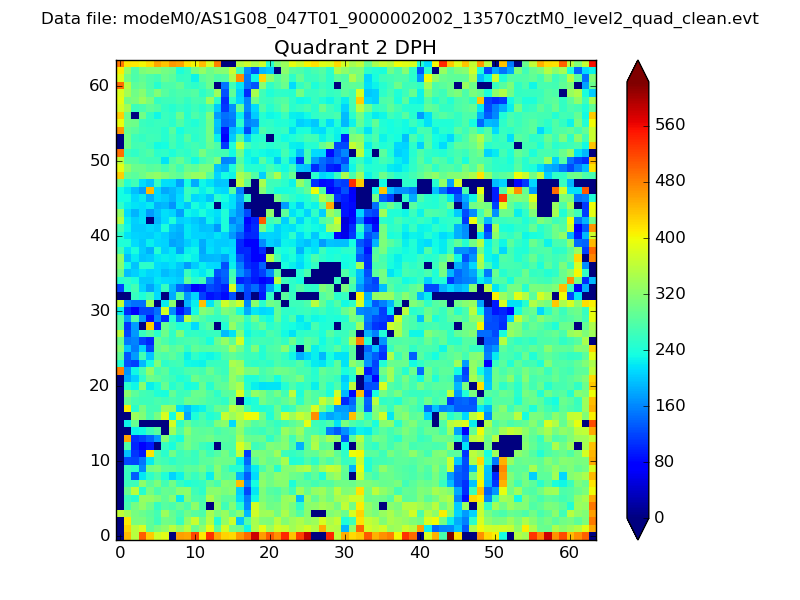
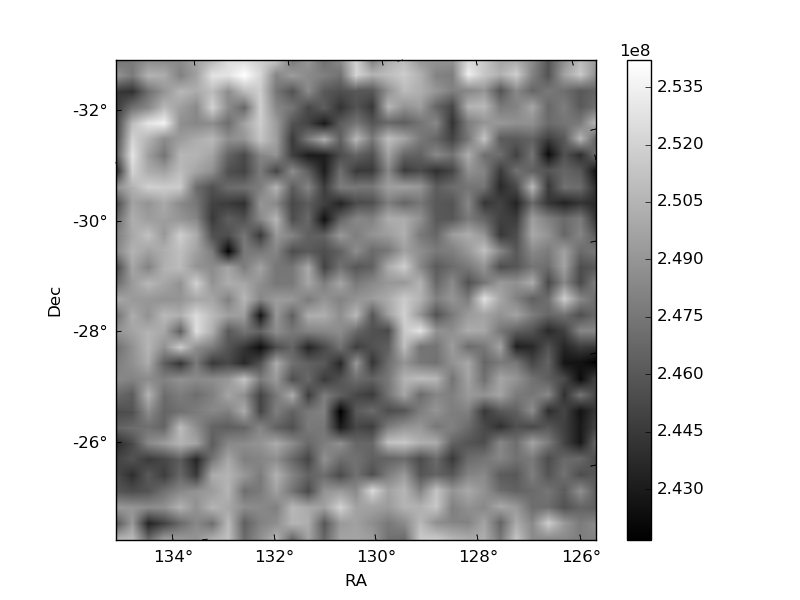
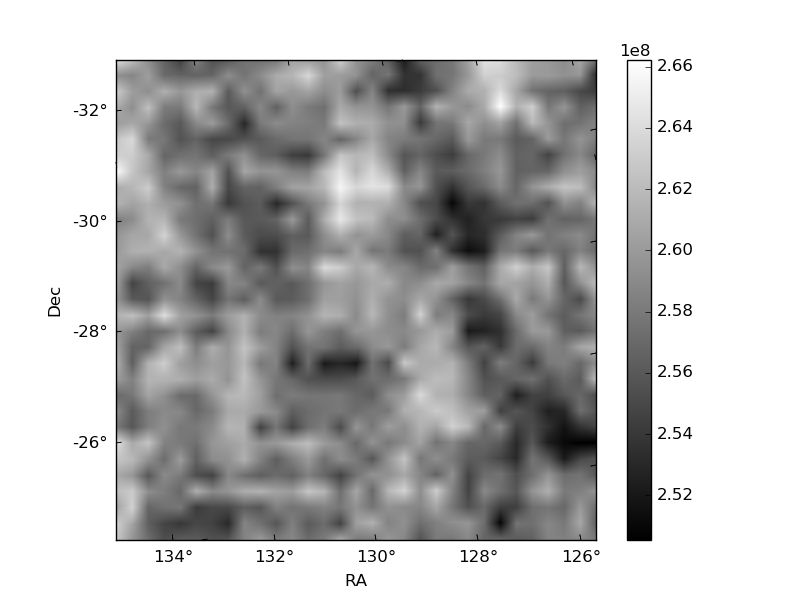
Histogram calculated using DETX and DETY for each event in the final _common_clean file
| Quadrant A |  |
 |
Quadrant B |
|---|---|---|---|
| Quadrant D | 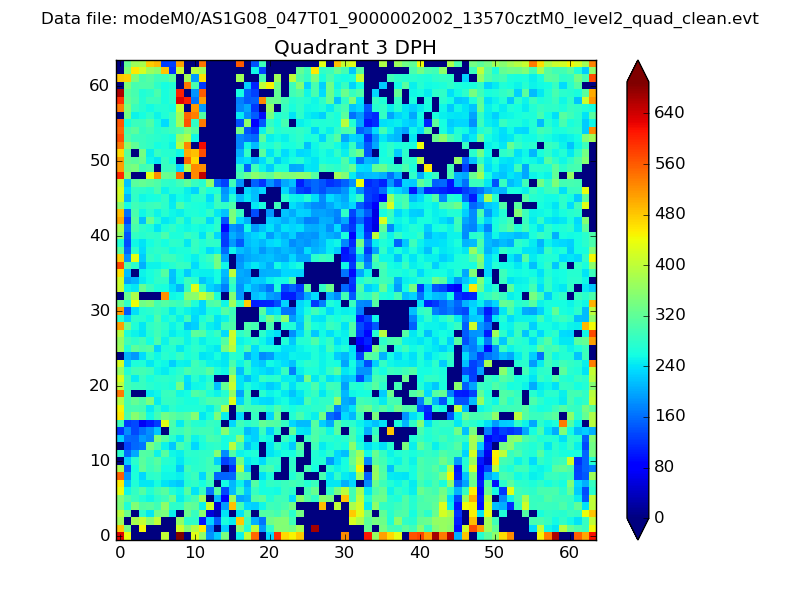 |
 |
Quadrant C |
| Plot type | Count rate plots | Images |
|---|---|---|
| Comparison with Poisson distribution Blue bars denote a histogram of data divided into 1 sec bins. Red curve is a Poisson curve with rate = median count rate of data. |
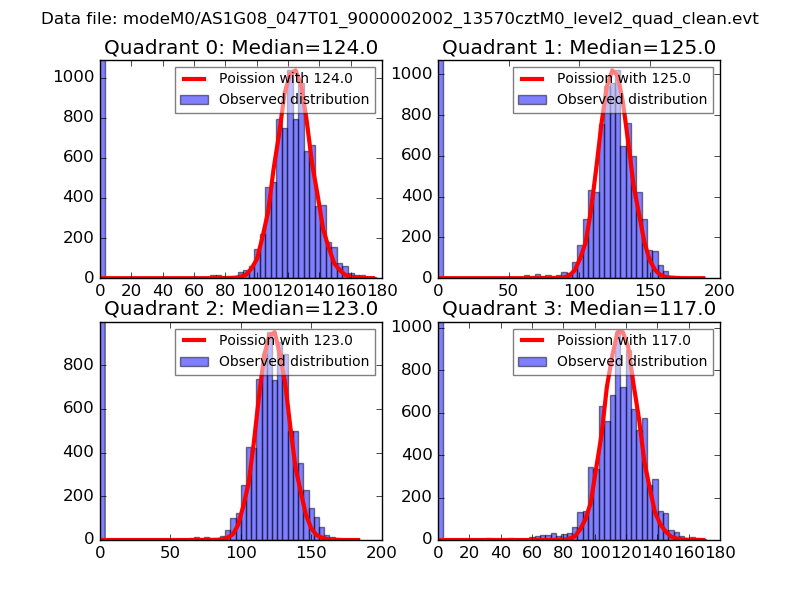 |
 |
| Quadrant-wise count rates Data is divided into 100 sec bins |
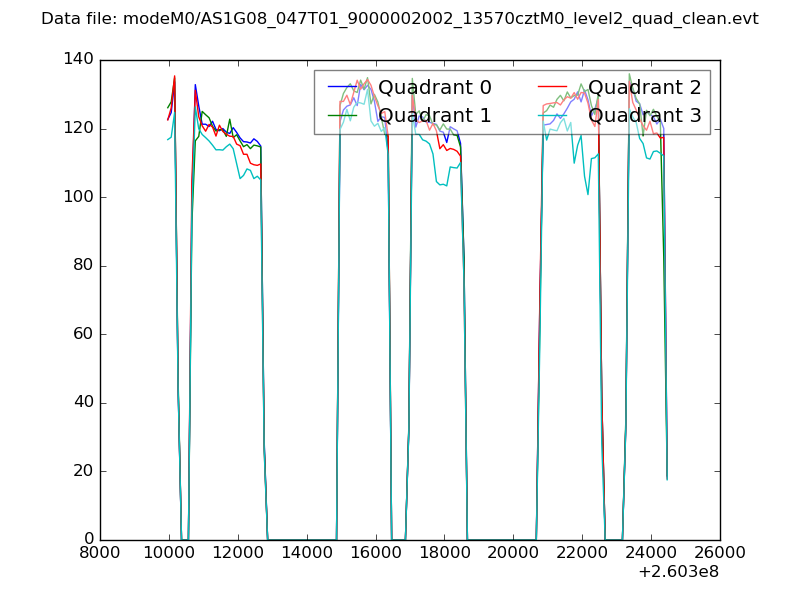 |
|
| Module-wise count rates for Quadrant A Data is divided into 100 sec bins |
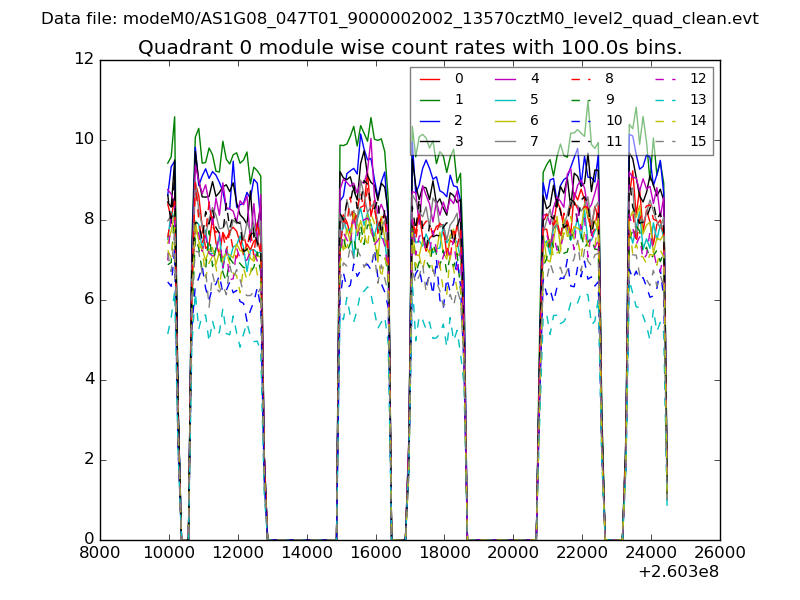 |
 |
| Module-wise count rates for Quadrant B Data is divided into 100 sec bins |
 |
 |
| Module-wise count rates for Quadrant C Data is divided into 100 sec bins |
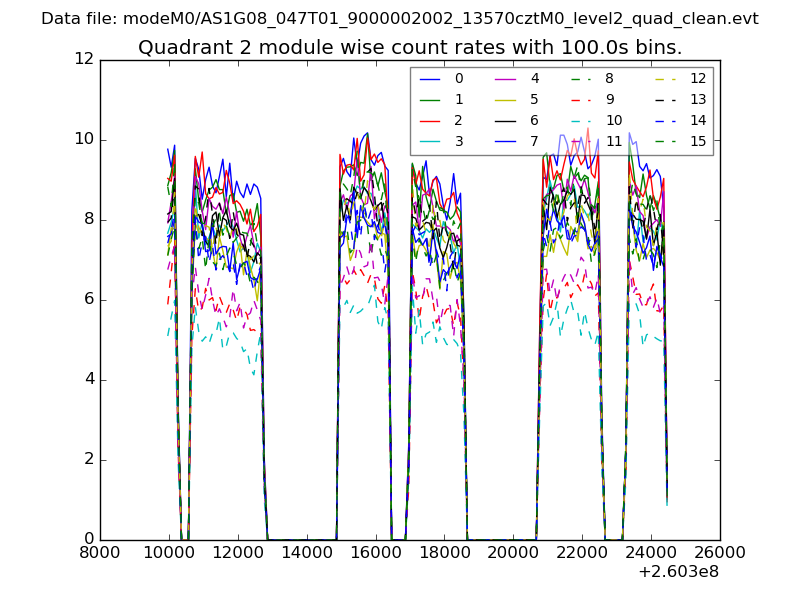 |
 |
| Module-wise count rates for Quadrant D Data is divided into 100 sec bins |
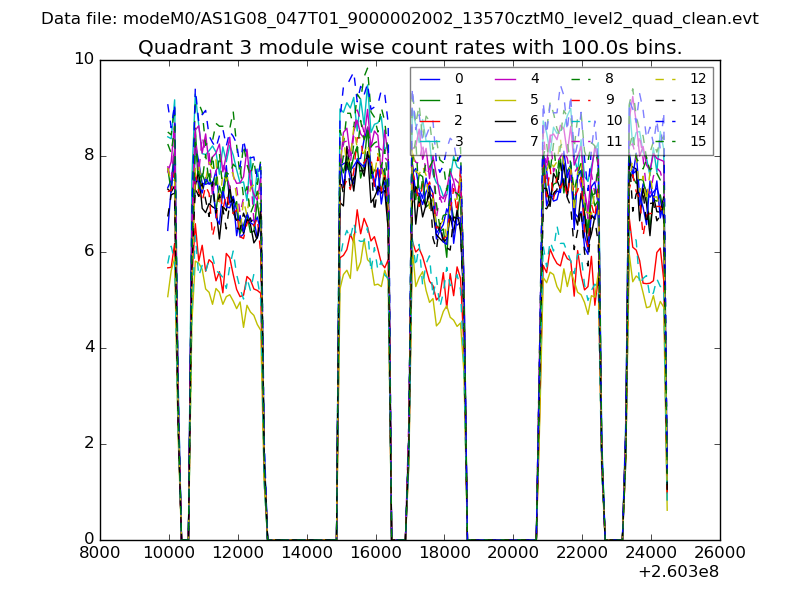 |
 |
| Parameter | Plot |
|---|---|
| CZT HV Monitor |  |
| D_VDD | 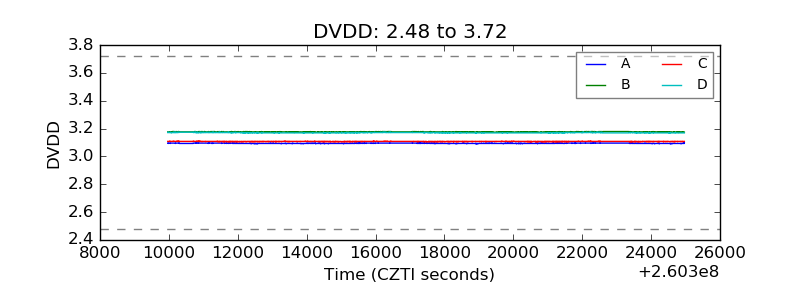 |
| Temperature 1 |  |
| Veto HV Monitor | 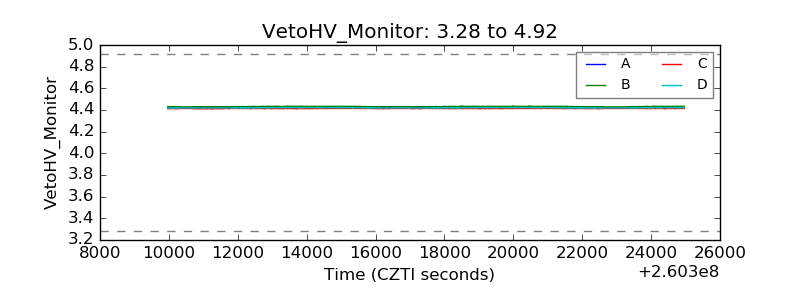 |
| Veto LLD | 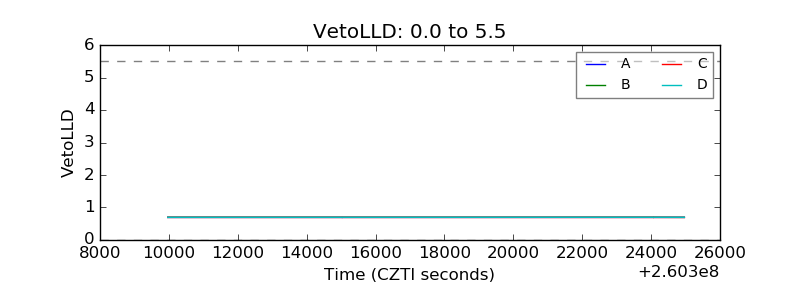 |
| Alpha Counter | 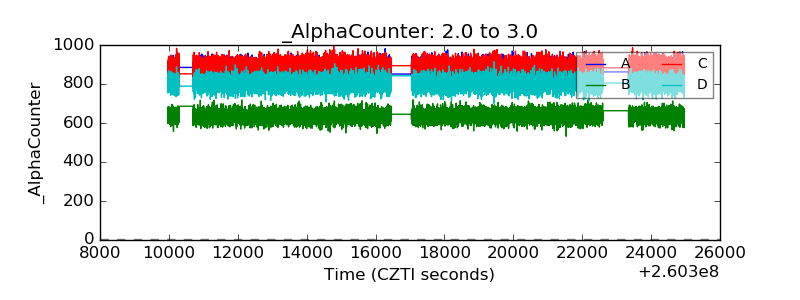 |
| _CPM_Rate | 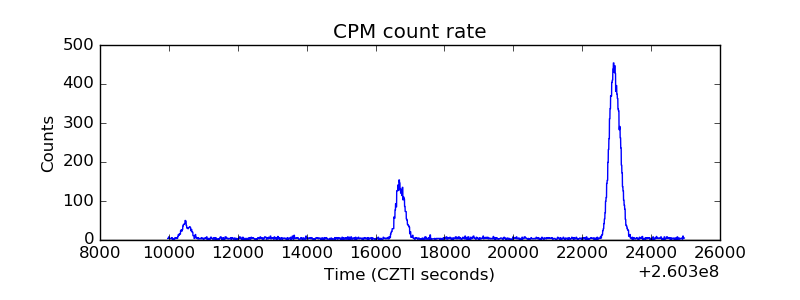 |
| CZT Counter | 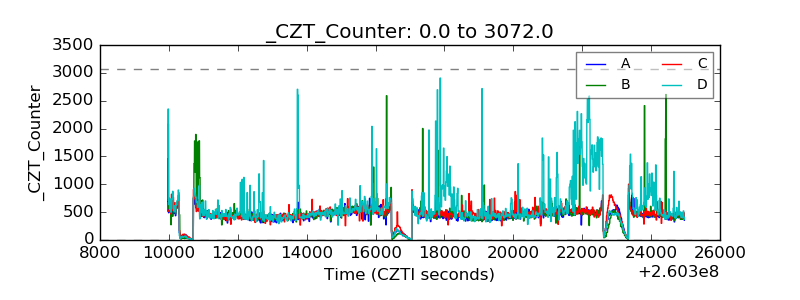 |
| +2.5 Volts monitor |  |
| +5 Volts monitor |  |
| _ROLL_ROT | 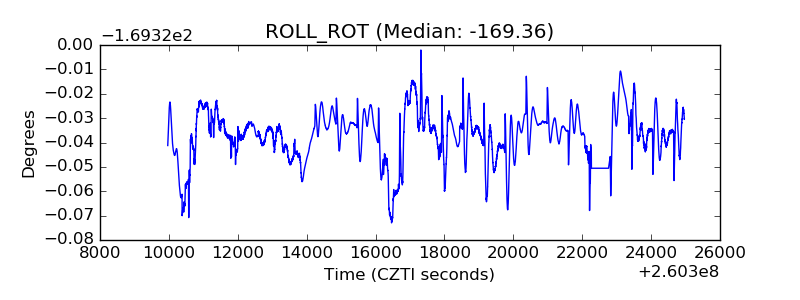 |
| _Roll_DEC | 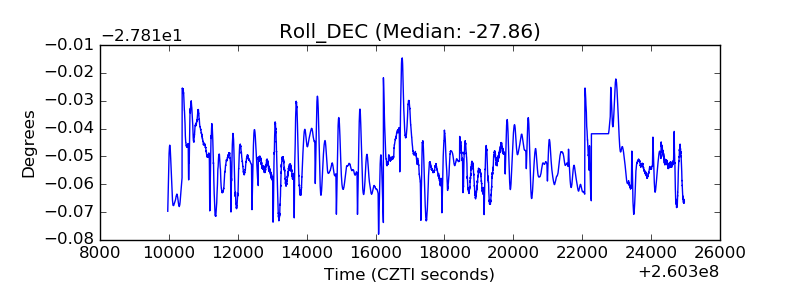 |
| _Roll_RA | 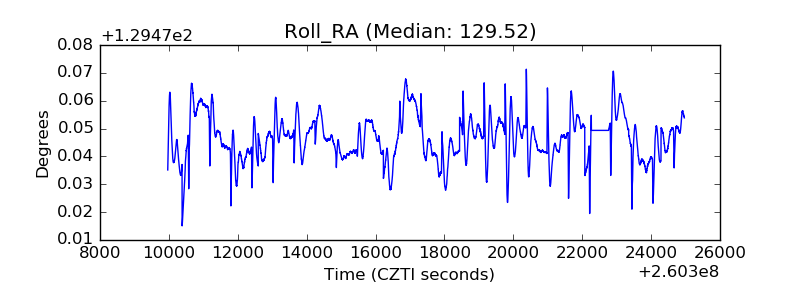 |
| Veto Counter | 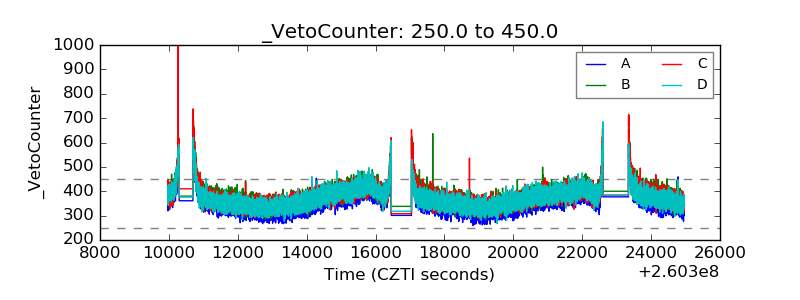 |