| Param | Original file | Final file |
|---|---|---|
| Filename | modeM0/AS1G08_047T01_9000002002_13572cztM0_level2.evt | modeM0/AS1G08_047T01_9000002002_13572cztM0_level2_quad_clean.evt |
| Size (bytes) | 456,183,360 | 67,098,240 |
| Size | 435.1 MB | 64.0 MB |
| Events in quadrant A | 3,025,174 | 398,024 |
| Events in quadrant B | 3,269,478 | 404,892 |
| Events in quadrant C | 3,309,224 | 400,658 |
| Events in quadrant D | 3,773,088 | 377,789 |
| Mode SS | |||
|---|---|---|---|
| Quadrant | BADHDUFLAG | Total packets | Discarded packets |
| A | 0 | 130 | 0 |
| B | 0 | 130 | 0 |
| C | 0 | 130 | 0 |
| D | 0 | 130 | 0 |
| Mode M0 | |||
|---|---|---|---|
| Quadrant | BADHDUFLAG | Total packets | Discarded packets |
| A | 0 | 13162 | 2 |
| B | 0 | 13674 | 1 |
| C | 0 | 13551 | 1 |
| D | 0 | 15367 | 1 |
| Mode M9 | |||
|---|---|---|---|
| Quadrant | BADHDUFLAG | Total packets | Discarded packets |
| A | 0 | 11 | 0 |
| B | 0 | 11 | 0 |
| C | 0 | 11 | 0 |
| D | 0 | 11 | 0 |
| Quadrant | Total seconds | Saturated seconds | Saturation percentage |
|---|---|---|---|
| A | 6458 | 16 | 0.247755% |
| B | 6458 | 60 | 0.929080% |
| C | 6458 | 29 | 0.449055% |
| D | 6458 | 122 | 1.889130% |
Noise dominated data is calculated using 1-second bins in cleaned event files. If a bin has >2000 counts, and if more than 50% of those come from <1% of pixels, then it is considered to be noise-dominated and hence unusable.
| Quadrant | # 1 sec bins | Bins with >0 counts | Bins with >2000 counts | High rate bins dominated by noise | Noise dominated (total time) | Noise dominated (detector-on time) | Marked lightcurve |
|---|---|---|---|---|---|---|---|
| A | 7519 | 6459 | 0 | 0 | 0.00% | 0.00% | 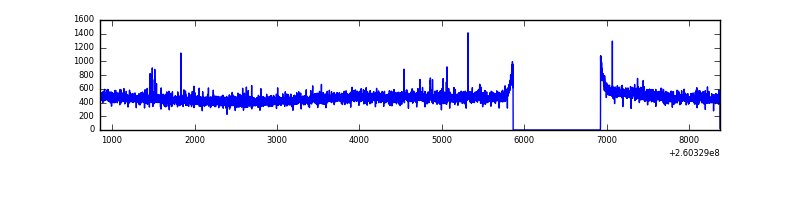 |
| B | 7519 | 6459 | 15 | 15 | 0.20% | 0.23% | 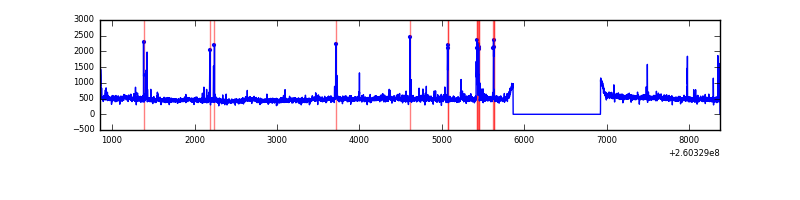 |
| C | 7519 | 6459 | 1 | 1 | 0.01% | 0.02% | 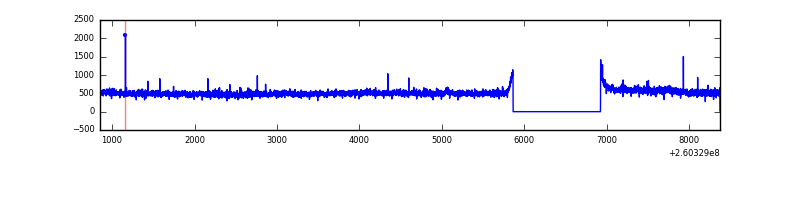 |
| D | 7519 | 6459 | 103 | 103 | 1.37% | 1.59% | 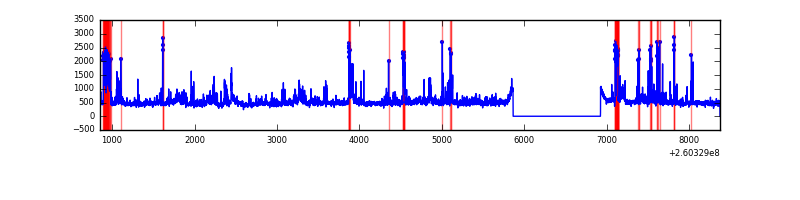 |
Top three noisy pixels from each quadrant. If the there are fewer than three noisy pixels in the level2.evt file, extra rows are filled as -1
| Pixel properties | Quadrant properties | ||||||
|---|---|---|---|---|---|---|---|
| Quadrant | DetID | PixID | Counts | Sigma | Mean | Median | Sigma |
| A | 1 | 162 | 17638 | 107.74 | 775 | 759 | 156.7 |
| A | 0 | 226 | 7328 | 41.93 | 775 | 759 | 156.7 |
| A | 0 | 23 | 6106 | 34.13 | 775 | 759 | 156.7 |
| B | 0 | 182 | 50666 | 339.6 | 781 | 763 | 146.9 |
| B | 4 | 173 | 48080 | 322.0 | 781 | 763 | 146.9 |
| B | 3 | 64 | 44677 | 298.84 | 781 | 763 | 146.9 |
| C | 3 | 233 | 339985 | 1941.54 | 758 | 762 | 174.7 |
| C | 0 | 207 | 8853 | 46.31 | 758 | 762 | 174.7 |
| C | 13 | 61 | 5471 | 26.95 | 758 | 762 | 174.7 |
| D | 5 | 222 | 444408 | 2490.22 | 746 | 727 | 178.2 |
| D | 1 | 20 | 157144 | 877.91 | 746 | 727 | 178.2 |
| D | 8 | 195 | 152176 | 850.03 | 746 | 727 | 178.2 |
Histogram calculated using DETX and DETY for each event in the final _common_clean file
| Quadrant A |  |
 |
Quadrant B |
|---|---|---|---|
| Quadrant D |  |
 |
Quadrant C |
| Plot type | Count rate plots | Images |
|---|---|---|
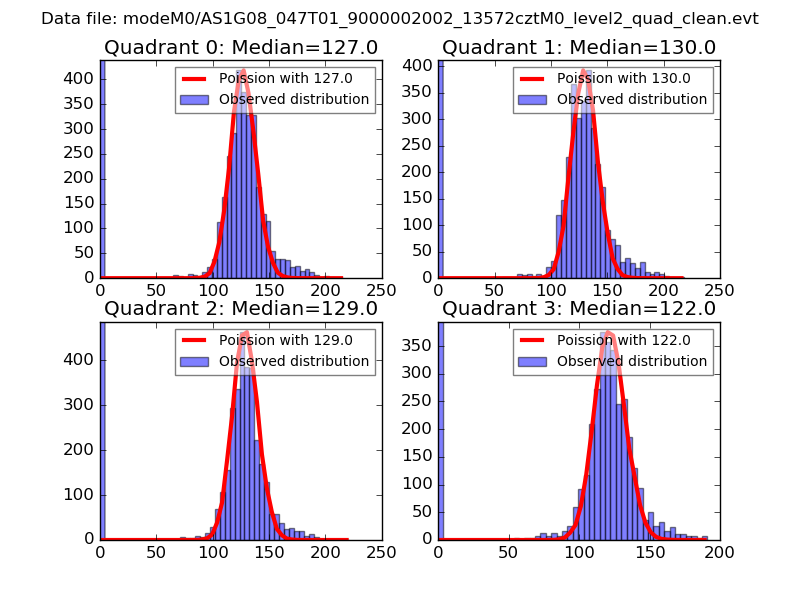
| Comparison with Poisson distribution Blue bars denote a histogram of data divided into 1 sec bins. Red curve is a Poisson curve with rate = median count rate of data. |
 |
 |
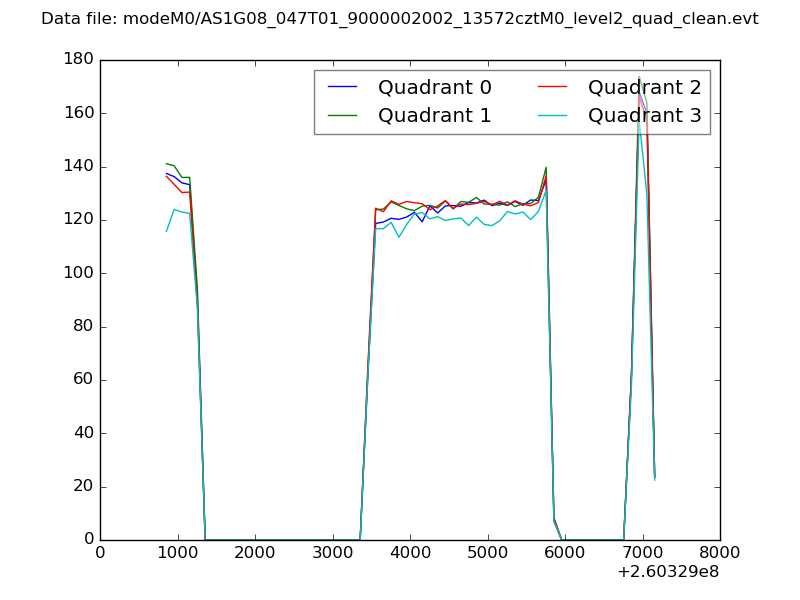
| Quadrant-wise count rates Data is divided into 100 sec bins |
 |
|
| Module-wise count rates for Quadrant A Data is divided into 100 sec bins |
 |
 |
| Module-wise count rates for Quadrant B Data is divided into 100 sec bins |
 |
 |
| Module-wise count rates for Quadrant C Data is divided into 100 sec bins |
 |
 |
| Module-wise count rates for Quadrant D Data is divided into 100 sec bins |
 |
 |
| Parameter | Plot |
|---|---|
| CZT HV Monitor |  |
| D_VDD | 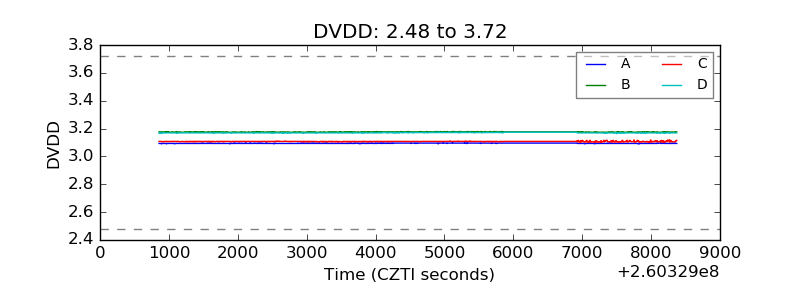 |
| Temperature 1 |  |
| Veto HV Monitor |  |
| Veto LLD |  |
| Alpha Counter | 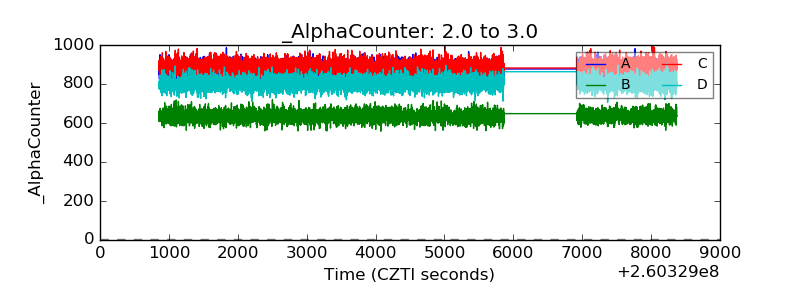 |
| _CPM_Rate | 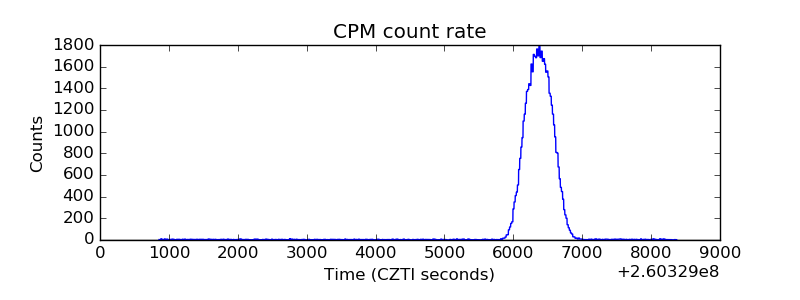 |
| CZT Counter |  |
| +2.5 Volts monitor |  |
| +5 Volts monitor |  |
| _ROLL_ROT |  |
| _Roll_DEC |  |
| _Roll_RA |  |
| Veto Counter |  |