| Param | Original file | Final file |
|---|---|---|
| Filename | modeM0/AS1G08_047T01_9000002002_13574cztM0_level2.evt | modeM0/AS1G08_047T01_9000002002_13574cztM0_level2_quad_clean.evt |
| Size (bytes) | 460,632,960 | 63,852,480 |
| Size | 439.3 MB | 60.9 MB |
| Events in quadrant A | 3,153,030 | 372,867 |
| Events in quadrant B | 3,392,640 | 379,932 |
| Events in quadrant C | 3,391,859 | 376,561 |
| Events in quadrant D | 3,580,773 | 359,995 |
| Mode SS | |||
|---|---|---|---|
| Quadrant | BADHDUFLAG | Total packets | Discarded packets |
| A | 0 | 130 | 0 |
| B | 0 | 130 | 0 |
| C | 0 | 130 | 0 |
| D | 0 | 130 | 0 |
| Mode M0 | |||
|---|---|---|---|
| Quadrant | BADHDUFLAG | Total packets | Discarded packets |
| A | 0 | 13271 | 3 |
| B | 0 | 14038 | 2 |
| C | 0 | 13823 | 2 |
| D | 0 | 14621 | 2 |
| Mode M9 | |||
|---|---|---|---|
| Quadrant | BADHDUFLAG | Total packets | Discarded packets |
| A | 0 | 11 | 0 |
| B | 0 | 11 | 0 |
| C | 0 | 11 | 0 |
| D | 0 | 11 | 0 |
| Quadrant | Total seconds | Saturated seconds | Saturation percentage |
|---|---|---|---|
| A | 6358 | 43 | 0.676313% |
| B | 6358 | 83 | 1.305442% |
| C | 6358 | 49 | 0.770683% |
| D | 6358 | 94 | 1.478452% |
Noise dominated data is calculated using 1-second bins in cleaned event files. If a bin has >2000 counts, and if more than 50% of those come from <1% of pixels, then it is considered to be noise-dominated and hence unusable.
| Quadrant | # 1 sec bins | Bins with >0 counts | Bins with >2000 counts | High rate bins dominated by noise | Noise dominated (total time) | Noise dominated (detector-on time) | Marked lightcurve |
|---|---|---|---|---|---|---|---|
| A | 7519 | 6359 | 0 | 0 | 0.00% | 0.00% | 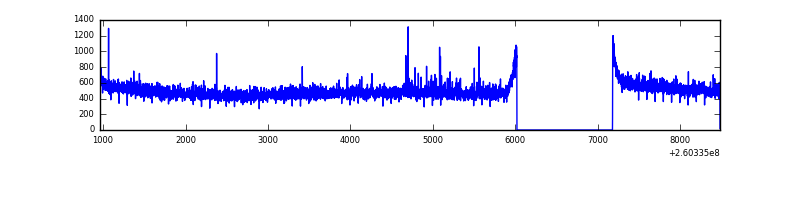 |
| B | 7519 | 6359 | 19 | 19 | 0.25% | 0.30% | 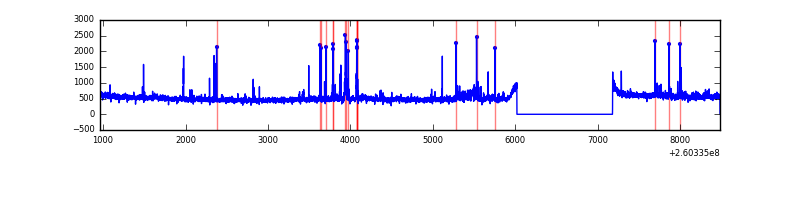 |
| C | 7519 | 6359 | 1 | 1 | 0.01% | 0.02% | 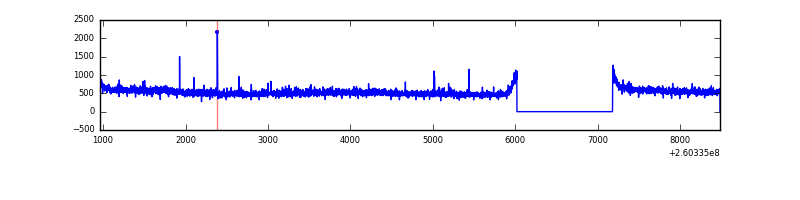 |
| D | 7519 | 6359 | 58 | 58 | 0.77% | 0.91% | 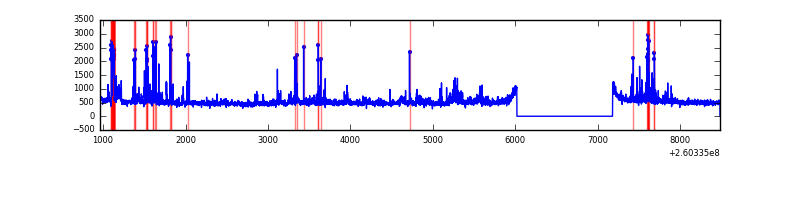 |
Top three noisy pixels from each quadrant. If the there are fewer than three noisy pixels in the level2.evt file, extra rows are filled as -1
| Pixel properties | Quadrant properties | ||||||
|---|---|---|---|---|---|---|---|
| Quadrant | DetID | PixID | Counts | Sigma | Mean | Median | Sigma |
| A | 1 | 162 | 23526 | 141.58 | 805 | 791 | 160.6 |
| A | 2 | 250 | 7781 | 43.53 | 805 | 791 | 160.6 |
| A | 0 | 226 | 7489 | 41.71 | 805 | 791 | 160.6 |
| B | 0 | 182 | 57963 | 377.87 | 810 | 793 | 151.3 |
| B | 0 | 85 | 57796 | 376.77 | 810 | 793 | 151.3 |
| B | 0 | 214 | 47490 | 308.65 | 810 | 793 | 151.3 |
| C | 3 | 233 | 293276 | 1624.32 | 785 | 791 | 180.1 |
| C | 8 | 128 | 11849 | 61.41 | 785 | 791 | 180.1 |
| C | 0 | 207 | 9567 | 48.74 | 785 | 791 | 180.1 |
| D | 5 | 222 | 232442 | 1250.96 | 778 | 756 | 185.2 |
| D | 1 | 20 | 117455 | 630.1 | 778 | 756 | 185.2 |
| D | 8 | 195 | 90573 | 484.96 | 778 | 756 | 185.2 |
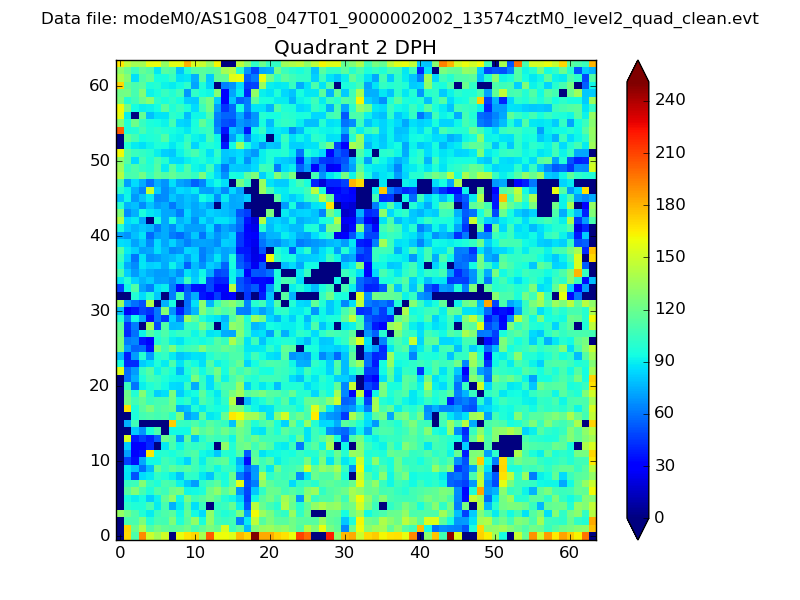
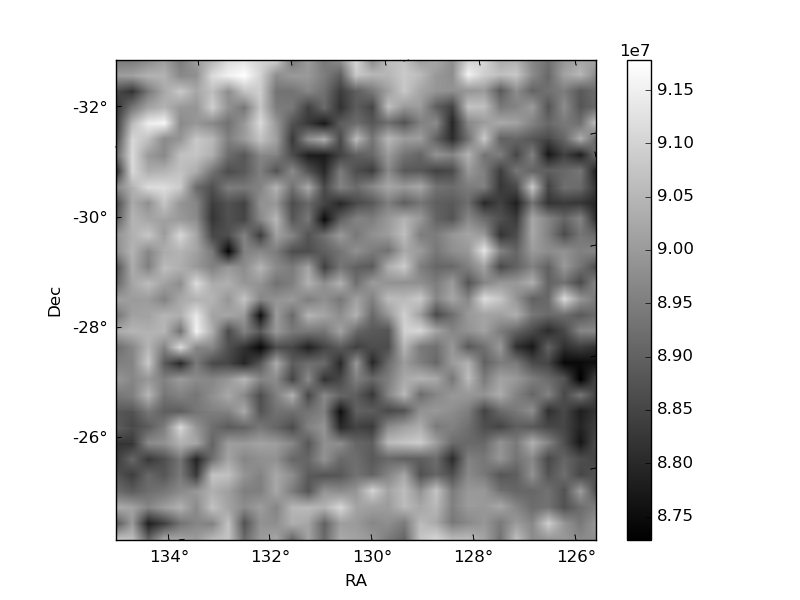
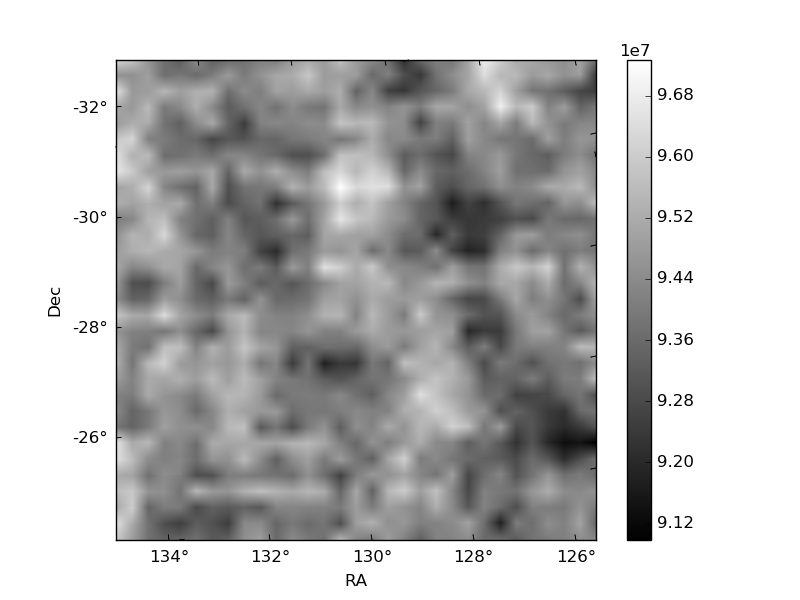
Histogram calculated using DETX and DETY for each event in the final _common_clean file
| Quadrant A |  |
 |
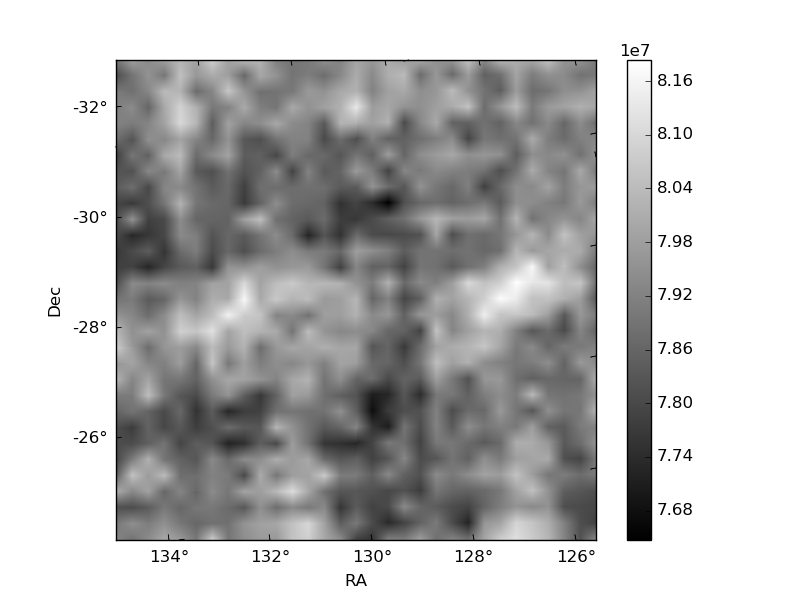
Quadrant B |
|---|---|---|---|
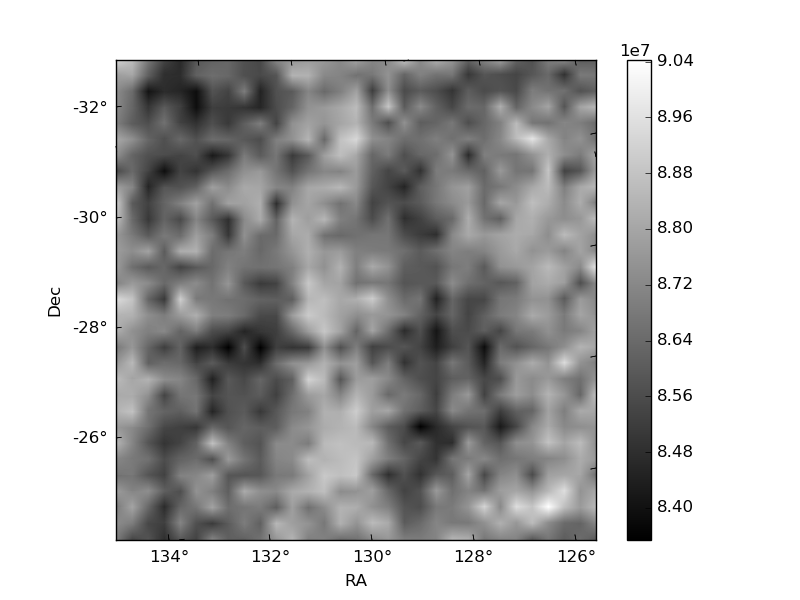
| Quadrant D | 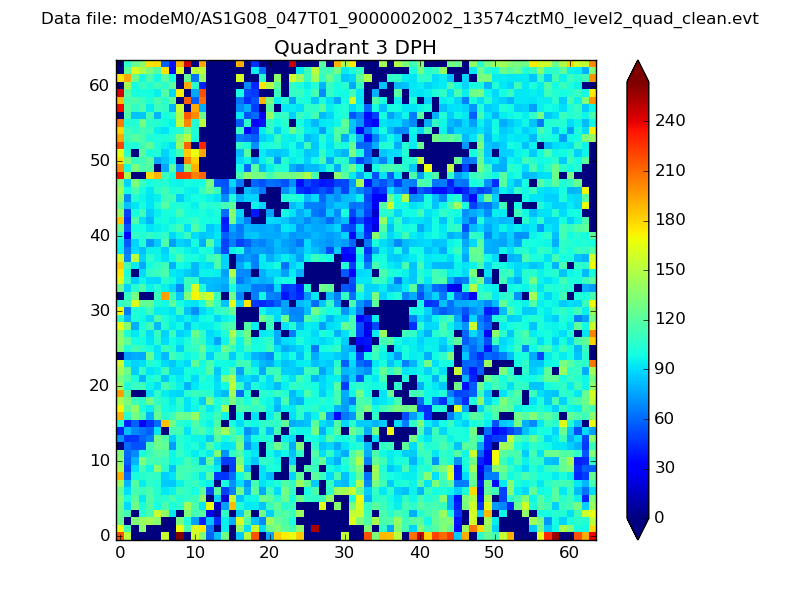 |
 |
Quadrant C |
| Plot type | Count rate plots | Images |
|---|---|---|
| Comparison with Poisson distribution Blue bars denote a histogram of data divided into 1 sec bins. Red curve is a Poisson curve with rate = median count rate of data. |
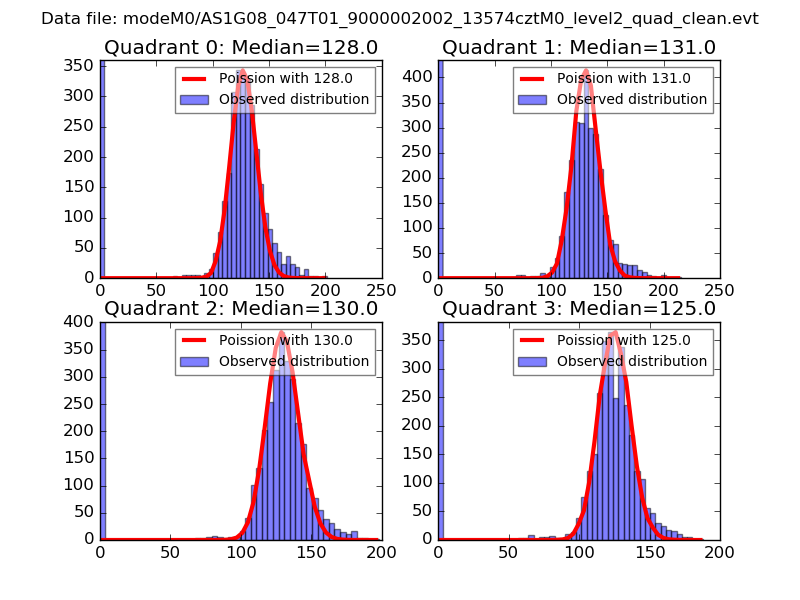 |
 |
| Quadrant-wise count rates Data is divided into 100 sec bins |
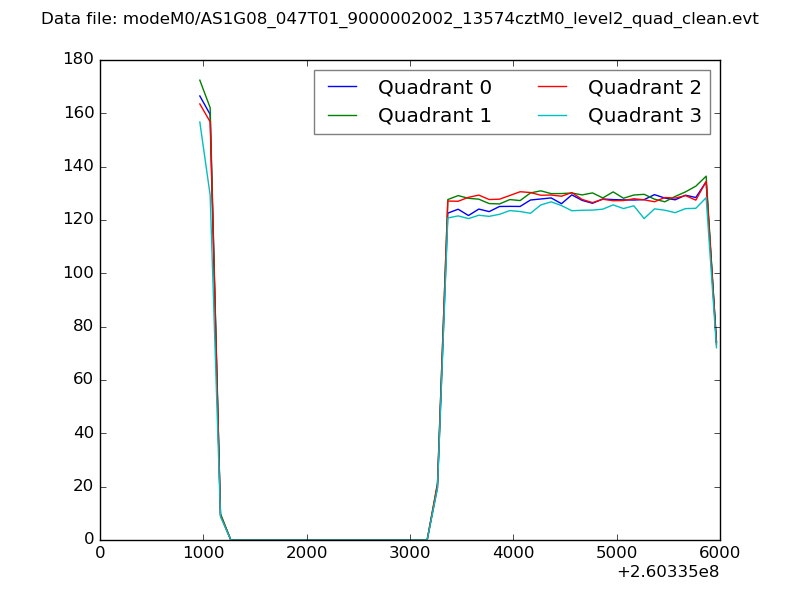 |
|
| Module-wise count rates for Quadrant A Data is divided into 100 sec bins |
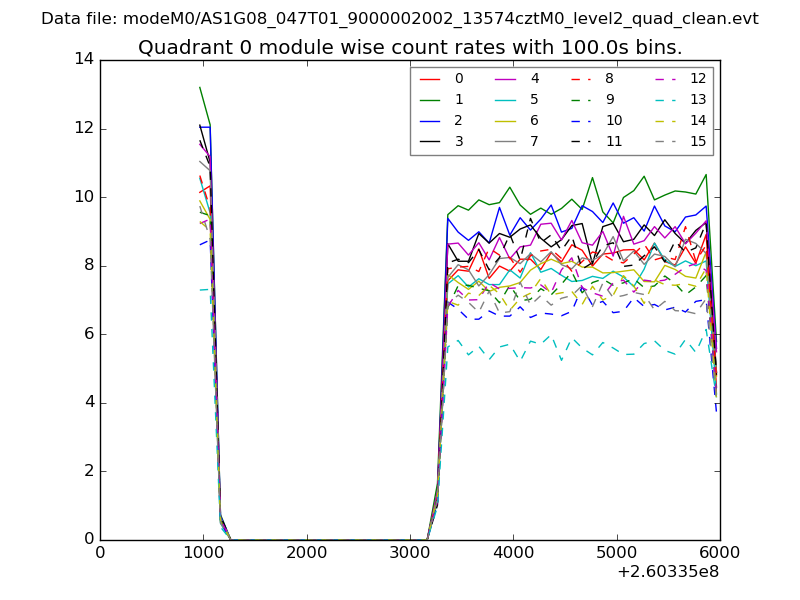 |
 |
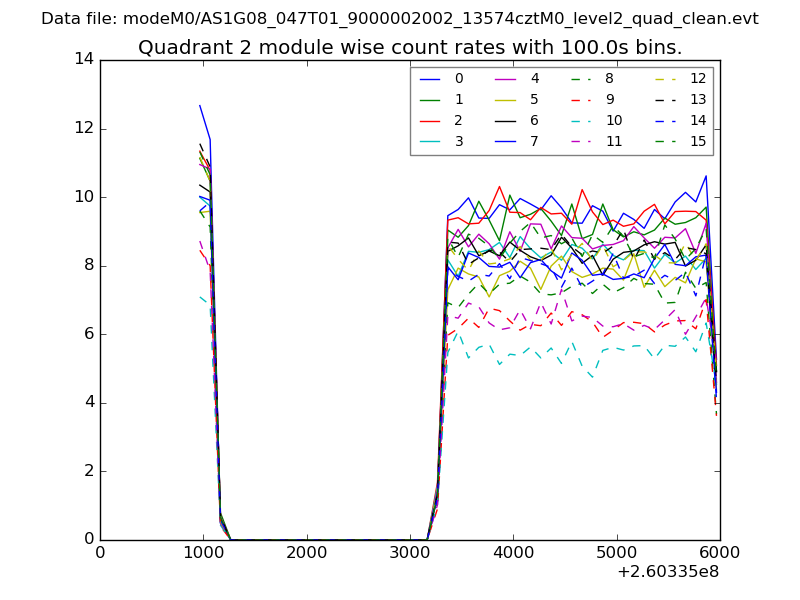
| Module-wise count rates for Quadrant B Data is divided into 100 sec bins |
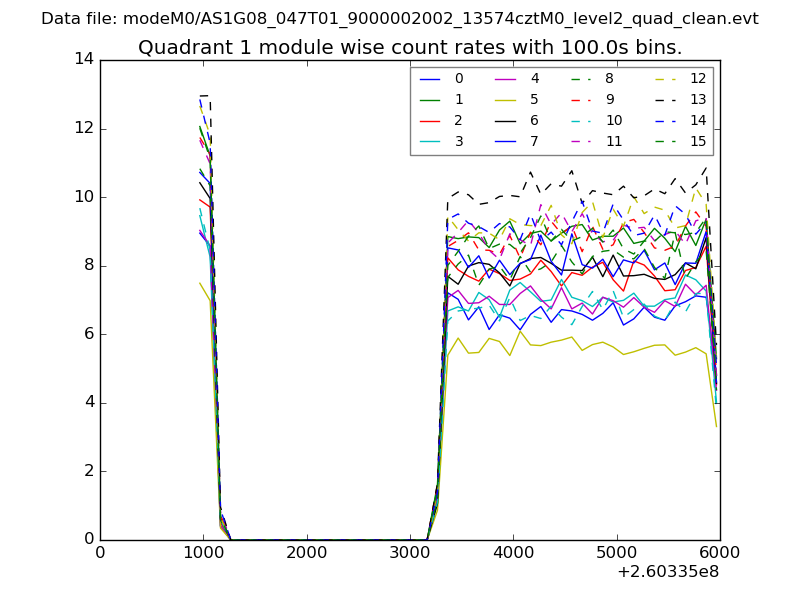 |
 |
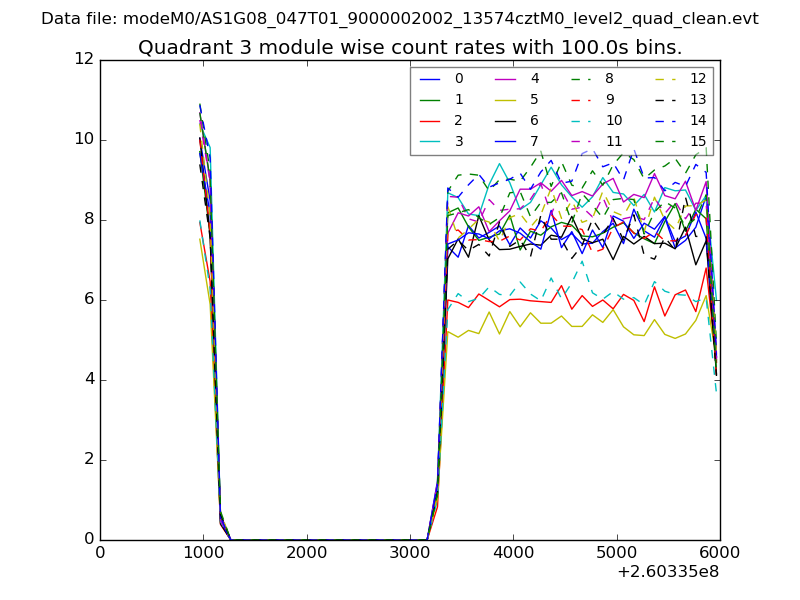
| Module-wise count rates for Quadrant C Data is divided into 100 sec bins |
 |
 |
| Module-wise count rates for Quadrant D Data is divided into 100 sec bins |
 |
 |
| Parameter | Plot |
|---|---|
| CZT HV Monitor | 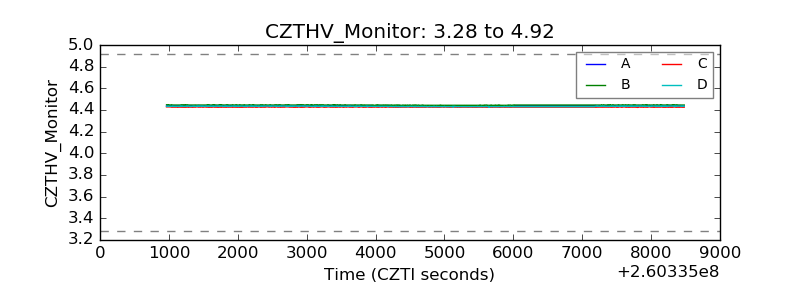 |
| D_VDD | 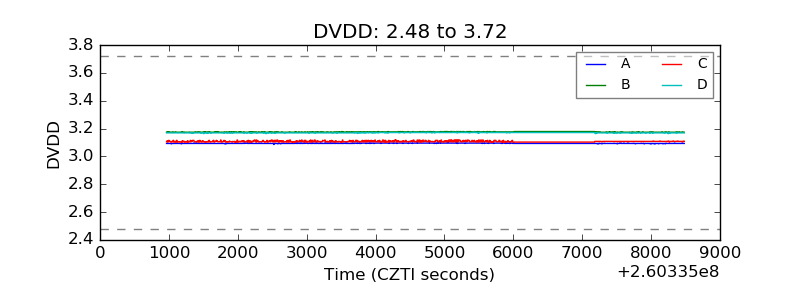 |
| Temperature 1 | 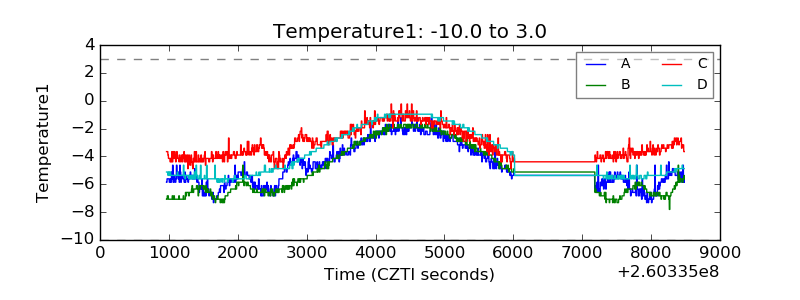 |
| Veto HV Monitor | 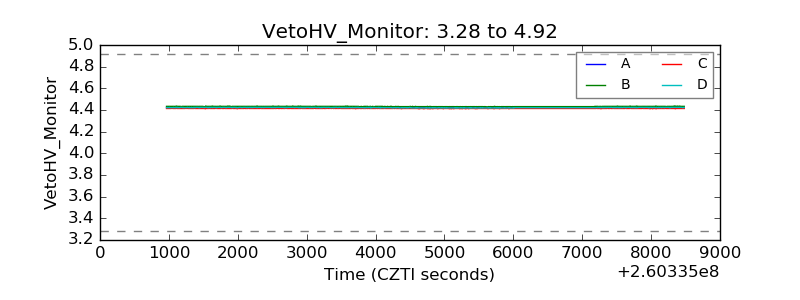 |
| Veto LLD |  |
| Alpha Counter | 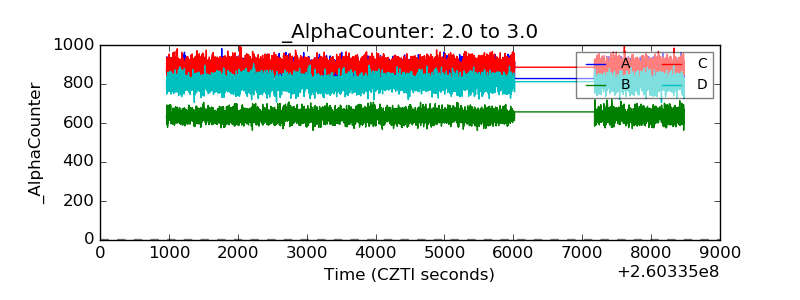 |
| _CPM_Rate | 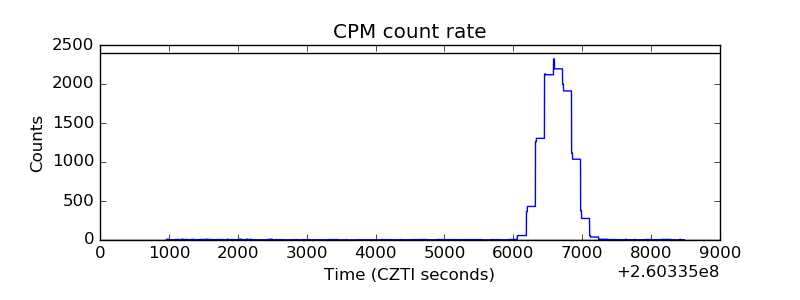 |
| CZT Counter | 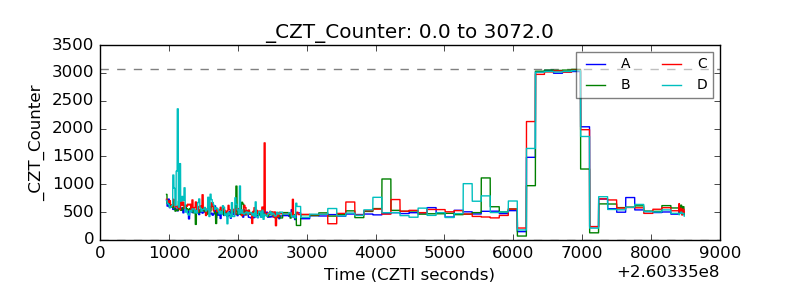 |
| +2.5 Volts monitor |  |
| +5 Volts monitor | 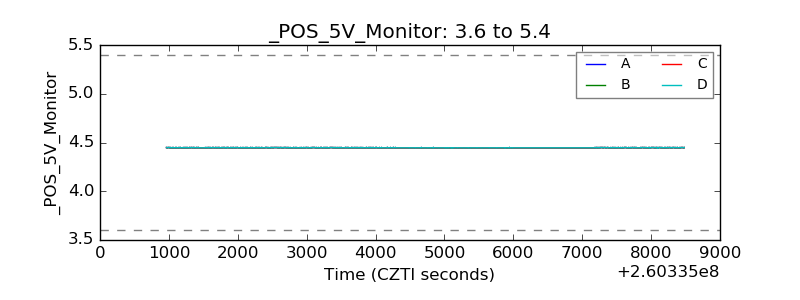 |
| _ROLL_ROT | 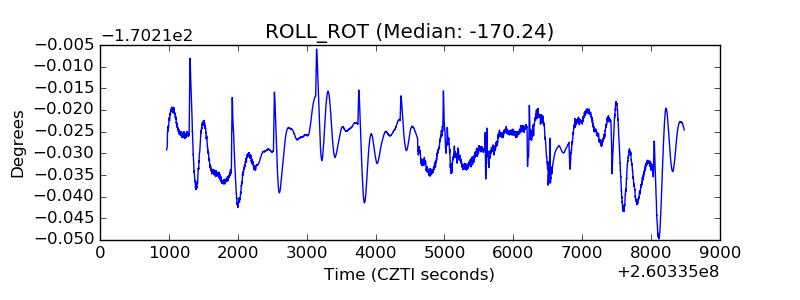 |
| _Roll_DEC | 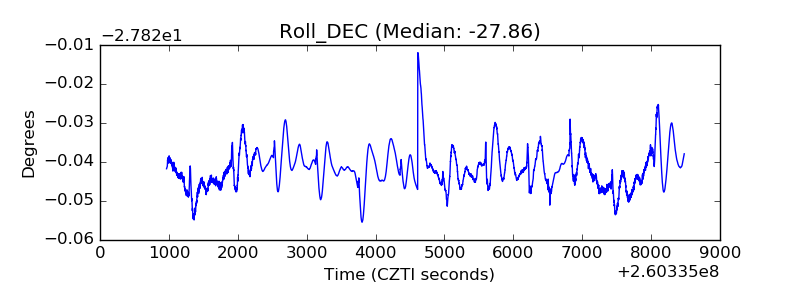 |
| _Roll_RA |  |
| Veto Counter | 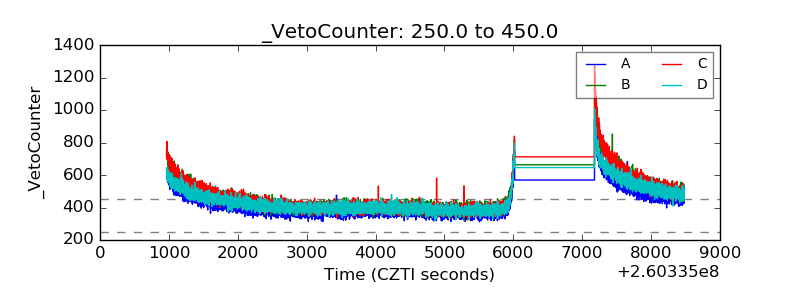 |