| Param | Original file | Final file |
|---|---|---|
| Filename | modeM0/AS1G08_047T01_9000002002_13575cztM0_level2.evt | modeM0/AS1G08_047T01_9000002002_13575cztM0_level2_quad_clean.evt |
| Size (bytes) | 488,053,440 | 66,712,320 |
| Size | 465.4 MB | 63.6 MB |
| Events in quadrant A | 3,294,018 | 397,697 |
| Events in quadrant B | 3,964,224 | 393,158 |
| Events in quadrant C | 3,472,328 | 403,011 |
| Events in quadrant D | 3,621,379 | 385,038 |
| Mode SS | |||
|---|---|---|---|
| Quadrant | BADHDUFLAG | Total packets | Discarded packets |
| A | 0 | 128 | 0 |
| B | 0 | 128 | 0 |
| C | 0 | 128 | 0 |
| D | 0 | 128 | 0 |
| Mode M0 | |||
|---|---|---|---|
| Quadrant | BADHDUFLAG | Total packets | Discarded packets |
| A | 0 | 13608 | 3 |
| B | 0 | 15719 | 2 |
| C | 0 | 14051 | 2 |
| D | 0 | 14659 | 2 |
| Mode M9 | |||
|---|---|---|---|
| Quadrant | BADHDUFLAG | Total packets | Discarded packets |
| A | 0 | 13 | 0 |
| B | 0 | 13 | 0 |
| C | 0 | 13 | 0 |
| D | 0 | 14 | 0 |
| Quadrant | Total seconds | Saturated seconds | Saturation percentage |
|---|---|---|---|
| A | 6320 | 66 | 1.044304% |
| B | 6320 | 245 | 3.876582% |
| C | 6320 | 63 | 0.996835% |
| D | 6320 | 85 | 1.344937% |
Noise dominated data is calculated using 1-second bins in cleaned event files. If a bin has >2000 counts, and if more than 50% of those come from <1% of pixels, then it is considered to be noise-dominated and hence unusable.
| Quadrant | # 1 sec bins | Bins with >0 counts | Bins with >2000 counts | High rate bins dominated by noise | Noise dominated (total time) | Noise dominated (detector-on time) | Marked lightcurve |
|---|---|---|---|---|---|---|---|
| A | 7581 | 6321 | 2 | 2 | 0.03% | 0.03% | 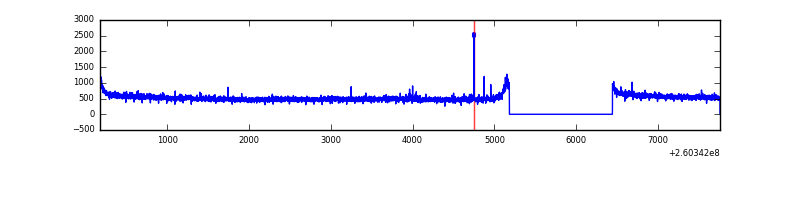 |
| B | 7581 | 6321 | 146 | 146 | 1.93% | 2.31% | 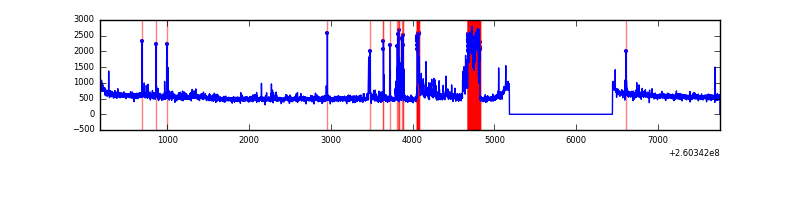 |
| C | 7581 | 6321 | 0 | 0 | 0.00% | 0.00% | 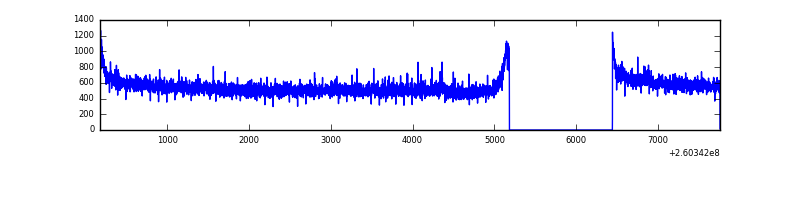 |
| D | 7581 | 6321 | 31 | 31 | 0.41% | 0.49% | 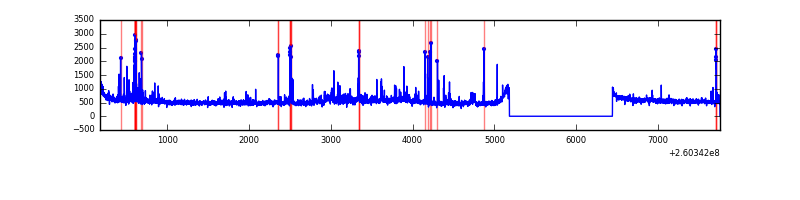 |
Top three noisy pixels from each quadrant. If the there are fewer than three noisy pixels in the level2.evt file, extra rows are filled as -1
| Pixel properties | Quadrant properties | ||||||
|---|---|---|---|---|---|---|---|
| Quadrant | DetID | PixID | Counts | Sigma | Mean | Median | Sigma |
| A | 1 | 162 | 16933 | 95.69 | 845 | 832 | 168.3 |
| A | 15 | 69 | 13622 | 76.01 | 845 | 832 | 168.3 |
| A | 0 | 226 | 7832 | 41.6 | 845 | 832 | 168.3 |
| B | 0 | 182 | 479916 | 3051.08 | 839 | 822 | 157.0 |
| B | 0 | 214 | 58683 | 368.48 | 839 | 822 | 157.0 |
| B | 0 | 85 | 54347 | 340.87 | 839 | 822 | 157.0 |
| C | 3 | 233 | 249368 | 1327.83 | 825 | 831 | 187.2 |
| C | 13 | 61 | 6010 | 27.67 | 825 | 831 | 187.2 |
| C | 0 | 207 | 5581 | 25.38 | 825 | 831 | 187.2 |
| D | 5 | 222 | 194247 | 993.93 | 822 | 800 | 194.6 |
| D | 1 | 20 | 147828 | 755.43 | 822 | 800 | 194.6 |
| D | 8 | 195 | 59945 | 303.89 | 822 | 800 | 194.6 |
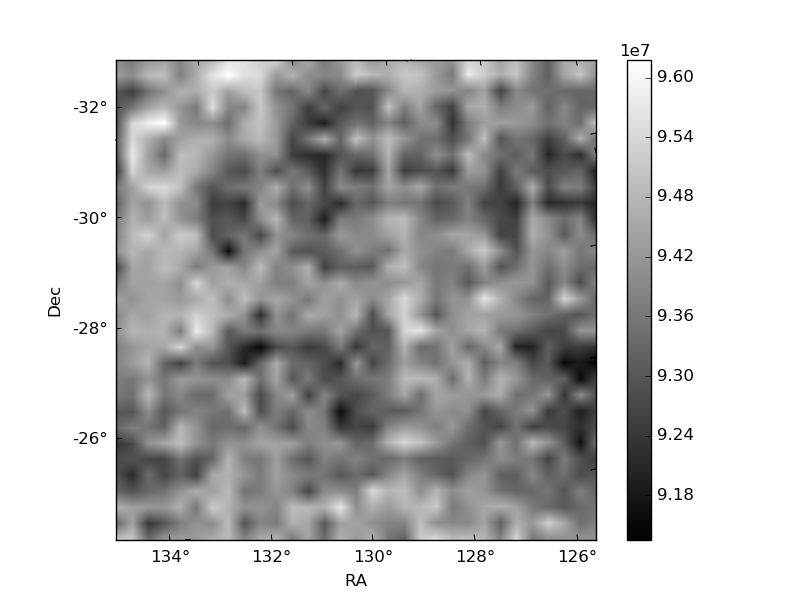
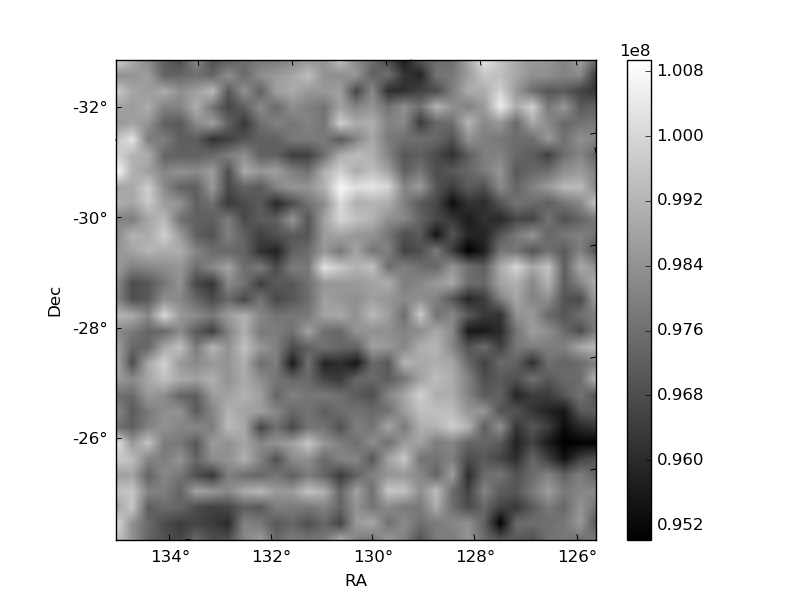
Histogram calculated using DETX and DETY for each event in the final _common_clean file
| Quadrant A | 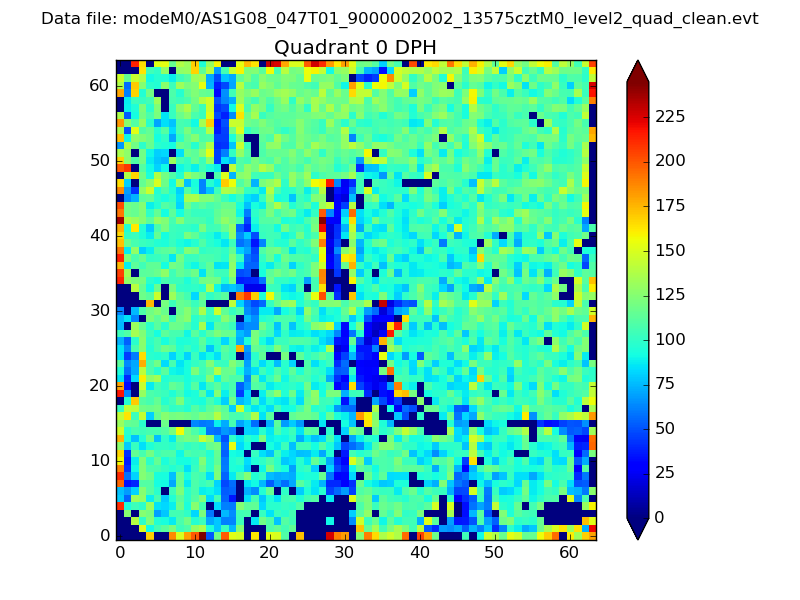 |
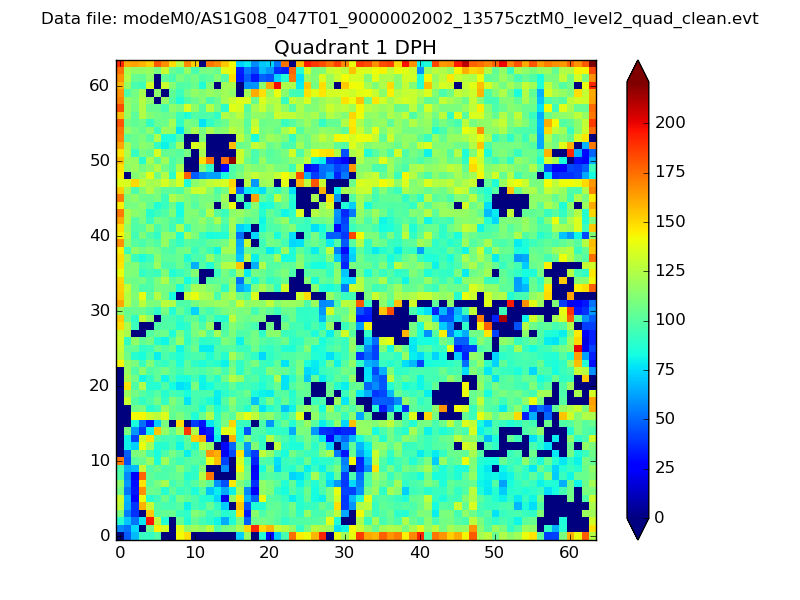 |
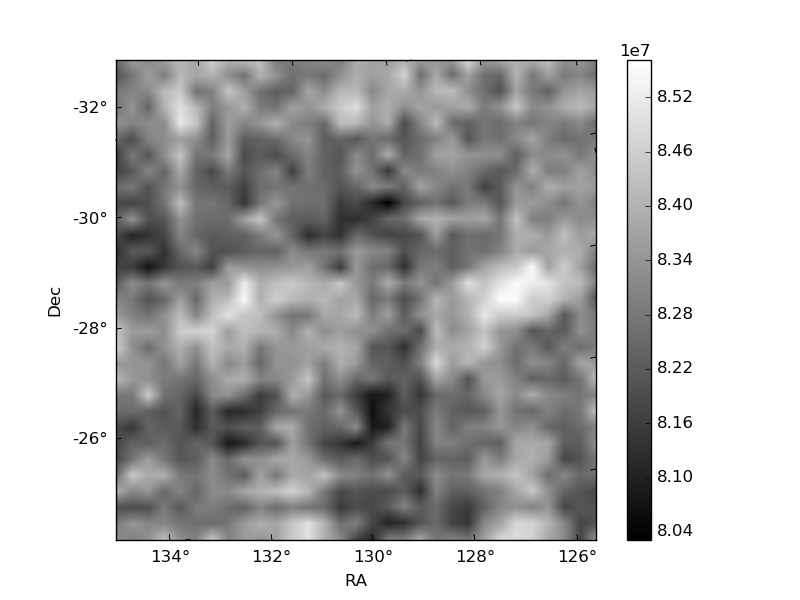
Quadrant B |
|---|---|---|---|
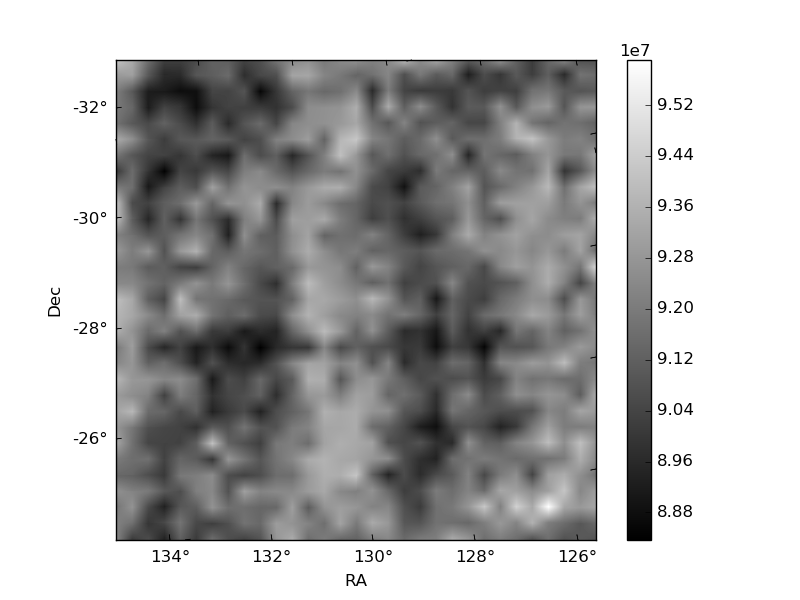
| Quadrant D |  |
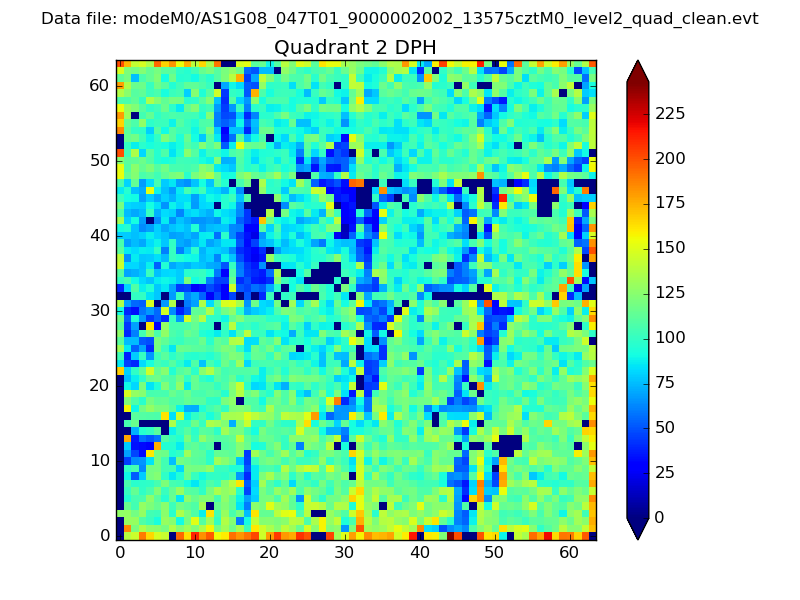 |
Quadrant C |
| Plot type | Count rate plots | Images |
|---|---|---|
| Comparison with Poisson distribution Blue bars denote a histogram of data divided into 1 sec bins. Red curve is a Poisson curve with rate = median count rate of data. |
 |
 |
| Quadrant-wise count rates Data is divided into 100 sec bins |
 |
|
| Module-wise count rates for Quadrant A Data is divided into 100 sec bins |
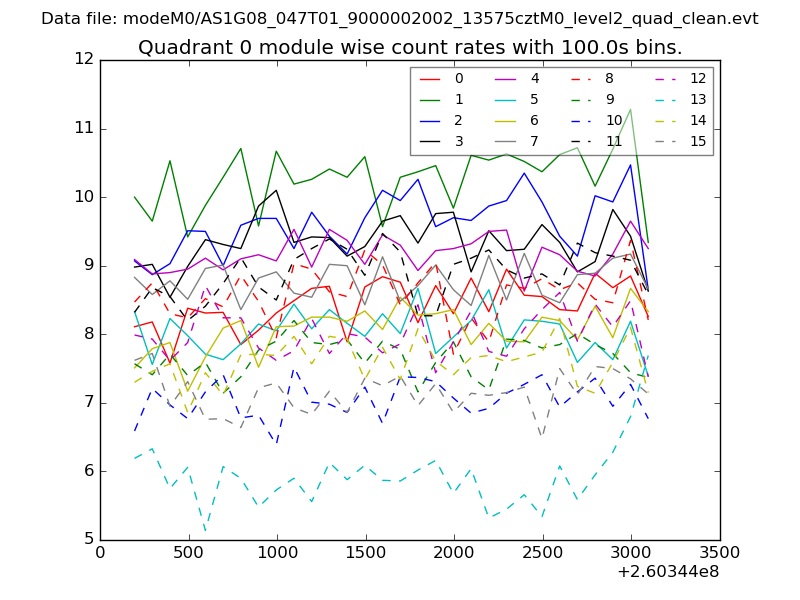 |
 |
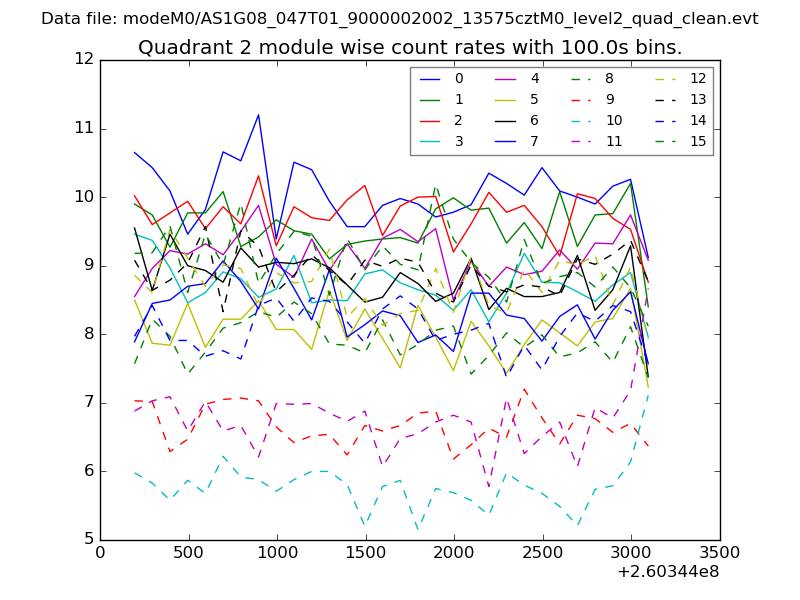
| Module-wise count rates for Quadrant B Data is divided into 100 sec bins |
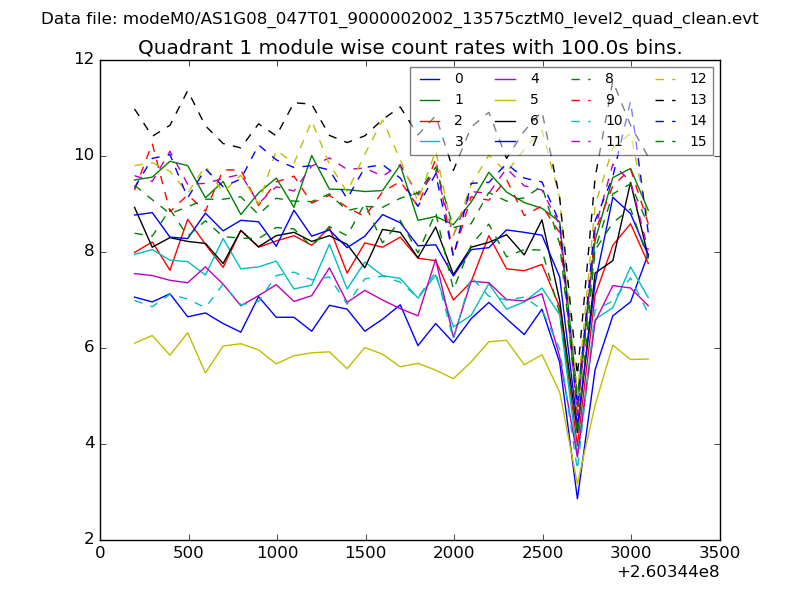 |
 |
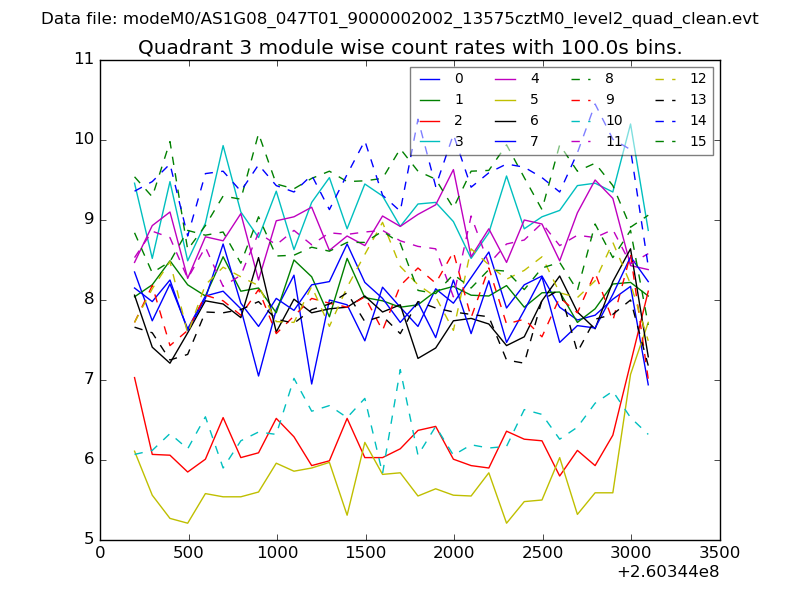
| Module-wise count rates for Quadrant C Data is divided into 100 sec bins |
 |
 |
| Module-wise count rates for Quadrant D Data is divided into 100 sec bins |
 |
 |
| Parameter | Plot |
|---|---|
| CZT HV Monitor | 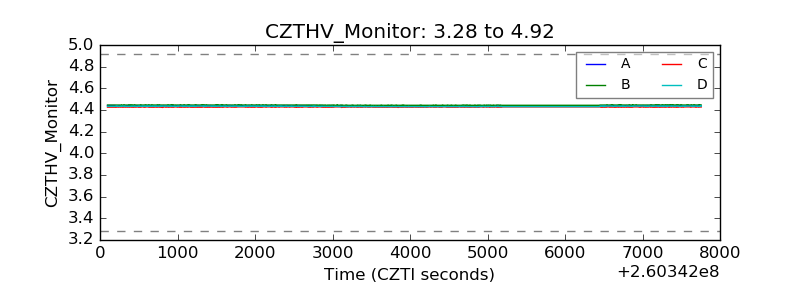 |
| D_VDD | 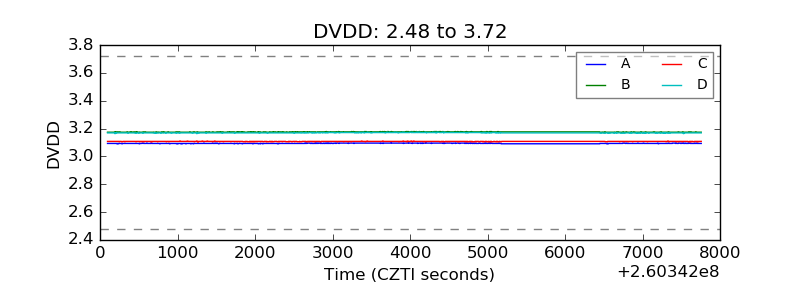 |
| Temperature 1 | 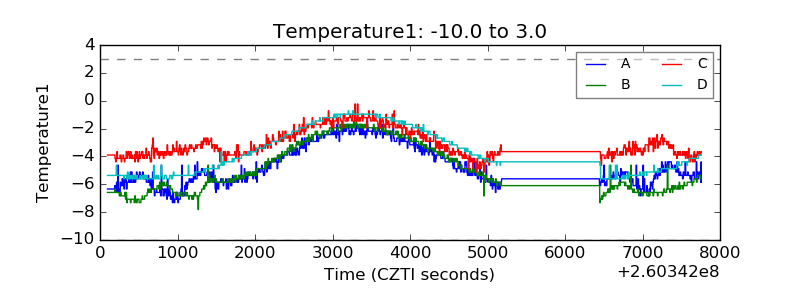 |
| Veto HV Monitor |  |
| Veto LLD | 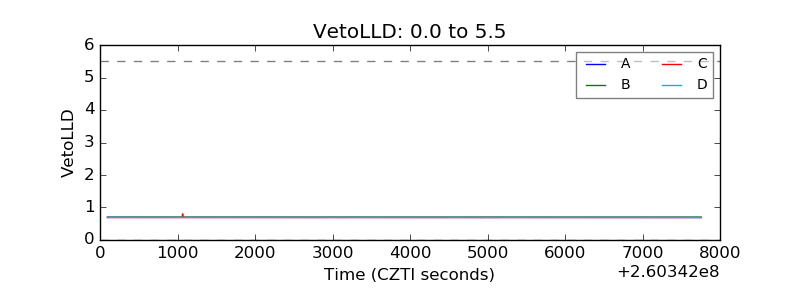 |
| Alpha Counter | 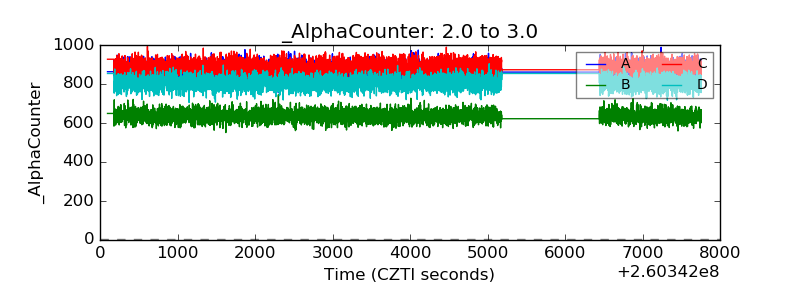 |
| _CPM_Rate |  |
| CZT Counter | 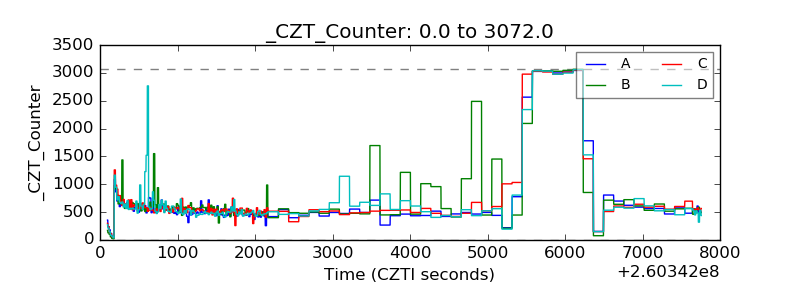 |
| +2.5 Volts monitor | 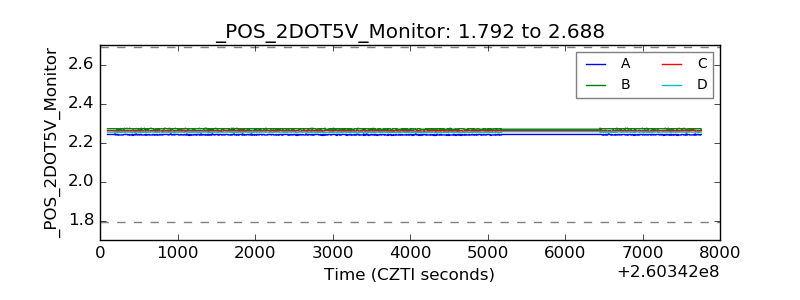 |
| +5 Volts monitor |  |
| _ROLL_ROT | 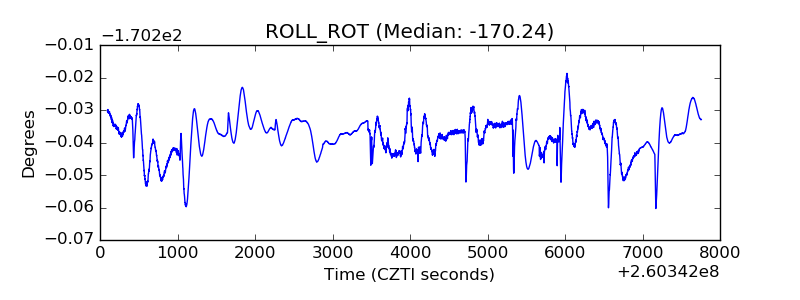 |
| _Roll_DEC | 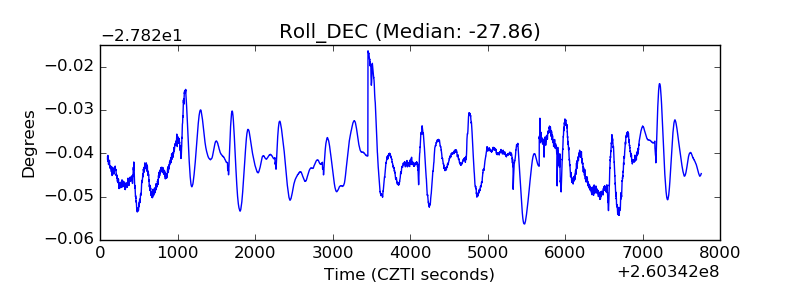 |
| _Roll_RA | 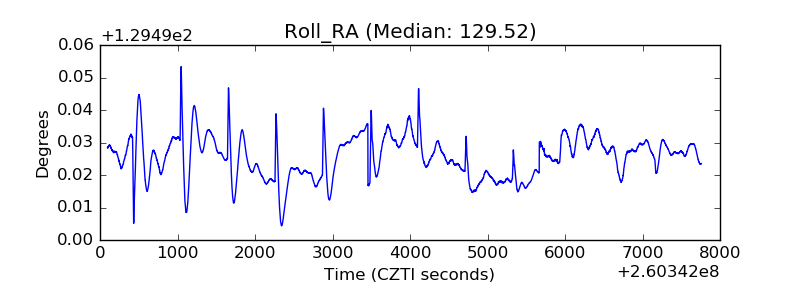 |
| Veto Counter | 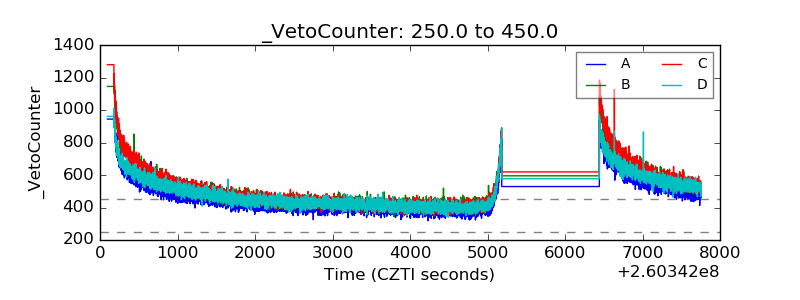 |