| Param | Original file | Final file |
|---|---|---|
| Filename | modeM0/AS1G08_047T01_9000002002_13577cztM0_level2.evt | modeM0/AS1G08_047T01_9000002002_13577cztM0_level2_quad_clean.evt |
| Size (bytes) | 514,704,960 | 95,284,800 |
| Size | 490.9 MB | 90.9 MB |
| Events in quadrant A | 3,472,693 | 617,668 |
| Events in quadrant B | 4,438,102 | 602,513 |
| Events in quadrant C | 3,631,581 | 618,924 |
| Events in quadrant D | 3,606,302 | 595,189 |
| Mode SS | |||
|---|---|---|---|
| Quadrant | BADHDUFLAG | Total packets | Discarded packets |
| A | 0 | 132 | 0 |
| B | 0 | 132 | 0 |
| C | 0 | 132 | 0 |
| D | 0 | 132 | 0 |
| Mode M0 | |||
|---|---|---|---|
| Quadrant | BADHDUFLAG | Total packets | Discarded packets |
| A | 0 | 14177 | 3 |
| B | 0 | 17094 | 2 |
| C | 0 | 14927 | 2 |
| D | 0 | 14673 | 2 |
| Mode M9 | |||
|---|---|---|---|
| Quadrant | BADHDUFLAG | Total packets | Discarded packets |
| A | 0 | 26 | 0 |
| B | 0 | 26 | 0 |
| C | 0 | 26 | 0 |
| D | 0 | 26 | 0 |
| Quadrant | Total seconds | Saturated seconds | Saturation percentage |
|---|---|---|---|
| A | 6474 | 140 | 2.162496% |
| B | 6474 | 532 | 8.217485% |
| C | 6474 | 138 | 2.131603% |
| D | 6474 | 144 | 2.224282% |
Noise dominated data is calculated using 1-second bins in cleaned event files. If a bin has >2000 counts, and if more than 50% of those come from <1% of pixels, then it is considered to be noise-dominated and hence unusable.
| Quadrant | # 1 sec bins | Bins with >0 counts | Bins with >2000 counts | High rate bins dominated by noise | Noise dominated (total time) | Noise dominated (detector-on time) | Marked lightcurve |
|---|---|---|---|---|---|---|---|
| A | 9080 | 6475 | 1 | 1 | 0.01% | 0.02% | 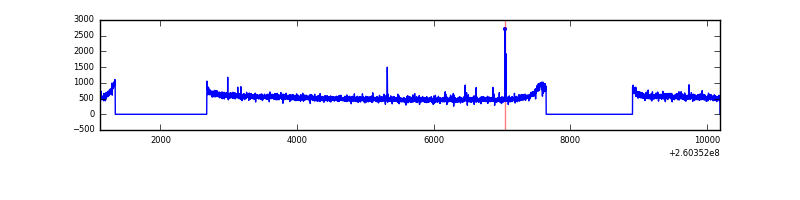 |
| B | 9080 | 6475 | 362 | 362 | 3.99% | 5.59% | 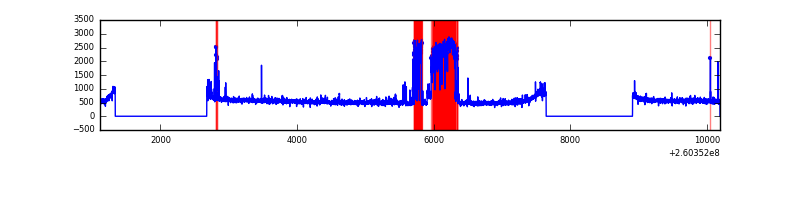 |
| C | 9080 | 6475 | 1 | 1 | 0.01% | 0.02% | 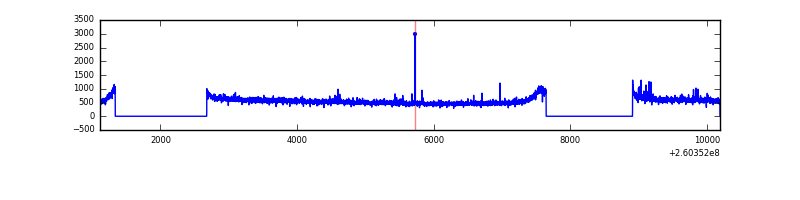 |
| D | 9080 | 6475 | 8 | 8 | 0.09% | 0.12% | 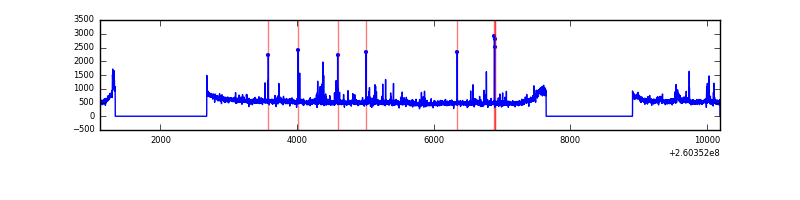 |
Top three noisy pixels from each quadrant. If the there are fewer than three noisy pixels in the level2.evt file, extra rows are filled as -1
| Pixel properties | Quadrant properties | ||||||
|---|---|---|---|---|---|---|---|
| Quadrant | DetID | PixID | Counts | Sigma | Mean | Median | Sigma |
| A | 1 | 162 | 14256 | 74.99 | 893 | 876 | 178.4 |
| A | 0 | 226 | 8527 | 42.88 | 893 | 876 | 178.4 |
| A | 15 | 69 | 7476 | 36.99 | 893 | 876 | 178.4 |
| B | 0 | 182 | 938066 | 5743.72 | 867 | 849 | 163.2 |
| B | 4 | 80 | 35260 | 210.89 | 867 | 849 | 163.2 |
| B | 0 | 189 | 27554 | 163.66 | 867 | 849 | 163.2 |
| C | 3 | 233 | 250496 | 1267.89 | 864 | 871 | 196.9 |
| C | 14 | 234 | 9843 | 45.57 | 864 | 871 | 196.9 |
| C | 13 | 61 | 6545 | 28.82 | 864 | 871 | 196.9 |
| D | 8 | 195 | 95652 | 454.55 | 870 | 847 | 208.6 |
| D | 1 | 20 | 46674 | 219.72 | 870 | 847 | 208.6 |
| D | 13 | 104 | 36992 | 173.3 | 870 | 847 | 208.6 |
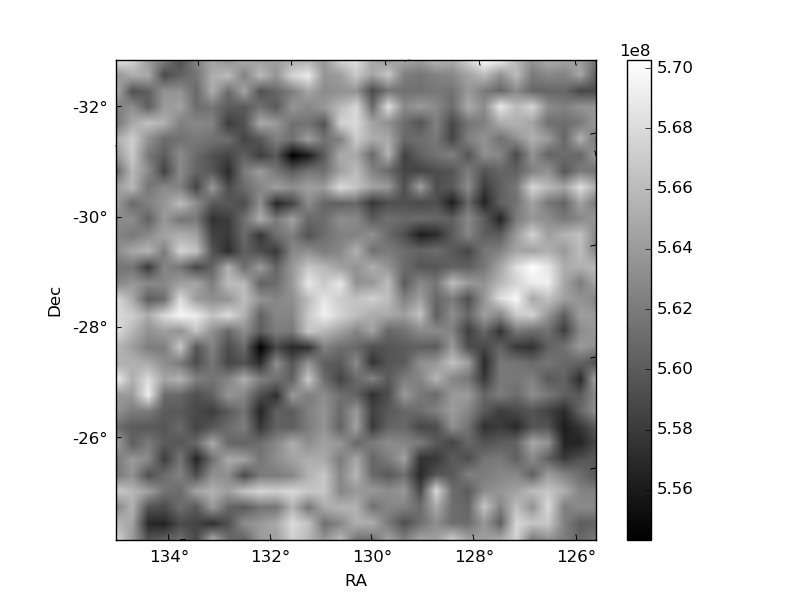
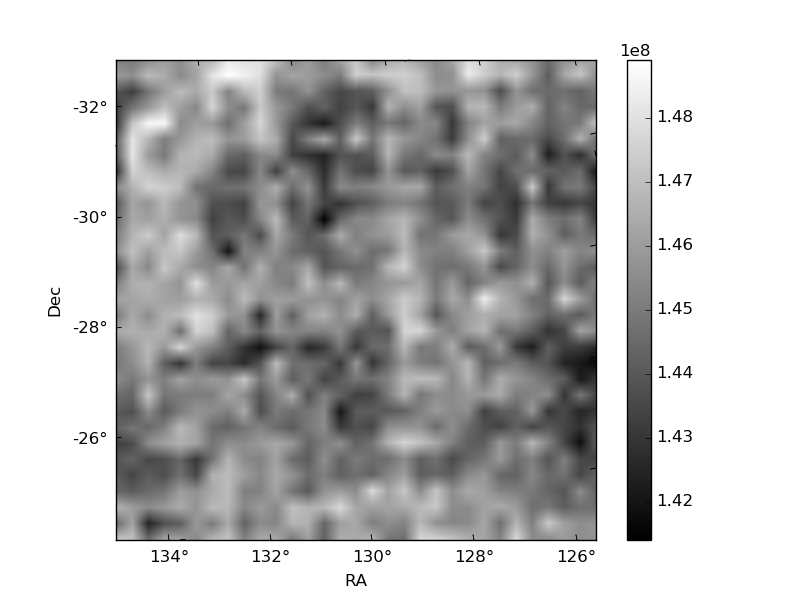
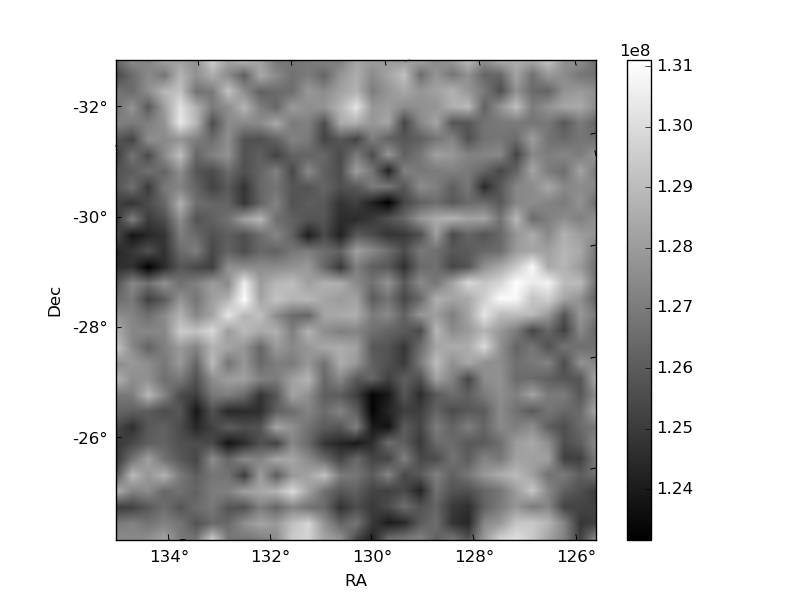
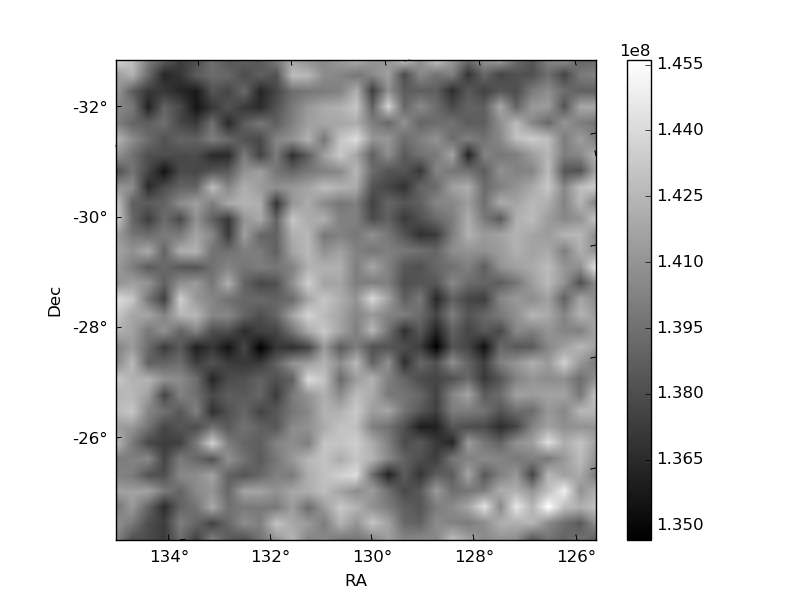
Histogram calculated using DETX and DETY for each event in the final _common_clean file
| Quadrant A | 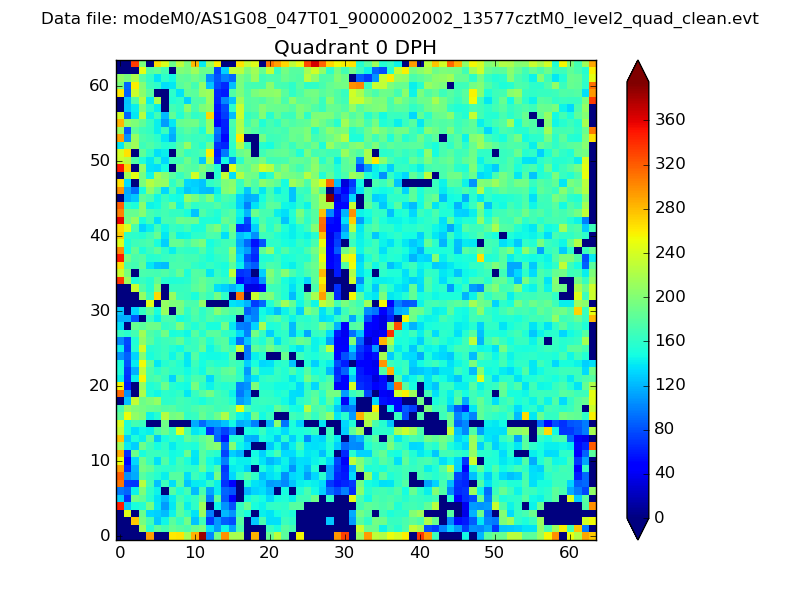 |
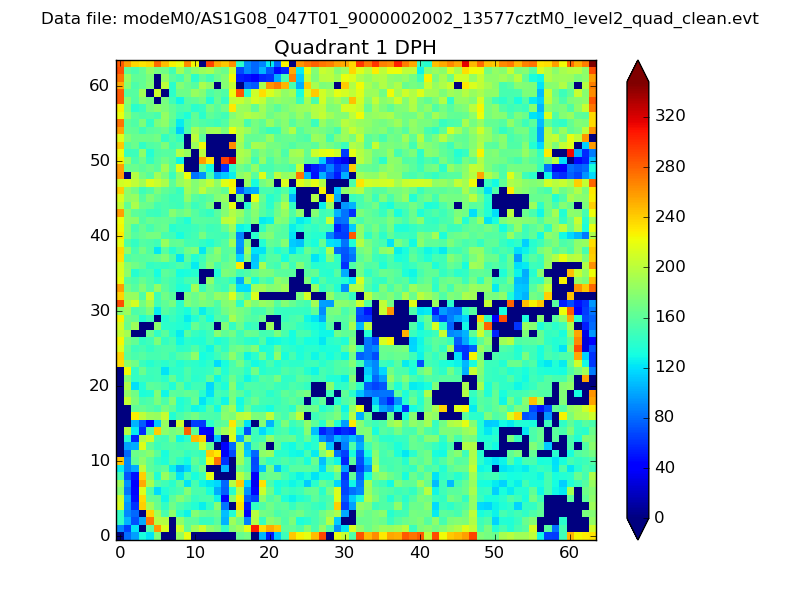 |
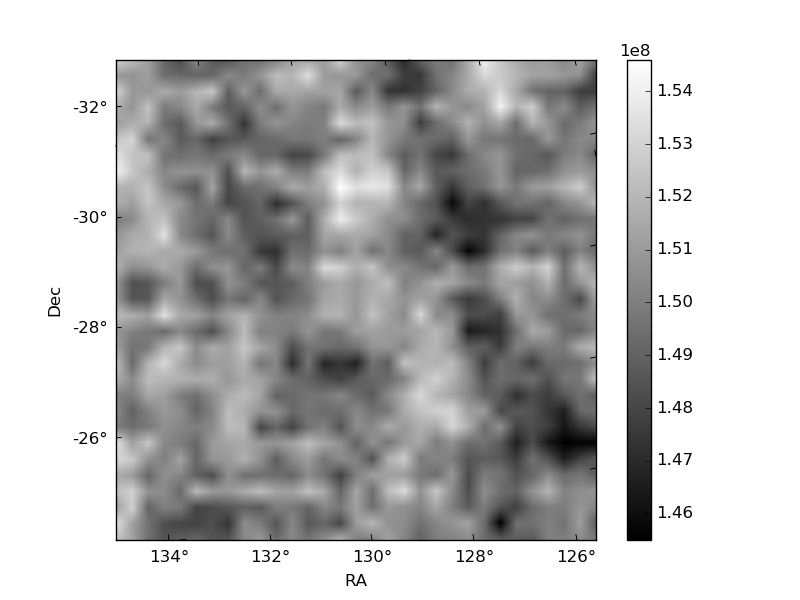
Quadrant B |
|---|---|---|---|
| Quadrant D | 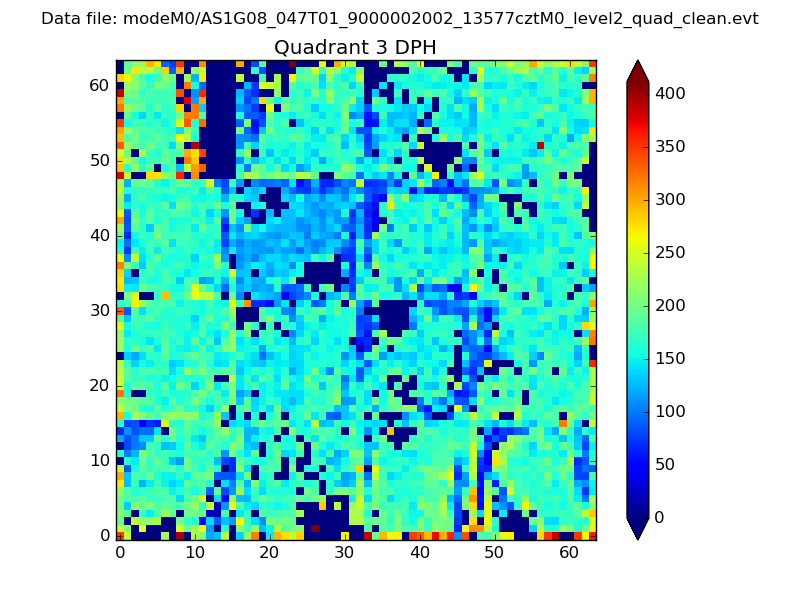 |
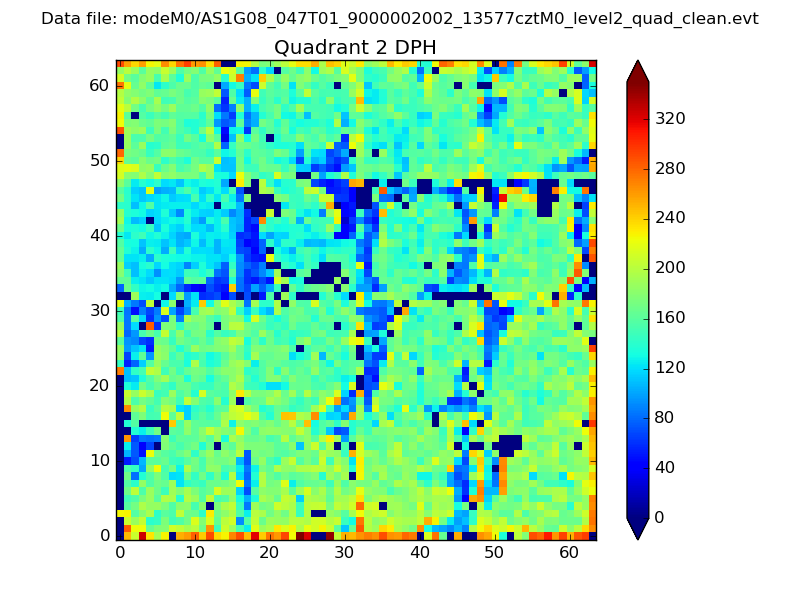 |
Quadrant C |
| Plot type | Count rate plots | Images |
|---|---|---|
| Comparison with Poisson distribution Blue bars denote a histogram of data divided into 1 sec bins. Red curve is a Poisson curve with rate = median count rate of data. |
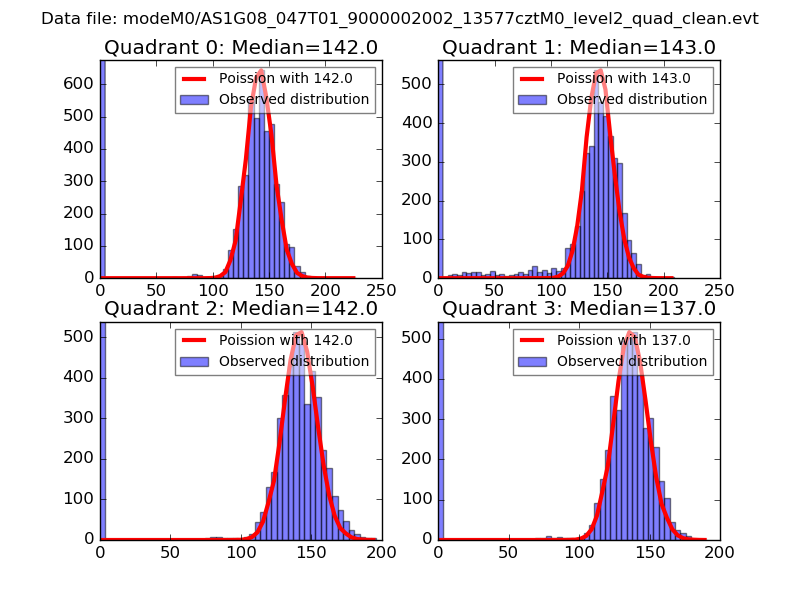 |
 |
| Quadrant-wise count rates Data is divided into 100 sec bins |
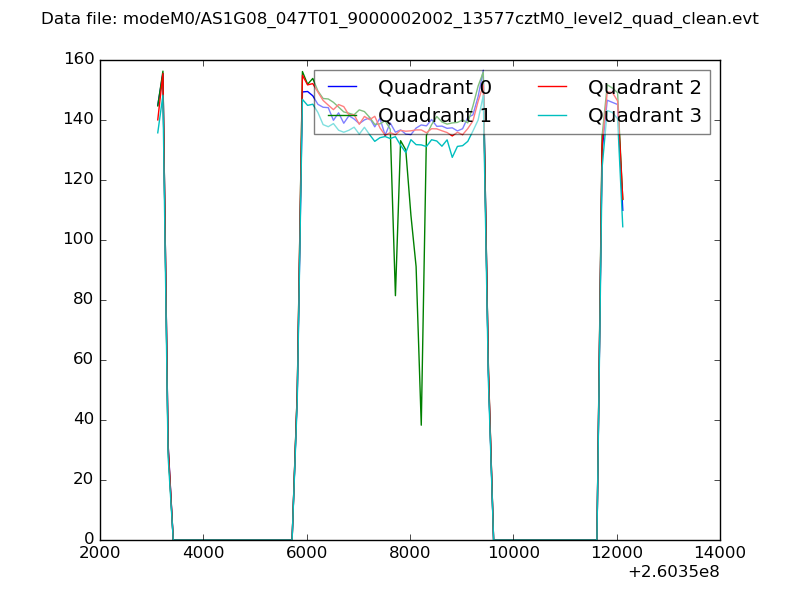 |
|
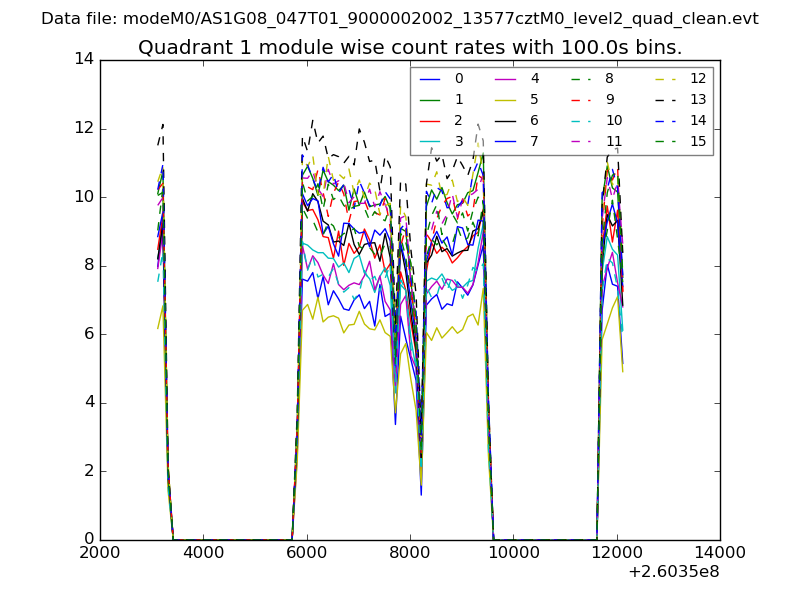
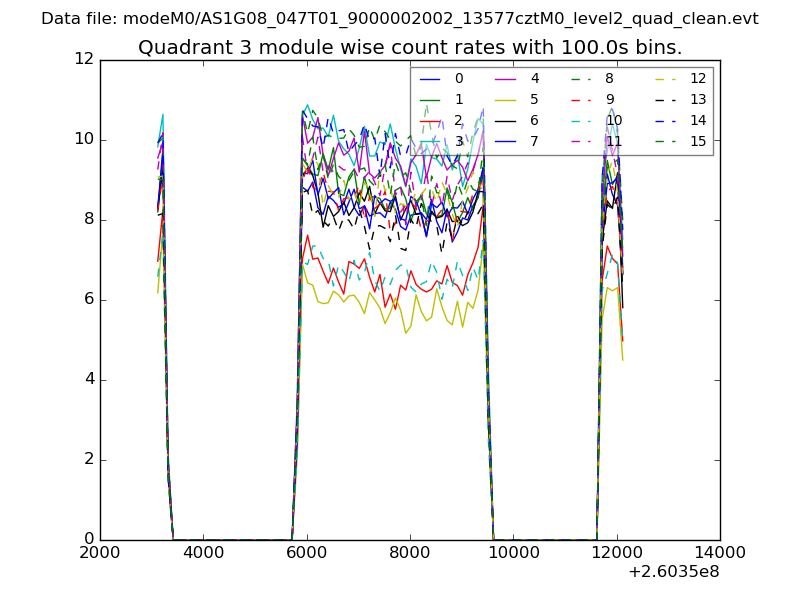
| Module-wise count rates for Quadrant A Data is divided into 100 sec bins |
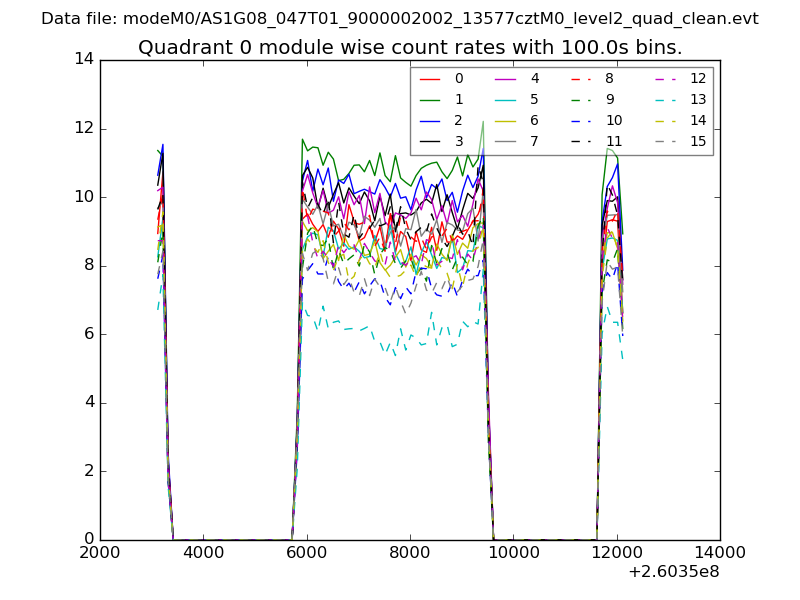 |
 |
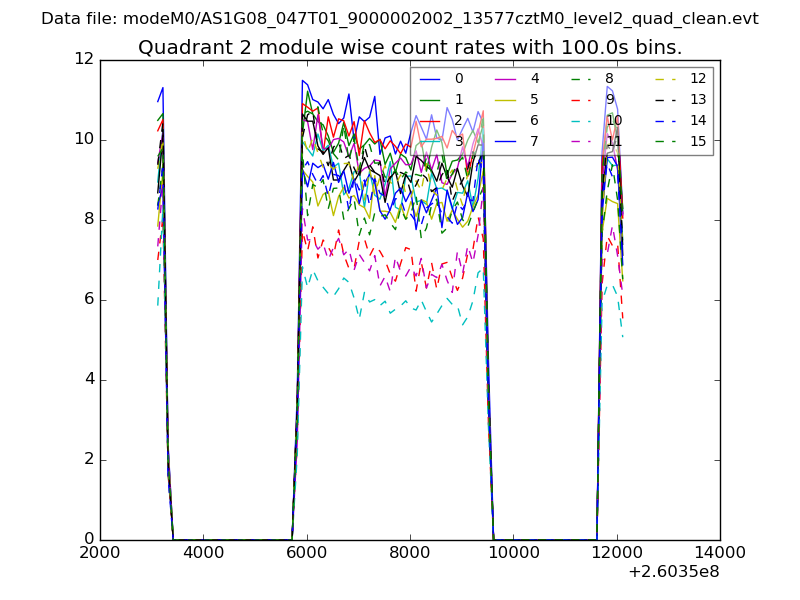
| Module-wise count rates for Quadrant B Data is divided into 100 sec bins |
 |
 |
| Module-wise count rates for Quadrant C Data is divided into 100 sec bins |
 |
 |
| Module-wise count rates for Quadrant D Data is divided into 100 sec bins |
 |
 |
| Parameter | Plot |
|---|---|
| CZT HV Monitor | 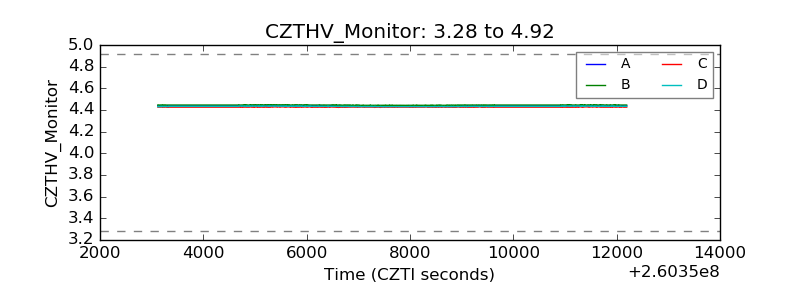 |
| D_VDD | 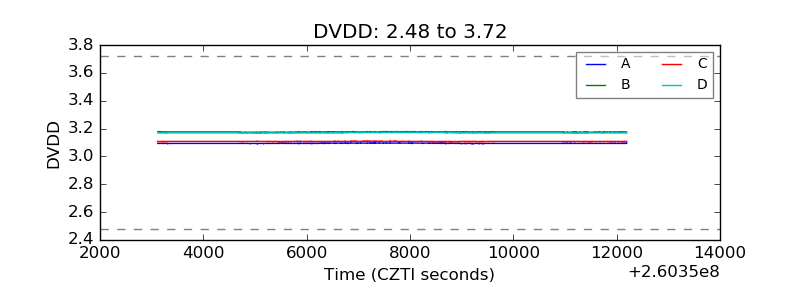 |
| Temperature 1 | 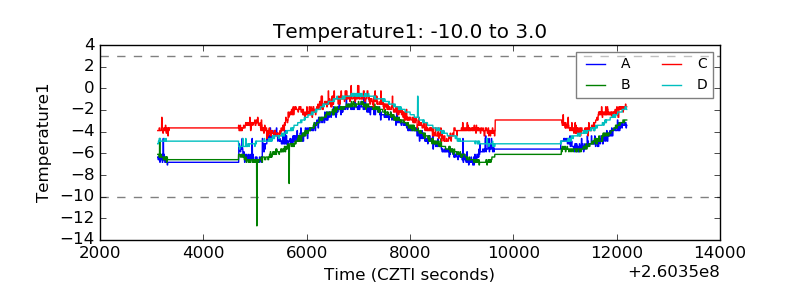 |
| Veto HV Monitor | 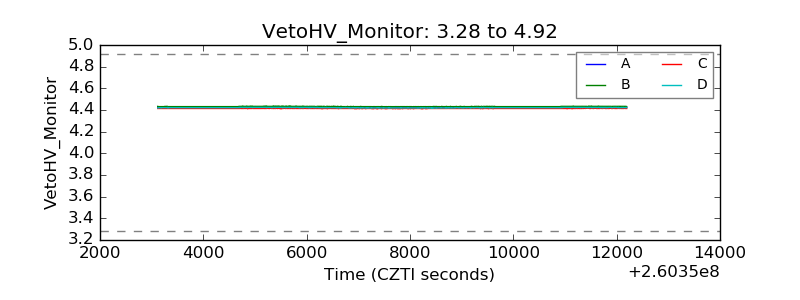 |
| Veto LLD | 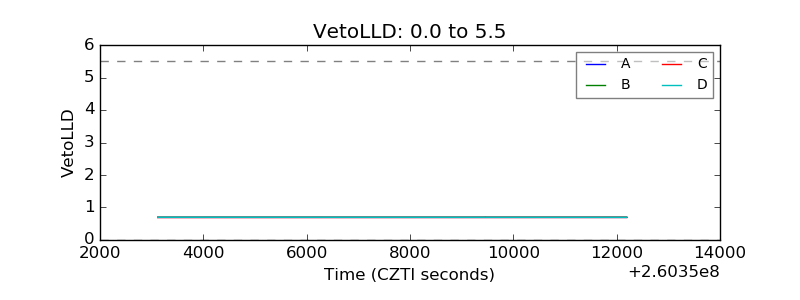 |
| Alpha Counter | 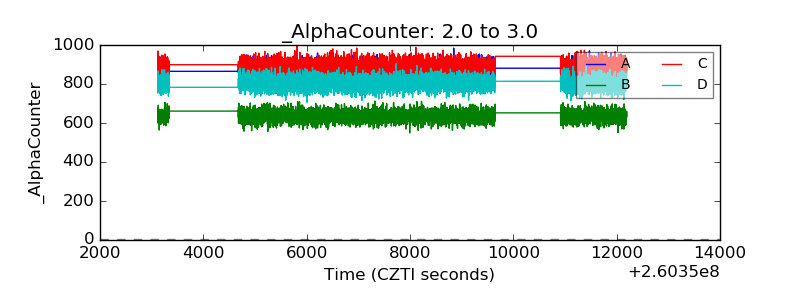 |
| _CPM_Rate | 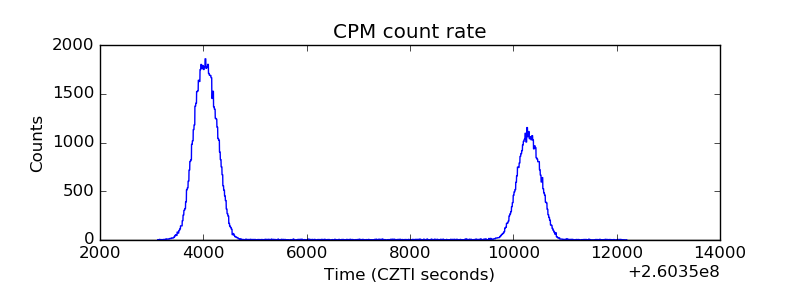 |
| CZT Counter | 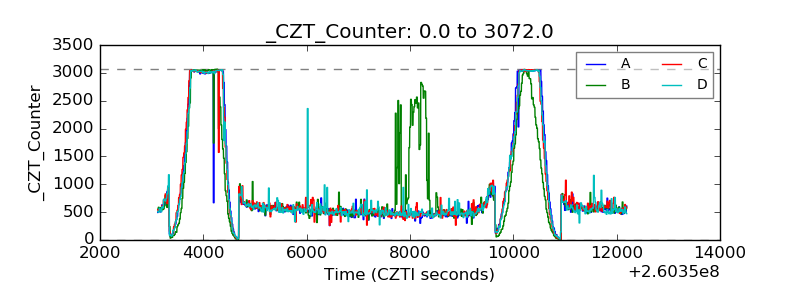 |
| +2.5 Volts monitor | 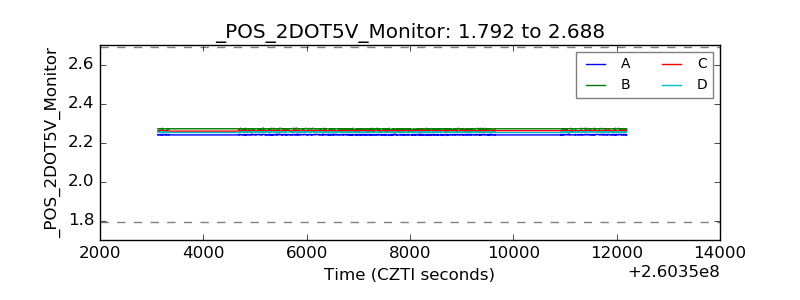 |
| +5 Volts monitor |  |
| _ROLL_ROT | 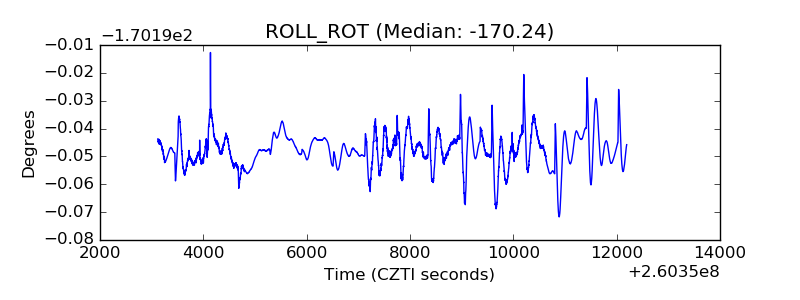 |
| _Roll_DEC | 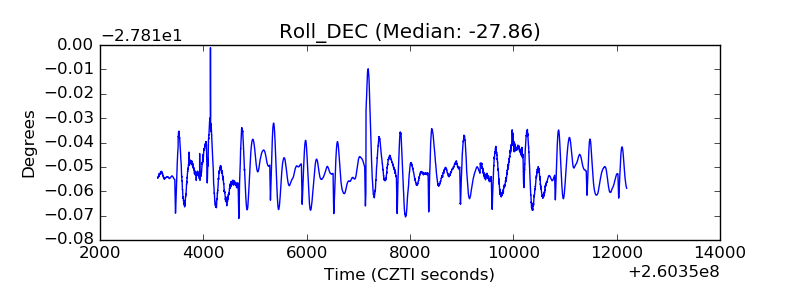 |
| _Roll_RA | 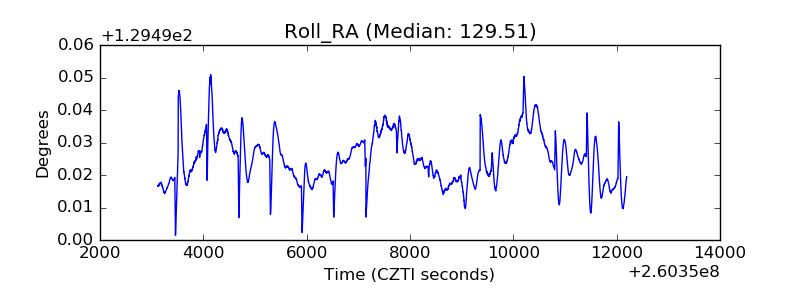 |
| Veto Counter | 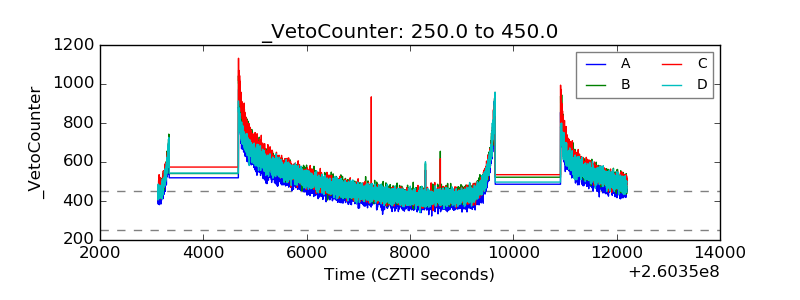 |