| Param | Original file | Final file |
|---|---|---|
| Filename | modeM0/AS1G08_047T01_9000002002_13579cztM0_level2.evt | modeM0/AS1G08_047T01_9000002002_13579cztM0_level2_quad_clean.evt |
| Size (bytes) | 486,403,200 | 98,887,680 |
| Size | 463.9 MB | 94.3 MB |
| Events in quadrant A | 3,228,044 | 640,843 |
| Events in quadrant B | 3,677,547 | 642,010 |
| Events in quadrant C | 3,397,249 | 639,659 |
| Events in quadrant D | 3,977,302 | 609,688 |
| Mode SS | |||
|---|---|---|---|
| Quadrant | BADHDUFLAG | Total packets | Discarded packets |
| A | 0 | 136 | 0 |
| B | 0 | 136 | 0 |
| C | 0 | 136 | 0 |
| D | 0 | 136 | 0 |
| Mode M0 | |||
|---|---|---|---|
| Quadrant | BADHDUFLAG | Total packets | Discarded packets |
| A | 0 | 13780 | 3 |
| B | 0 | 15103 | 2 |
| C | 0 | 14138 | 2 |
| D | 0 | 16055 | 2 |
| Mode M9 | |||
|---|---|---|---|
| Quadrant | BADHDUFLAG | Total packets | Discarded packets |
| A | 0 | 14 | 0 |
| B | 0 | 14 | 0 |
| C | 0 | 14 | 0 |
| D | 0 | 15 | 0 |
| Quadrant | Total seconds | Saturated seconds | Saturation percentage |
|---|---|---|---|
| A | 6630 | 95 | 1.432881% |
| B | 6630 | 205 | 3.092006% |
| C | 6630 | 55 | 0.829563% |
| D | 6630 | 165 | 2.488688% |
Noise dominated data is calculated using 1-second bins in cleaned event files. If a bin has >2000 counts, and if more than 50% of those come from <1% of pixels, then it is considered to be noise-dominated and hence unusable.
| Quadrant | # 1 sec bins | Bins with >0 counts | Bins with >2000 counts | High rate bins dominated by noise | Noise dominated (total time) | Noise dominated (detector-on time) | Marked lightcurve |
|---|---|---|---|---|---|---|---|
| A | 7496 | 6631 | 0 | 0 | 0.00% | 0.00% | 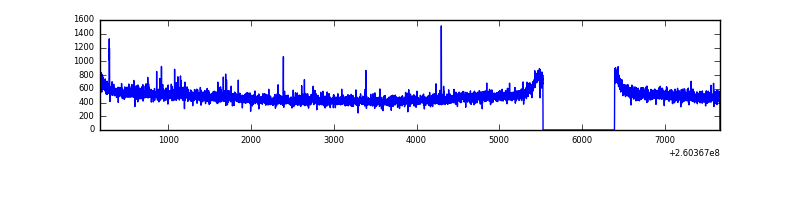 |
| B | 7496 | 6631 | 79 | 79 | 1.05% | 1.19% | 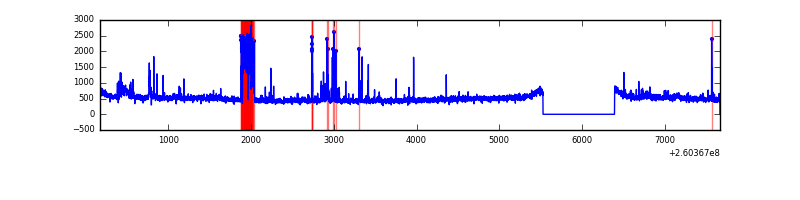 |
| C | 7496 | 6631 | 0 | 0 | 0.00% | 0.00% | 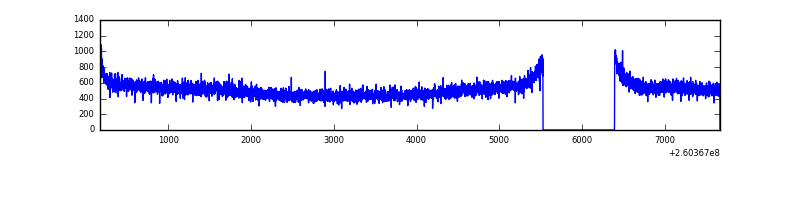 |
| D | 7496 | 6631 | 120 | 120 | 1.60% | 1.81% | 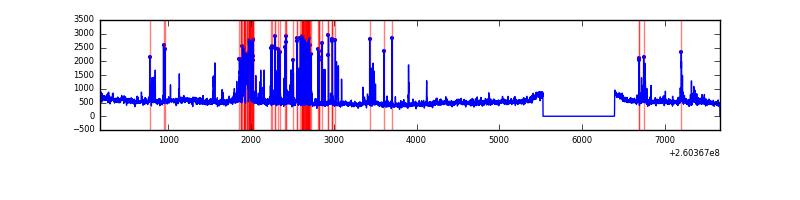 |
Top three noisy pixels from each quadrant. If the there are fewer than three noisy pixels in the level2.evt file, extra rows are filled as -1
| Pixel properties | Quadrant properties | ||||||
|---|---|---|---|---|---|---|---|
| Quadrant | DetID | PixID | Counts | Sigma | Mean | Median | Sigma |
| A | 1 | 162 | 18932 | 107.61 | 830 | 812 | 168.4 |
| A | 15 | 69 | 8953 | 48.35 | 830 | 812 | 168.4 |
| A | 0 | 226 | 7418 | 39.23 | 830 | 812 | 168.4 |
| B | 4 | 142 | 250202 | 1593.84 | 819 | 800 | 156.5 |
| B | 3 | 64 | 81678 | 516.86 | 819 | 800 | 156.5 |
| B | 0 | 182 | 59296 | 373.83 | 819 | 800 | 156.5 |
| C | 3 | 233 | 289798 | 1574.05 | 797 | 801 | 183.6 |
| C | 13 | 61 | 5789 | 27.17 | 797 | 801 | 183.6 |
| C | 8 | 222 | 1850 | 5.71 | 797 | 801 | 183.6 |
| D | 1 | 20 | 492165 | 2607.83 | 797 | 776 | 188.4 |
| D | 8 | 195 | 242866 | 1284.79 | 797 | 776 | 188.4 |
| D | 13 | 249 | 84566 | 444.68 | 797 | 776 | 188.4 |
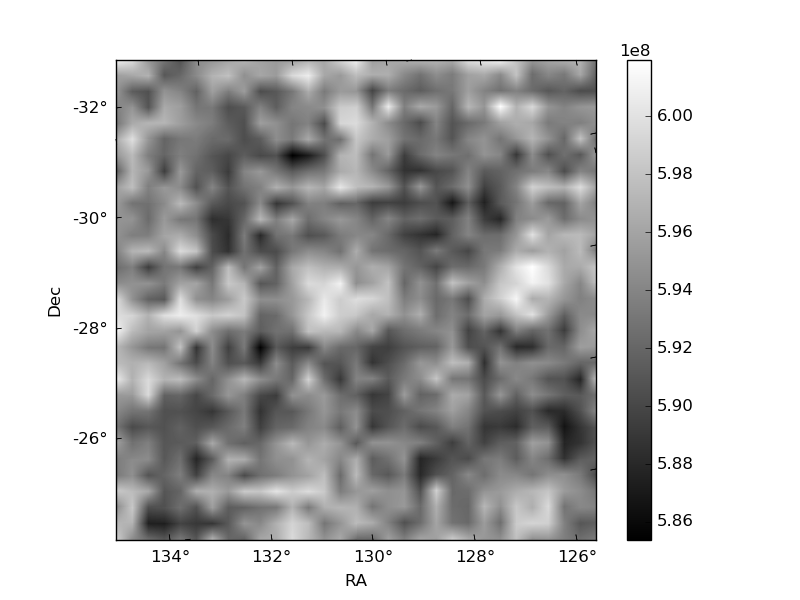
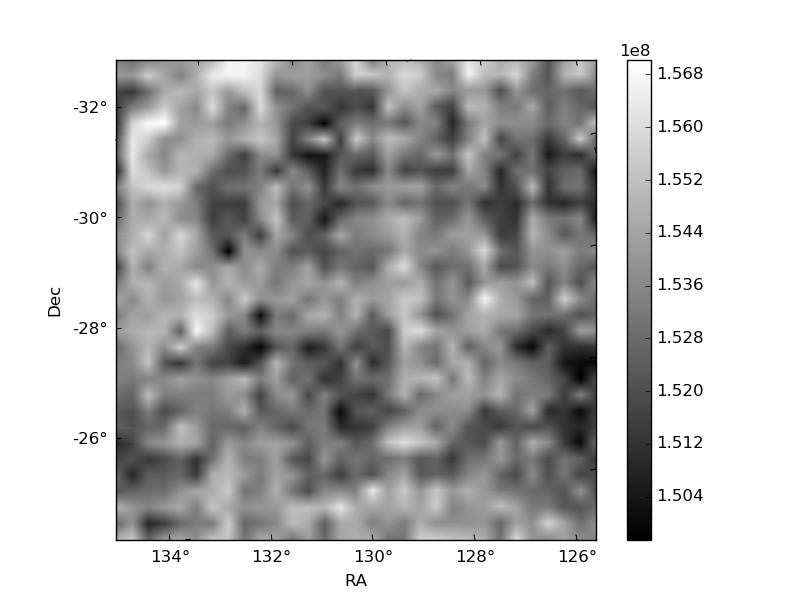
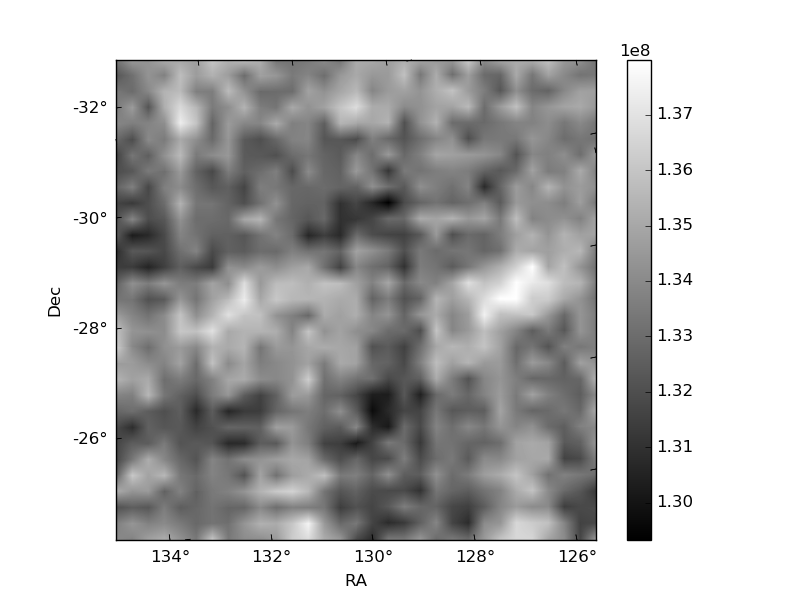
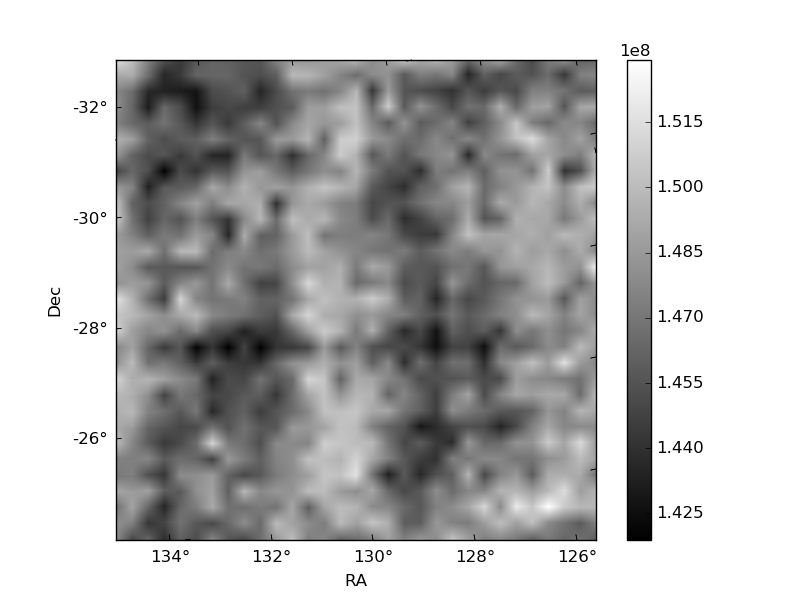
Histogram calculated using DETX and DETY for each event in the final _common_clean file
| Quadrant A | 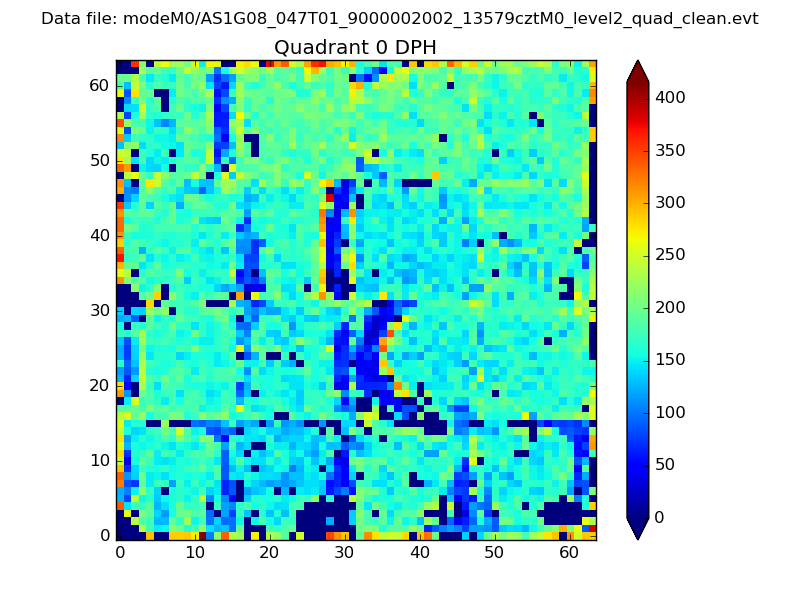 |
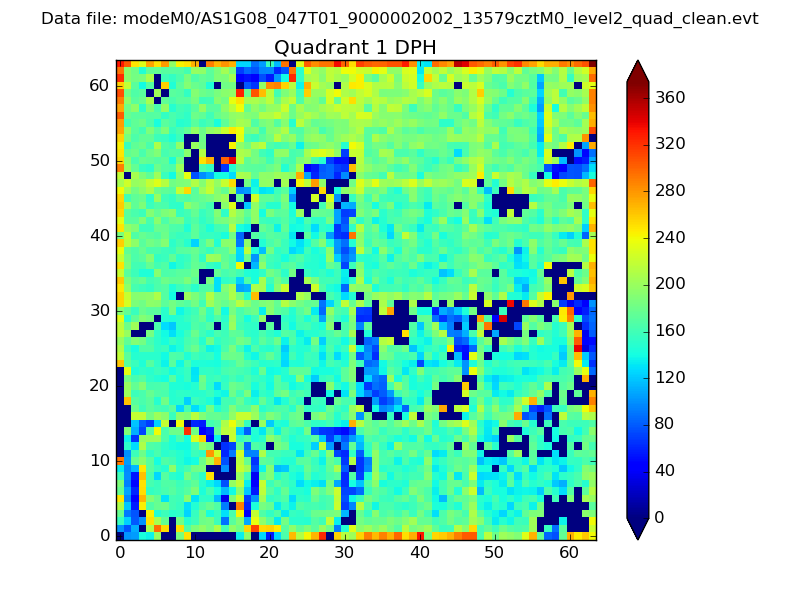 |
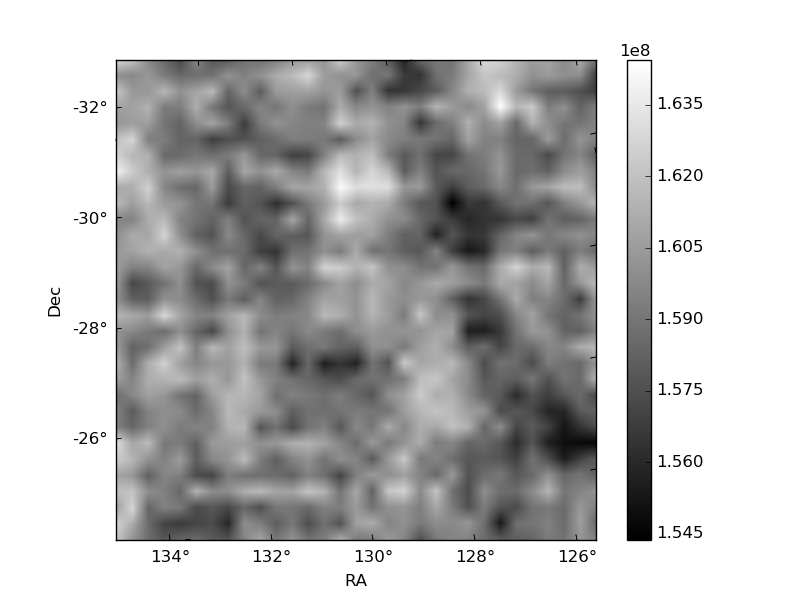
Quadrant B |
|---|---|---|---|
| Quadrant D | 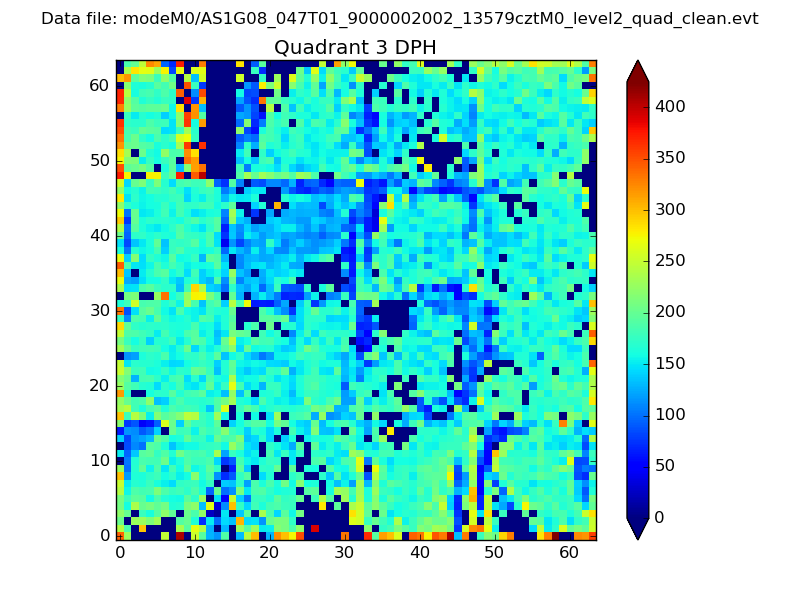 |
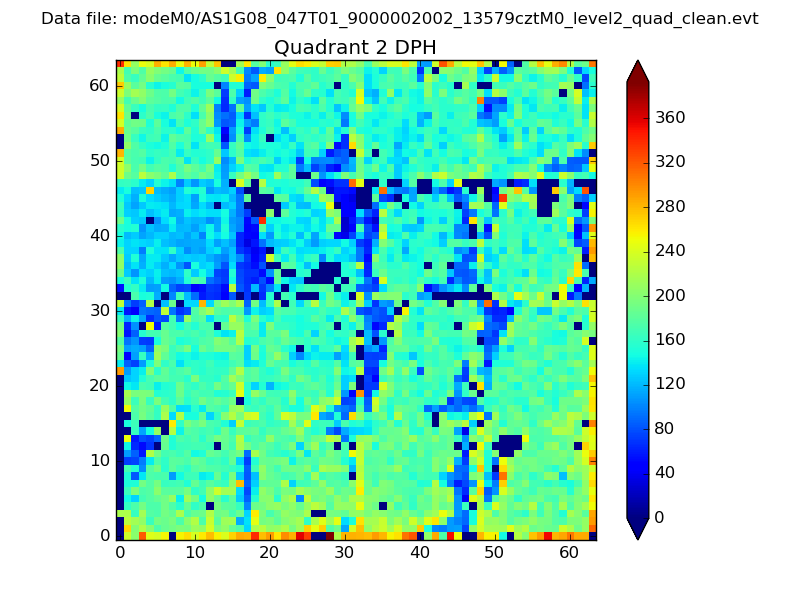 |
Quadrant C |
| Plot type | Count rate plots | Images |
|---|---|---|
| Comparison with Poisson distribution Blue bars denote a histogram of data divided into 1 sec bins. Red curve is a Poisson curve with rate = median count rate of data. |
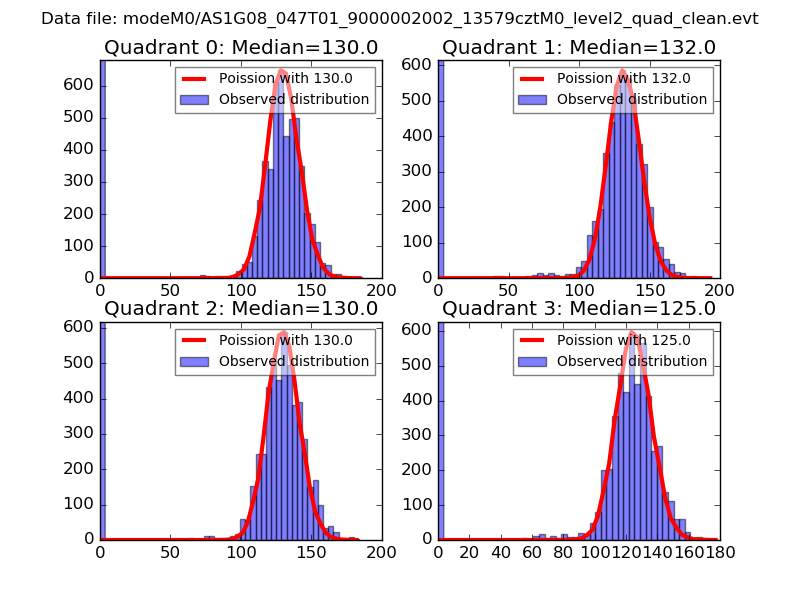 |
 |
| Quadrant-wise count rates Data is divided into 100 sec bins |
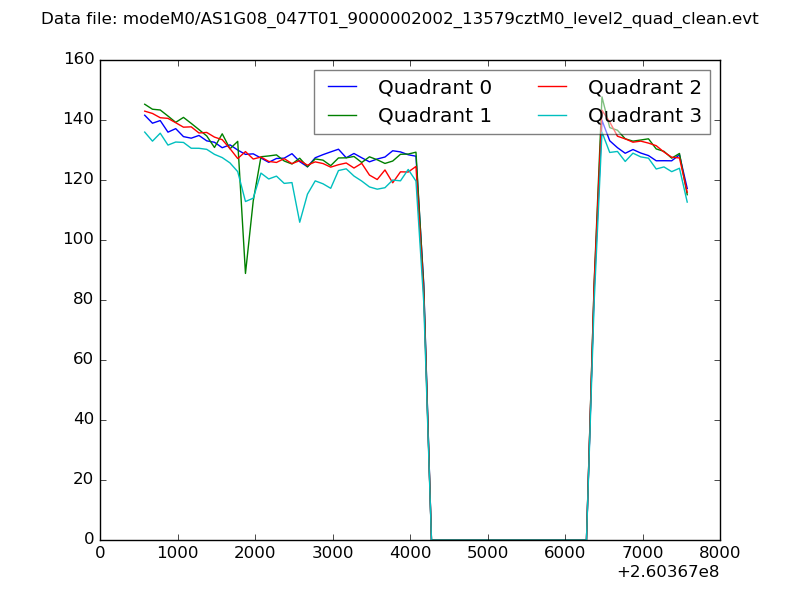 |
|
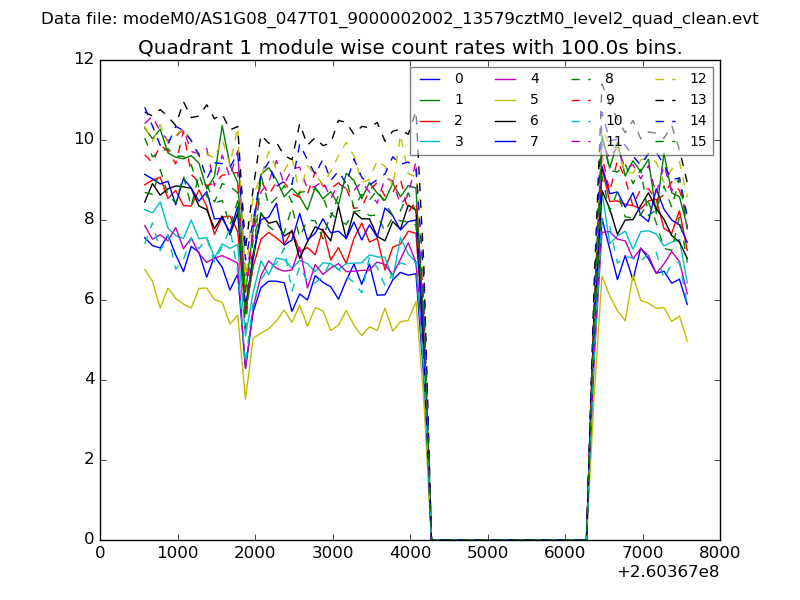
| Module-wise count rates for Quadrant A Data is divided into 100 sec bins |
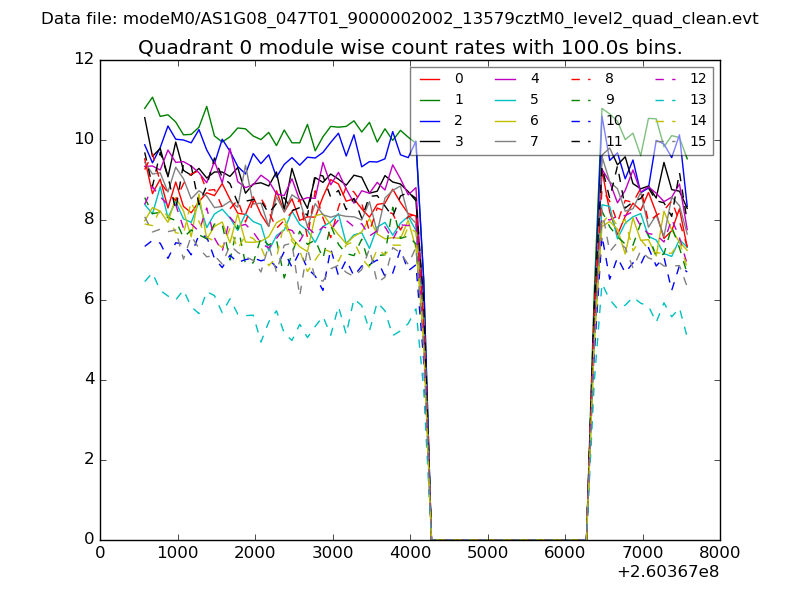 |
 |
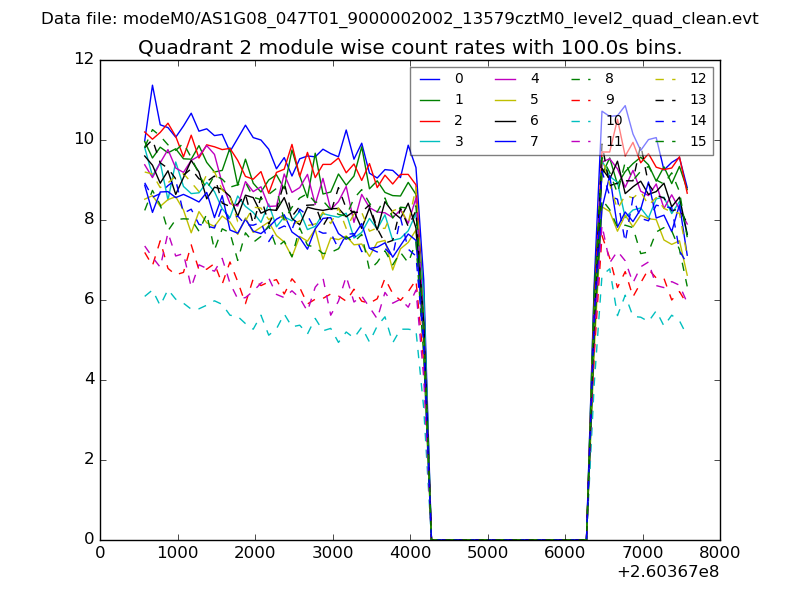
| Module-wise count rates for Quadrant B Data is divided into 100 sec bins |
 |
 |
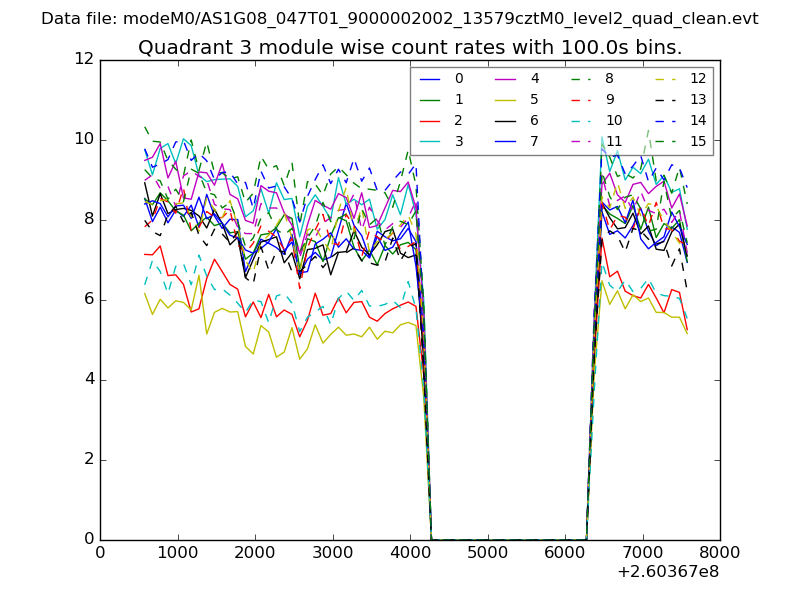
| Module-wise count rates for Quadrant C Data is divided into 100 sec bins |
 |
 |
| Module-wise count rates for Quadrant D Data is divided into 100 sec bins |
 |
 |
| Parameter | Plot |
|---|---|
| CZT HV Monitor | 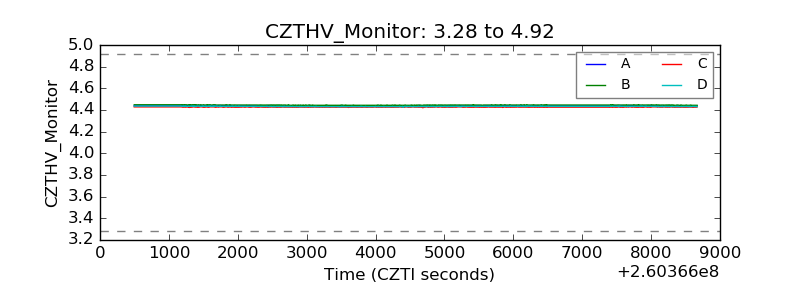 |
| D_VDD | 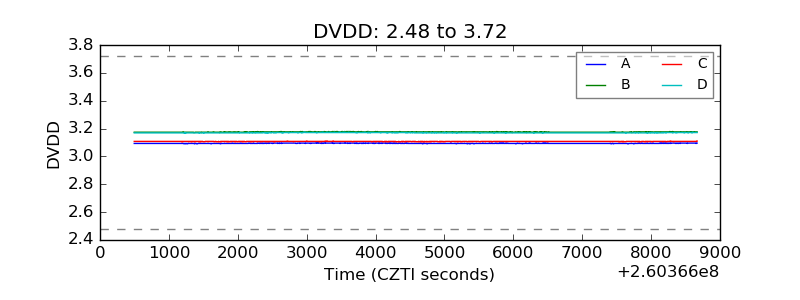 |
| Temperature 1 | 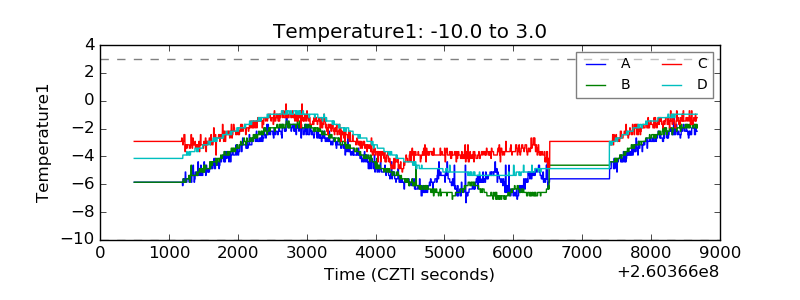 |
| Veto HV Monitor | 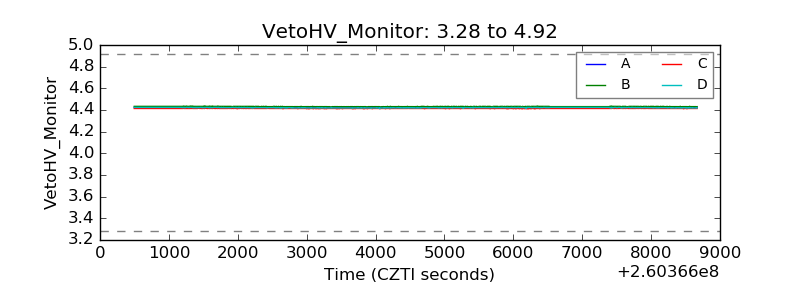 |
| Veto LLD | 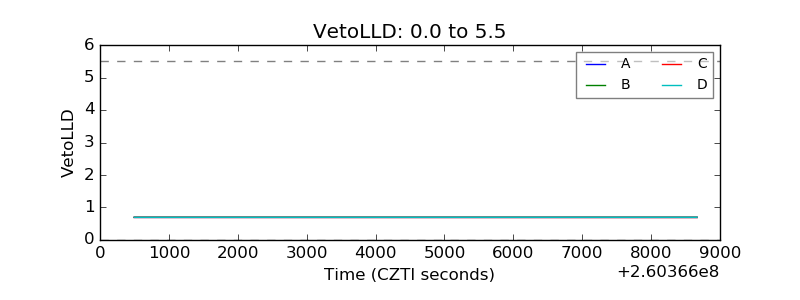 |
| Alpha Counter | 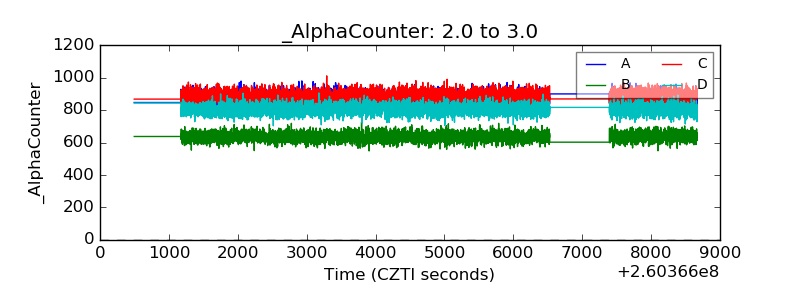 |
| _CPM_Rate | 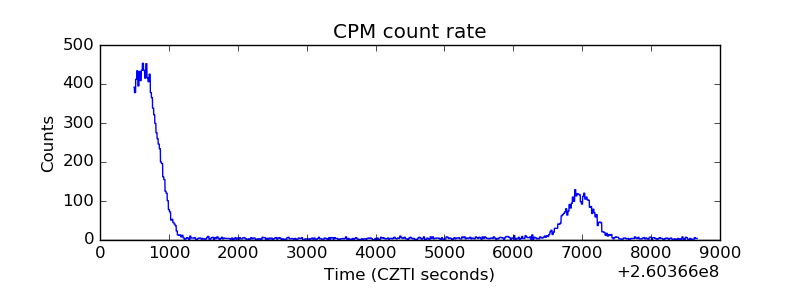 |
| CZT Counter | 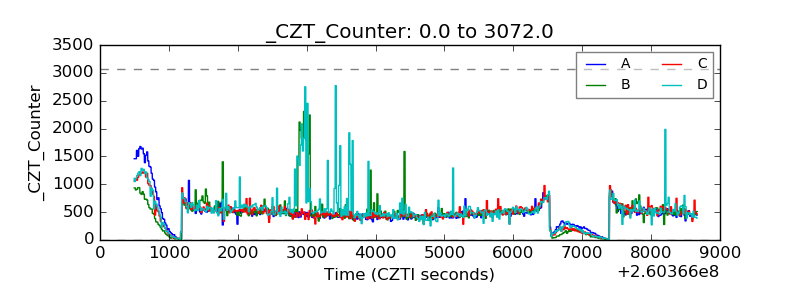 |
| +2.5 Volts monitor |  |
| +5 Volts monitor |  |
| _ROLL_ROT | 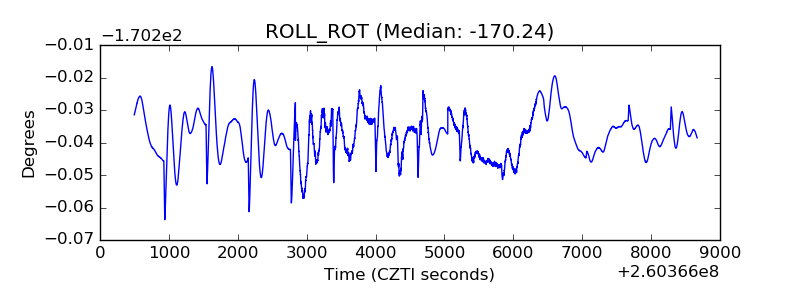 |
| _Roll_DEC | 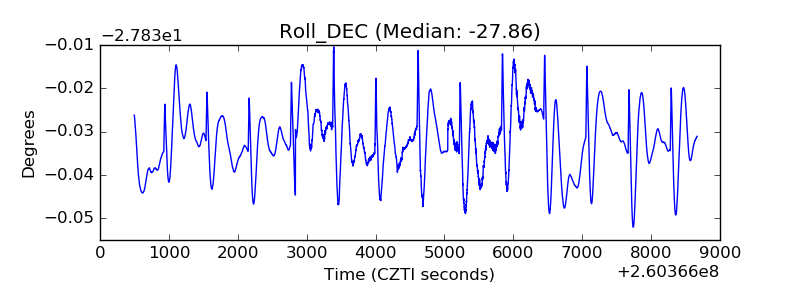 |
| _Roll_RA | 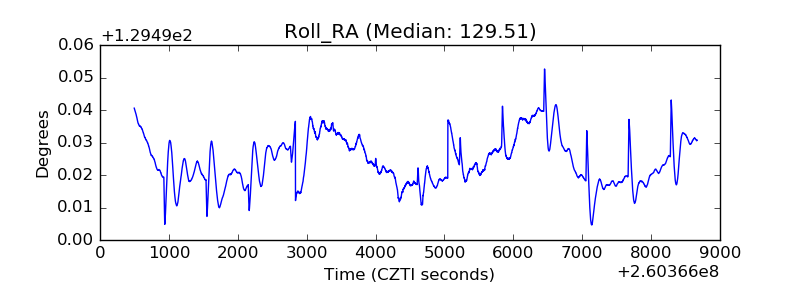 |
| Veto Counter | 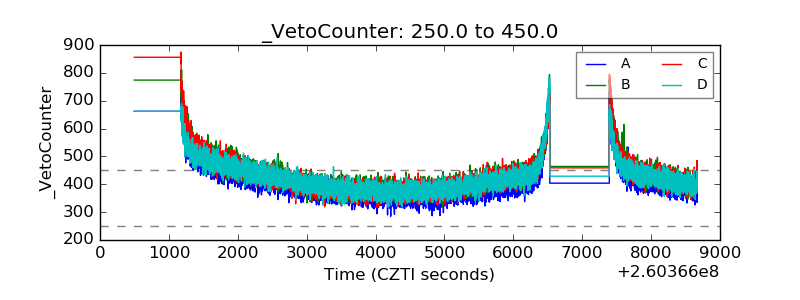 |