| Param | Original file | Final file |
|---|---|---|
| Filename | modeM0/AS1G08_047T01_9000002002_13581cztM0_level2.evt | modeM0/AS1G08_047T01_9000002002_13581cztM0_level2_quad_clean.evt |
| Size (bytes) | 526,014,720 | 100,287,360 |
| Size | 501.6 MB | 95.6 MB |
| Events in quadrant A | 3,521,323 | 641,960 |
| Events in quadrant B | 4,255,231 | 641,796 |
| Events in quadrant C | 3,725,250 | 639,012 |
| Events in quadrant D | 3,931,259 | 604,195 |
| Mode SS | |||
|---|---|---|---|
| Quadrant | BADHDUFLAG | Total packets | Discarded packets |
| A | 0 | 148 | 0 |
| B | 0 | 148 | 0 |
| C | 0 | 148 | 0 |
| D | 0 | 148 | 0 |
| Mode M0 | |||
|---|---|---|---|
| Quadrant | BADHDUFLAG | Total packets | Discarded packets |
| A | 0 | 15310 | 2 |
| B | 0 | 17357 | 1 |
| C | 0 | 15650 | 1 |
| D | 0 | 16764 | 1 |
| Mode M9 | |||
|---|---|---|---|
| Quadrant | BADHDUFLAG | Total packets | Discarded packets |
| A | 0 | 2 | 0 |
| B | 0 | 2 | 0 |
| C | 0 | 2 | 0 |
| D | 0 | 2 | 0 |
| Quadrant | Total seconds | Saturated seconds | Saturation percentage |
|---|---|---|---|
| A | 7329 | 69 | 0.941465% |
| B | 7329 | 265 | 3.615773% |
| C | 7329 | 51 | 0.695866% |
| D | 7329 | 192 | 2.619730% |
Noise dominated data is calculated using 1-second bins in cleaned event files. If a bin has >2000 counts, and if more than 50% of those come from <1% of pixels, then it is considered to be noise-dominated and hence unusable.
| Quadrant | # 1 sec bins | Bins with >0 counts | Bins with >2000 counts | High rate bins dominated by noise | Noise dominated (total time) | Noise dominated (detector-on time) | Marked lightcurve |
|---|---|---|---|---|---|---|---|
| A | 7490 | 7332 | 0 | 0 | 0.00% | 0.00% | 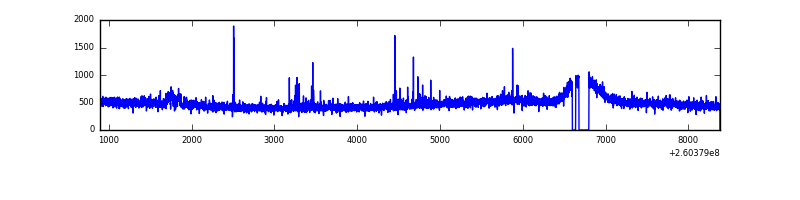 |
| B | 7490 | 7330 | 155 | 155 | 2.07% | 2.11% | 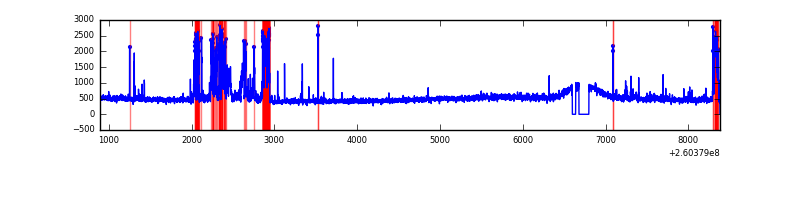 |
| C | 7490 | 7331 | 0 | 0 | 0.00% | 0.00% | 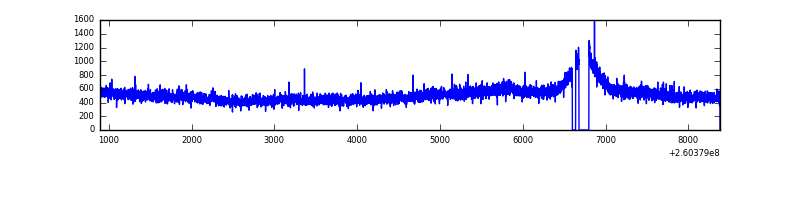 |
| D | 7490 | 7331 | 156 | 156 | 2.08% | 2.13% | 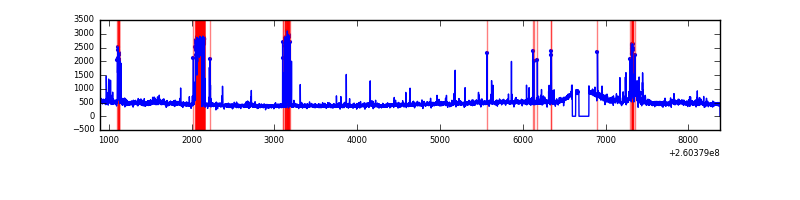 |
Top three noisy pixels from each quadrant. If the there are fewer than three noisy pixels in the level2.evt file, extra rows are filled as -1
| Pixel properties | Quadrant properties | ||||||
|---|---|---|---|---|---|---|---|
| Quadrant | DetID | PixID | Counts | Sigma | Mean | Median | Sigma |
| A | 1 | 162 | 38943 | 207.77 | 891 | 871 | 183.2 |
| A | 11 | 29 | 24570 | 129.34 | 891 | 871 | 183.2 |
| A | 1 | 178 | 12735 | 64.75 | 891 | 871 | 183.2 |
| B | 0 | 182 | 589197 | 3473.21 | 884 | 861 | 169.4 |
| B | 0 | 190 | 102426 | 599.58 | 884 | 861 | 169.4 |
| B | 0 | 214 | 32051 | 184.13 | 884 | 861 | 169.4 |
| C | 3 | 233 | 362678 | 1823.56 | 857 | 862 | 198.4 |
| C | 0 | 207 | 9046 | 41.25 | 857 | 862 | 198.4 |
| C | 13 | 61 | 6252 | 27.17 | 857 | 862 | 198.4 |
| D | 1 | 20 | 346027 | 1651.1 | 853 | 828 | 209.1 |
| D | 5 | 222 | 85621 | 405.57 | 853 | 828 | 209.1 |
| D | 13 | 249 | 68984 | 325.99 | 853 | 828 | 209.1 |
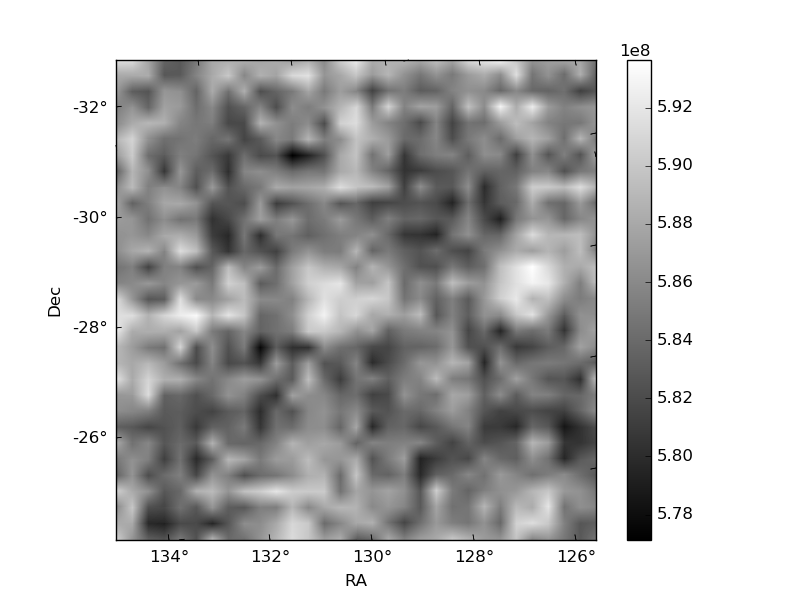
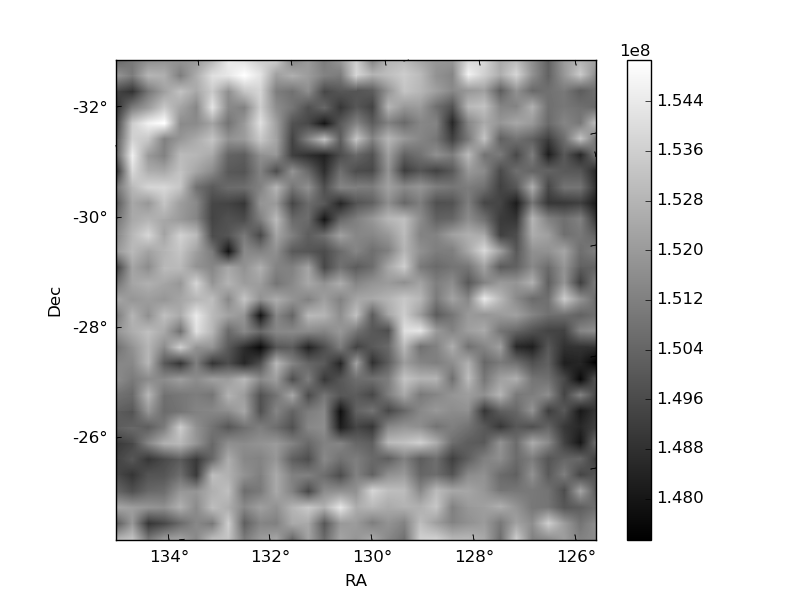
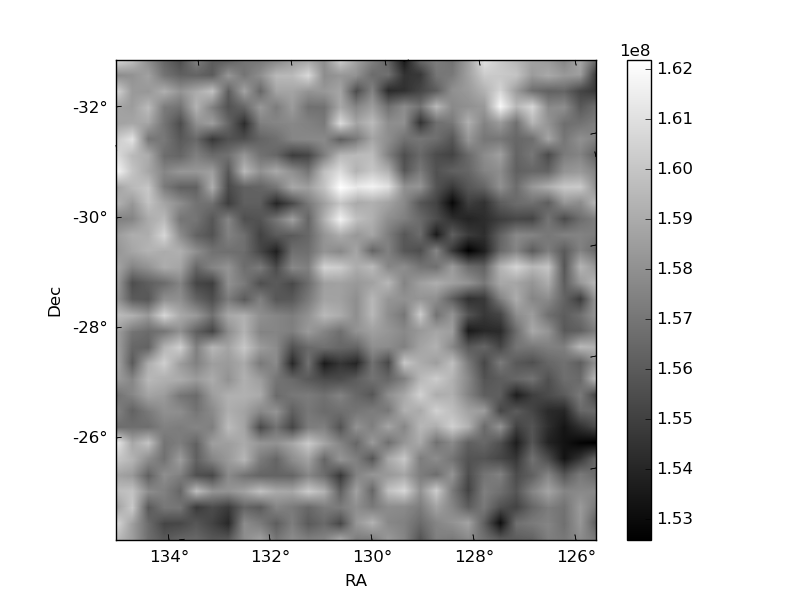
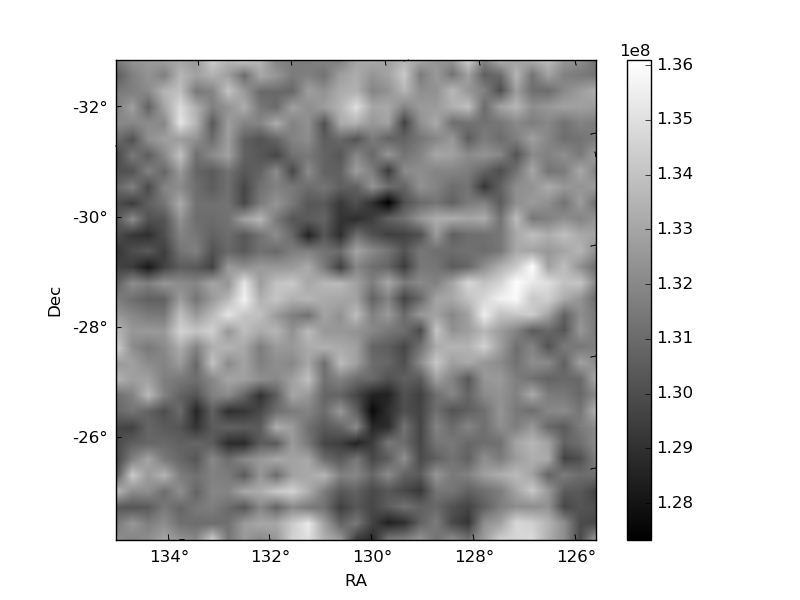
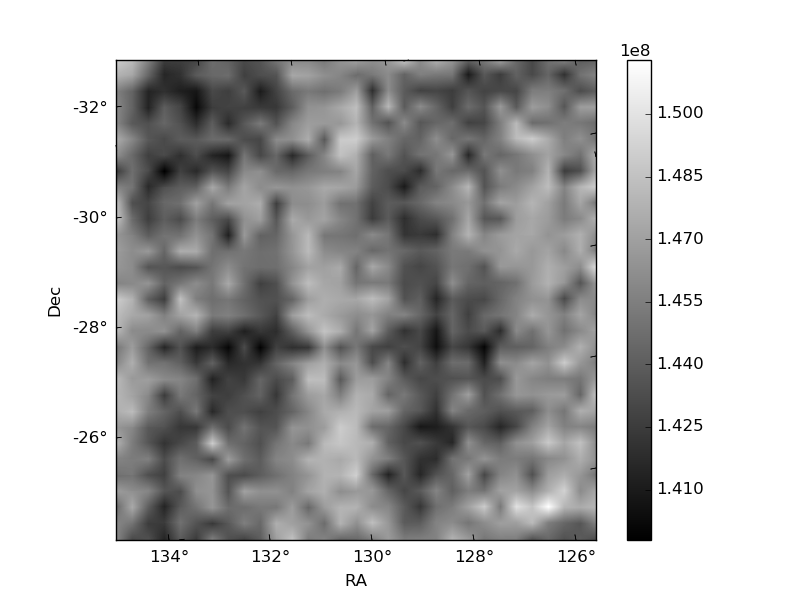
Histogram calculated using DETX and DETY for each event in the final _common_clean file
| Quadrant A | 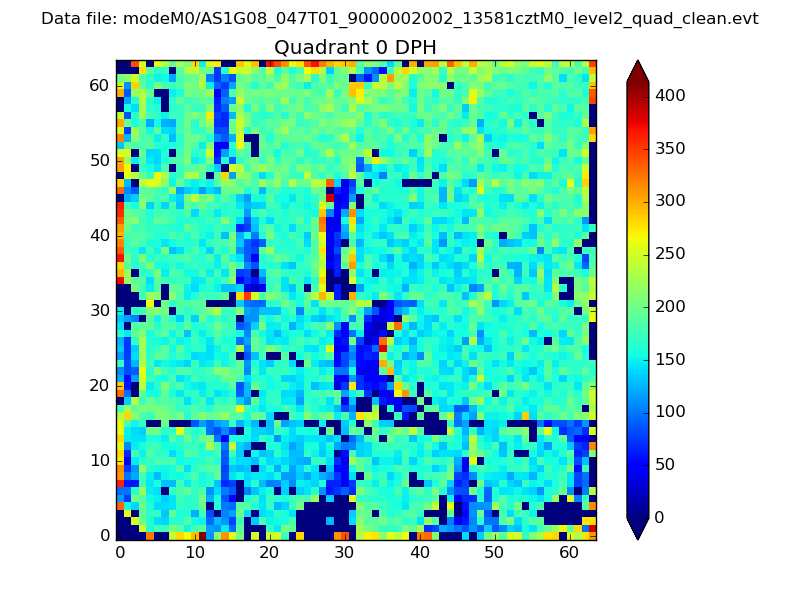 |
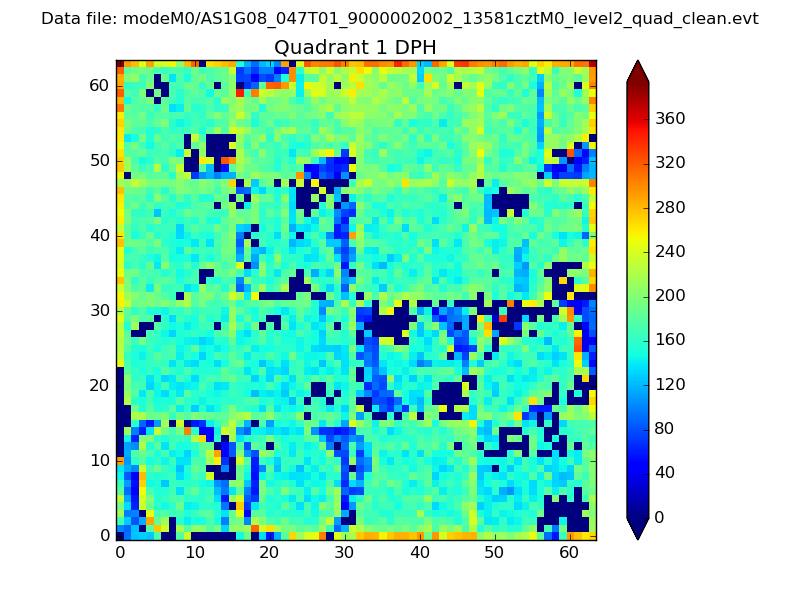 |
Quadrant B |
|---|---|---|---|
| Quadrant D |  |
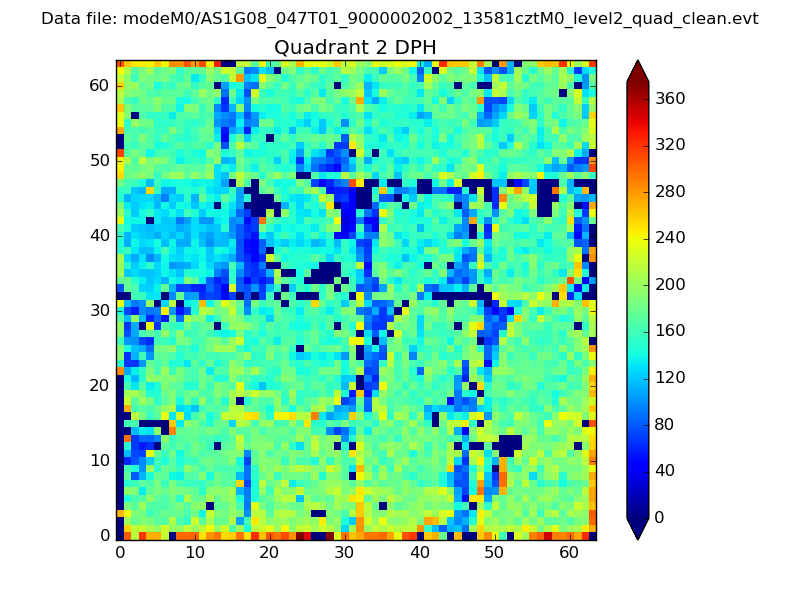 |
Quadrant C |
| Plot type | Count rate plots | Images |
|---|---|---|
| Comparison with Poisson distribution Blue bars denote a histogram of data divided into 1 sec bins. Red curve is a Poisson curve with rate = median count rate of data. |
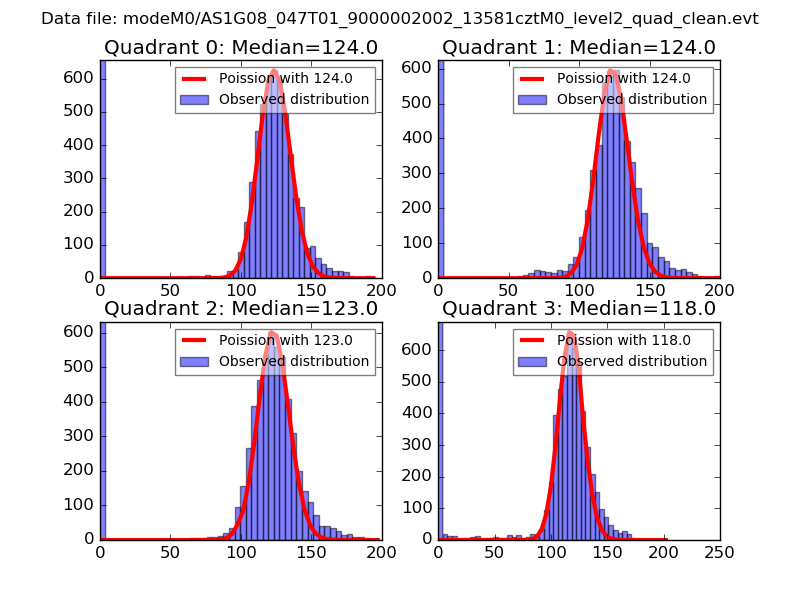 |
 |
| Quadrant-wise count rates Data is divided into 100 sec bins |
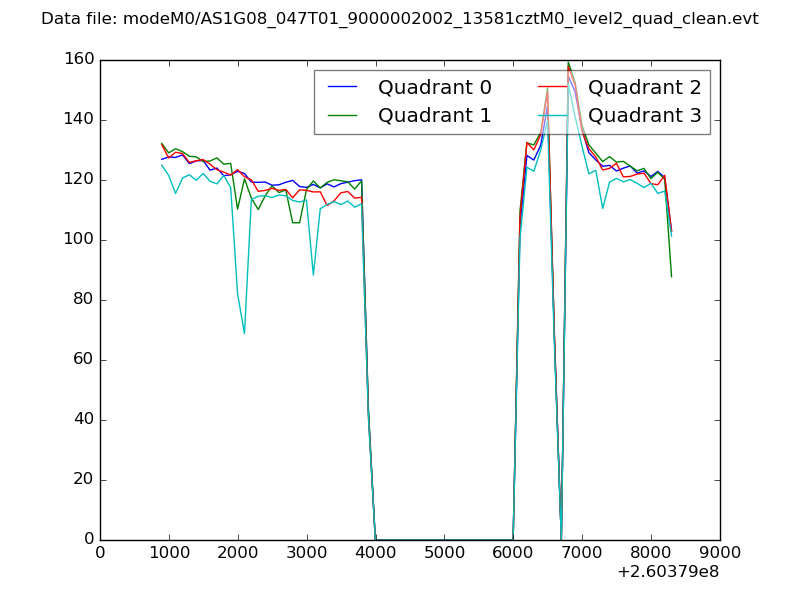 |
|
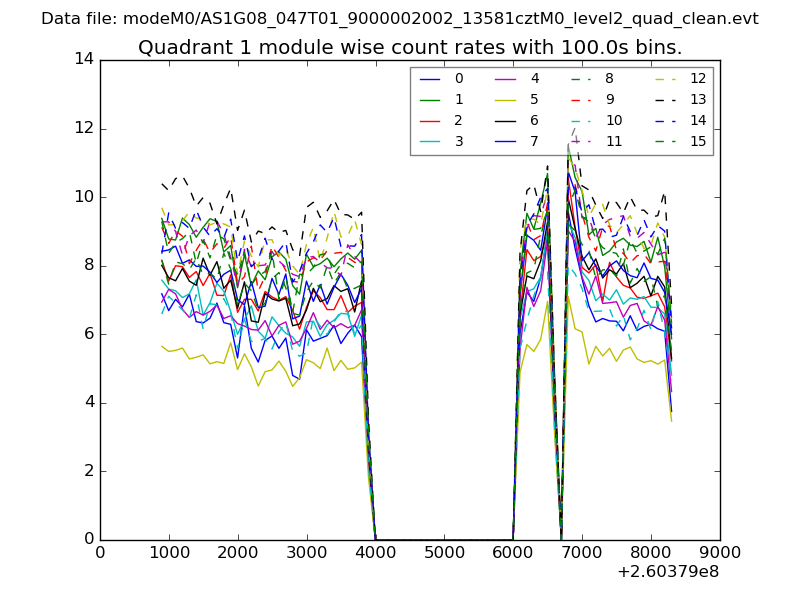
| Module-wise count rates for Quadrant A Data is divided into 100 sec bins |
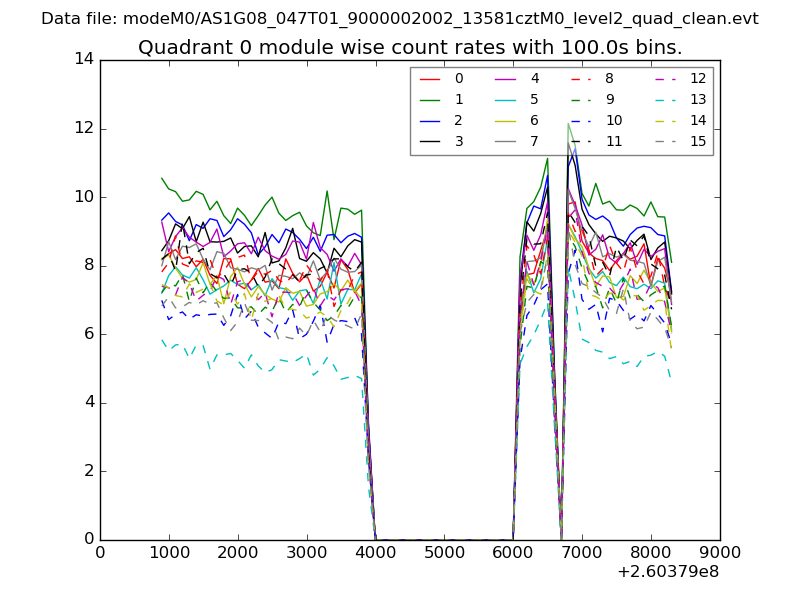 |
 |
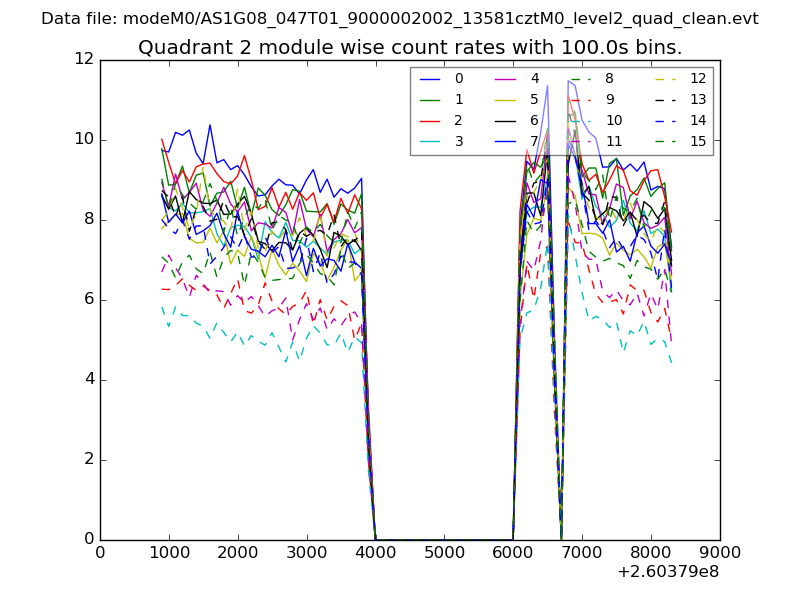
| Module-wise count rates for Quadrant B Data is divided into 100 sec bins |
 |
 |
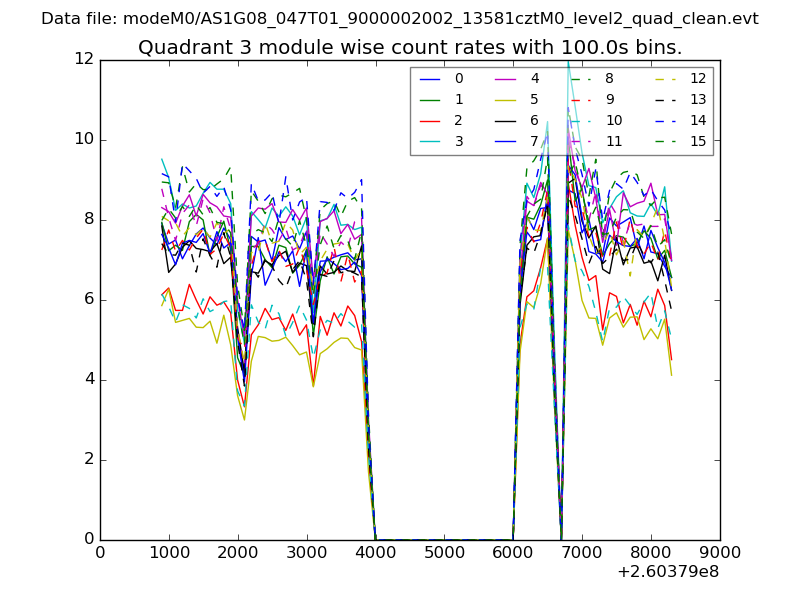
| Module-wise count rates for Quadrant C Data is divided into 100 sec bins |
 |
 |
| Module-wise count rates for Quadrant D Data is divided into 100 sec bins |
 |
 |
| Parameter | Plot |
|---|---|
| CZT HV Monitor | 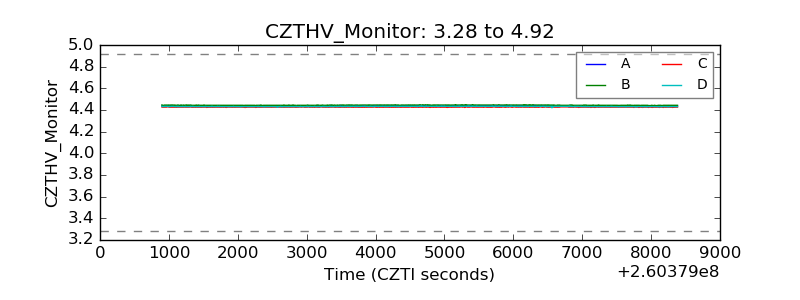 |
| D_VDD | 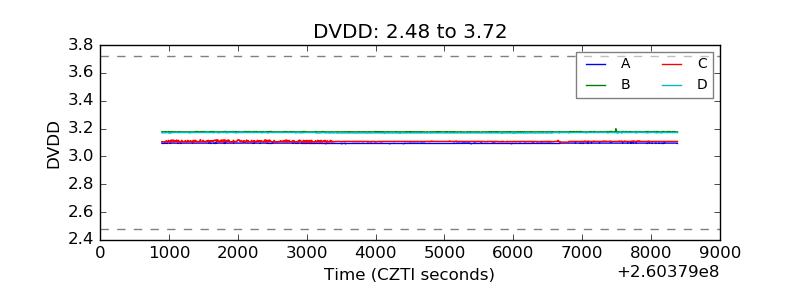 |
| Temperature 1 | 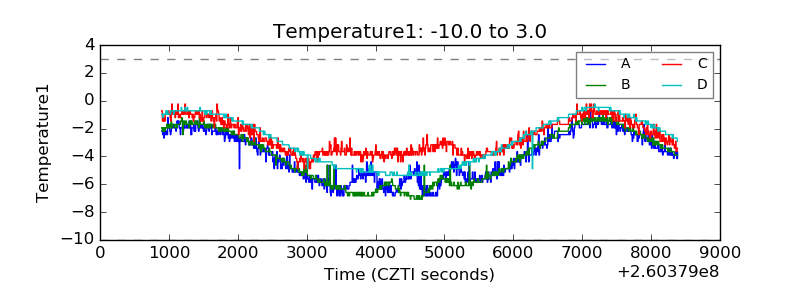 |
| Veto HV Monitor |  |
| Veto LLD | 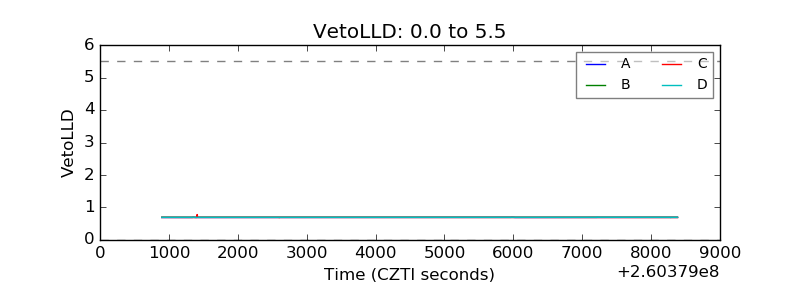 |
| Alpha Counter | 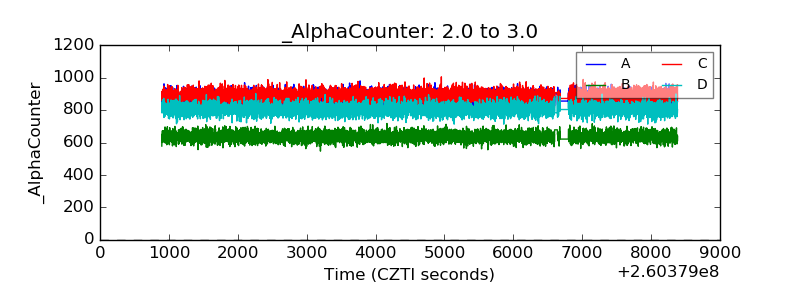 |
| _CPM_Rate | 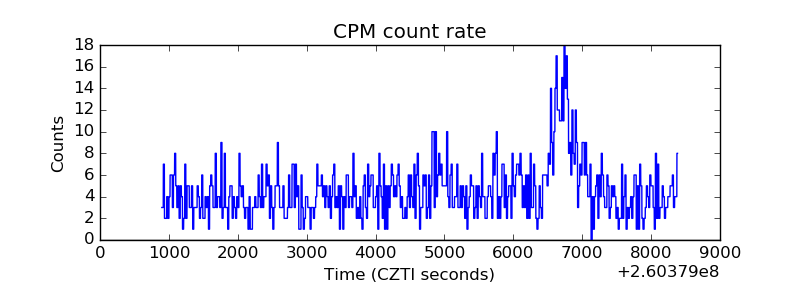 |
| CZT Counter | 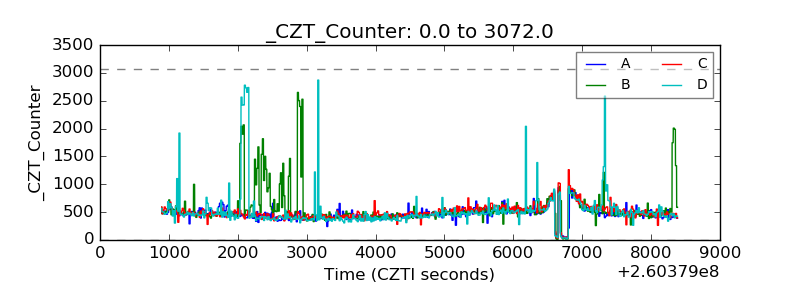 |
| +2.5 Volts monitor |  |
| +5 Volts monitor | 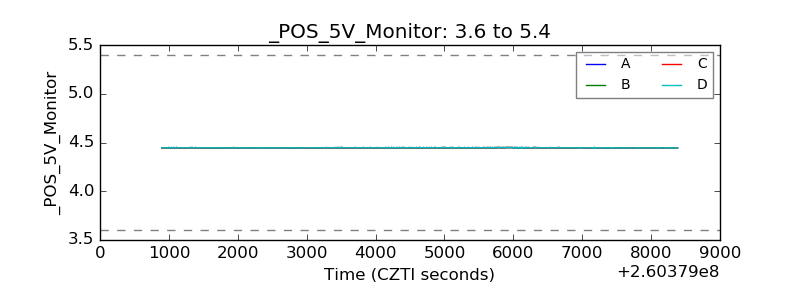 |
| _ROLL_ROT | 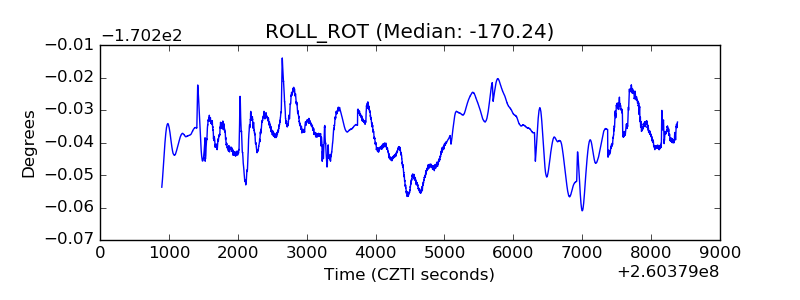 |
| _Roll_DEC | 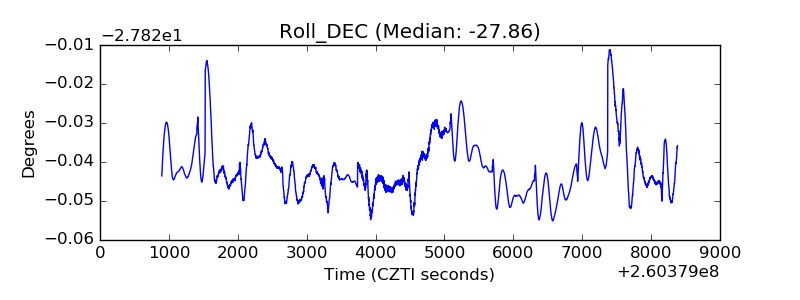 |
| _Roll_RA | 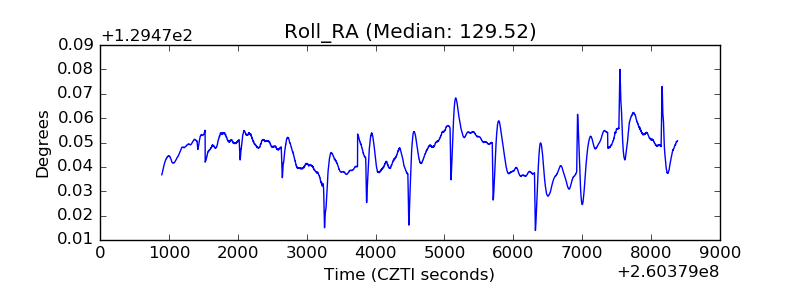 |
| Veto Counter | 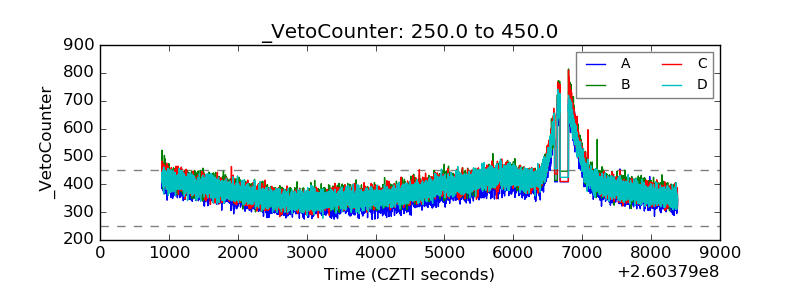 |