| Param | Original file | Final file |
|---|---|---|
| Filename | modeM0/AS1G08_047T01_9000002002_13582cztM0_level2.evt | modeM0/AS1G08_047T01_9000002002_13582cztM0_level2_quad_clean.evt |
| Size (bytes) | 504,633,600 | 90,717,120 |
| Size | 481.3 MB | 86.5 MB |
| Events in quadrant A | 3,202,579 | 577,517 |
| Events in quadrant B | 3,705,986 | 581,359 |
| Events in quadrant C | 3,434,705 | 573,945 |
| Events in quadrant D | 4,476,082 | 538,365 |
| Mode SS | |||
|---|---|---|---|
| Quadrant | BADHDUFLAG | Total packets | Discarded packets |
| A | 0 | 138 | 0 |
| B | 0 | 138 | 0 |
| C | 0 | 138 | 0 |
| D | 0 | 138 | 0 |
| Mode M0 | |||
|---|---|---|---|
| Quadrant | BADHDUFLAG | Total packets | Discarded packets |
| A | 0 | 14065 | 1 |
| B | 0 | 15494 | 1 |
| C | 0 | 14394 | 1 |
| D | 0 | 18095 | 1 |
| Mode M9 | |||
|---|---|---|---|
| Quadrant | BADHDUFLAG | Total packets | Discarded packets |
| A | 0 | 4 | 0 |
| B | 0 | 4 | 0 |
| C | 0 | 4 | 0 |
| D | 0 | 4 | 0 |
| Quadrant | Total seconds | Saturated seconds | Saturation percentage |
|---|---|---|---|
| A | 6831 | 24 | 0.351339% |
| B | 6831 | 104 | 1.522471% |
| C | 6831 | 9 | 0.131752% |
| D | 6831 | 345 | 5.050505% |
Noise dominated data is calculated using 1-second bins in cleaned event files. If a bin has >2000 counts, and if more than 50% of those come from <1% of pixels, then it is considered to be noise-dominated and hence unusable.
| Quadrant | # 1 sec bins | Bins with >0 counts | Bins with >2000 counts | High rate bins dominated by noise | Noise dominated (total time) | Noise dominated (detector-on time) | Marked lightcurve |
|---|---|---|---|---|---|---|---|
| A | 7167 | 6833 | 0 | 0 | 0.00% | 0.00% | 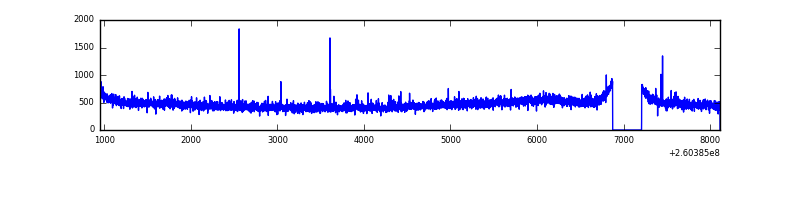 |
| B | 7167 | 6832 | 41 | 41 | 0.57% | 0.60% | 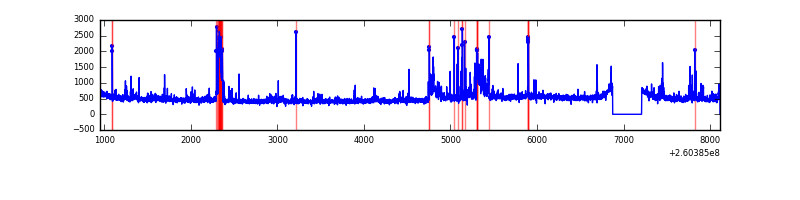 |
| C | 7167 | 6833 | 5 | 5 | 0.07% | 0.07% | 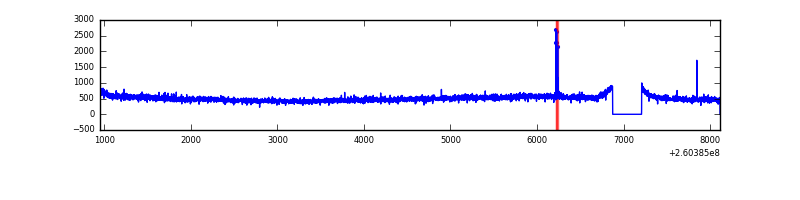 |
| D | 7167 | 6832 | 256 | 256 | 3.57% | 3.75% | 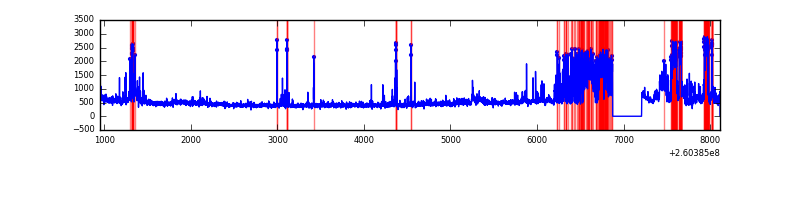 |
Top three noisy pixels from each quadrant. If the there are fewer than three noisy pixels in the level2.evt file, extra rows are filled as -1
| Pixel properties | Quadrant properties | ||||||
|---|---|---|---|---|---|---|---|
| Quadrant | DetID | PixID | Counts | Sigma | Mean | Median | Sigma |
| A | 1 | 162 | 23827 | 136.49 | 820 | 801 | 168.7 |
| A | 4 | 2 | 10488 | 57.42 | 820 | 801 | 168.7 |
| A | 0 | 226 | 7481 | 39.6 | 820 | 801 | 168.7 |
| B | 3 | 64 | 252656 | 1593.33 | 816 | 794 | 158.1 |
| B | 0 | 190 | 108854 | 683.61 | 816 | 794 | 158.1 |
| B | 0 | 189 | 48827 | 303.87 | 816 | 794 | 158.1 |
| C | 3 | 233 | 330821 | 1806.73 | 788 | 793 | 182.7 |
| C | 14 | 234 | 22808 | 120.52 | 788 | 793 | 182.7 |
| C | 13 | 61 | 5812 | 27.48 | 788 | 793 | 182.7 |
| D | 5 | 222 | 1017921 | 5472.53 | 777 | 756 | 185.9 |
| D | 1 | 20 | 194714 | 1043.53 | 777 | 756 | 185.9 |
| D | 10 | 157 | 86134 | 459.35 | 777 | 756 | 185.9 |
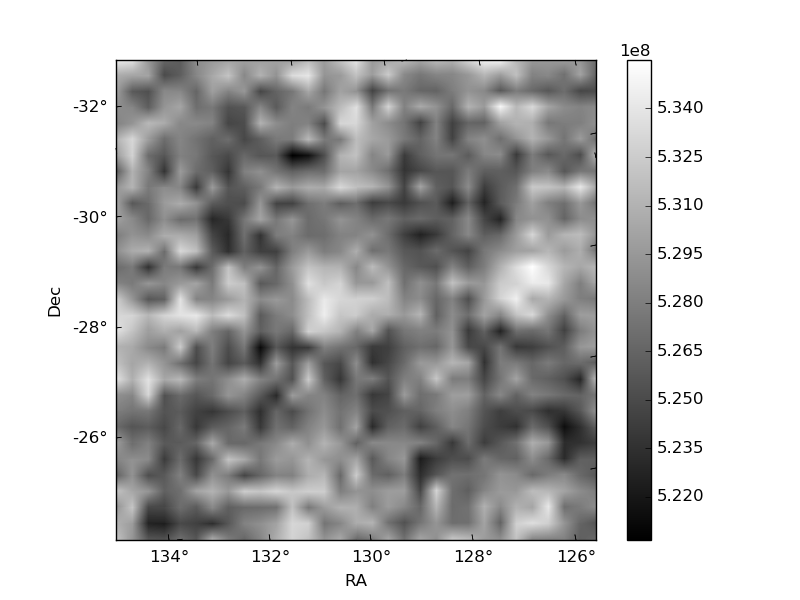
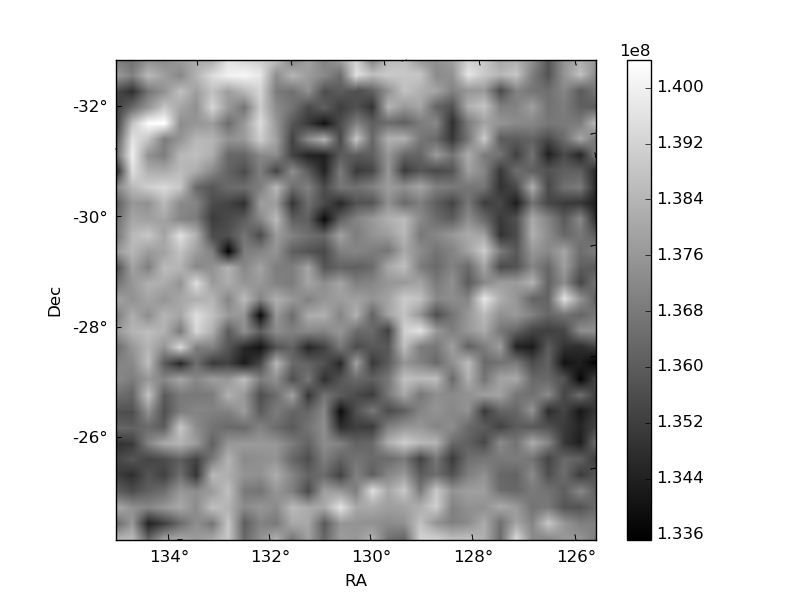
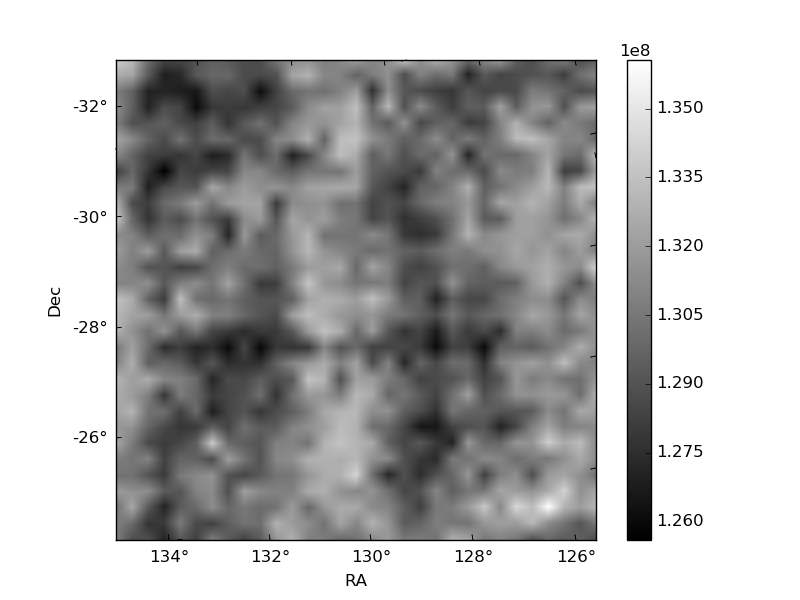
Histogram calculated using DETX and DETY for each event in the final _common_clean file
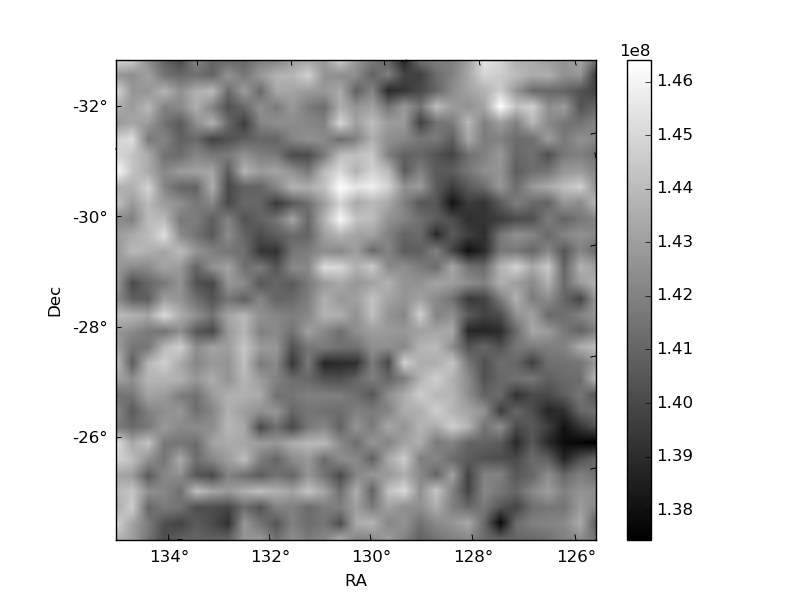
| Quadrant A | 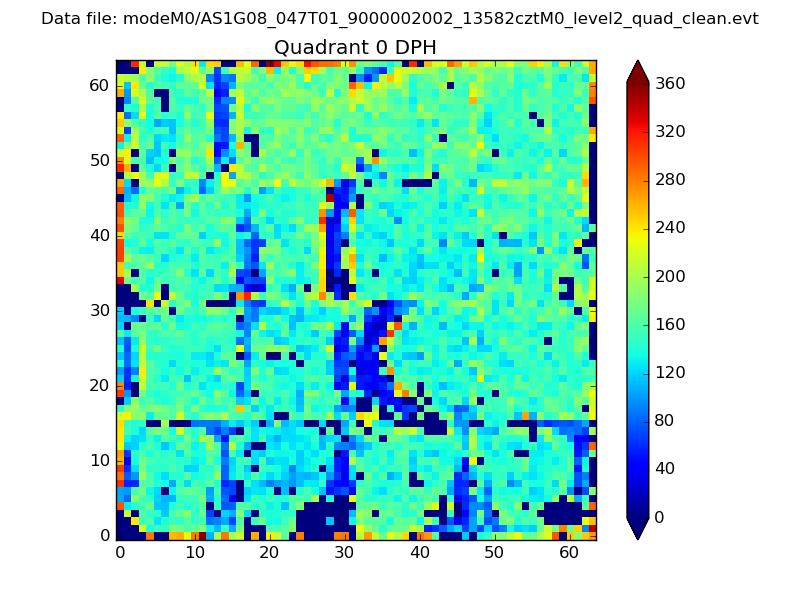 |
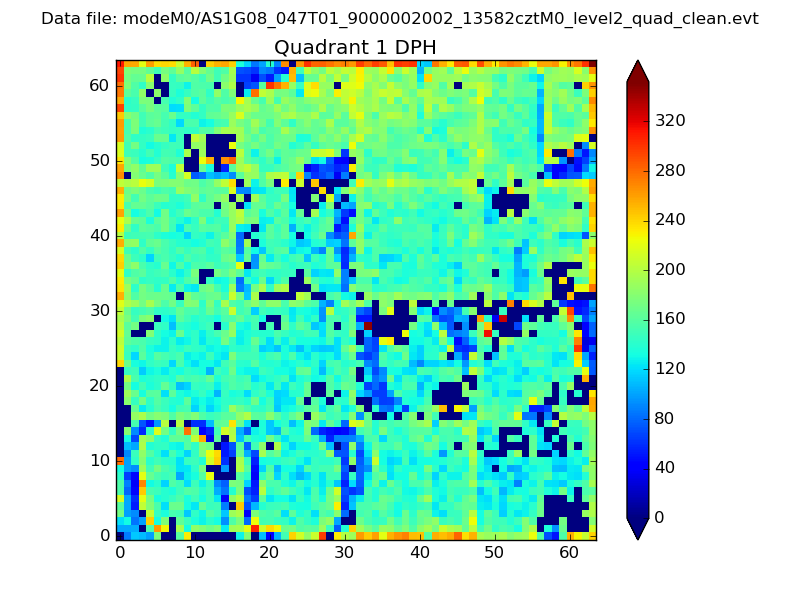 |
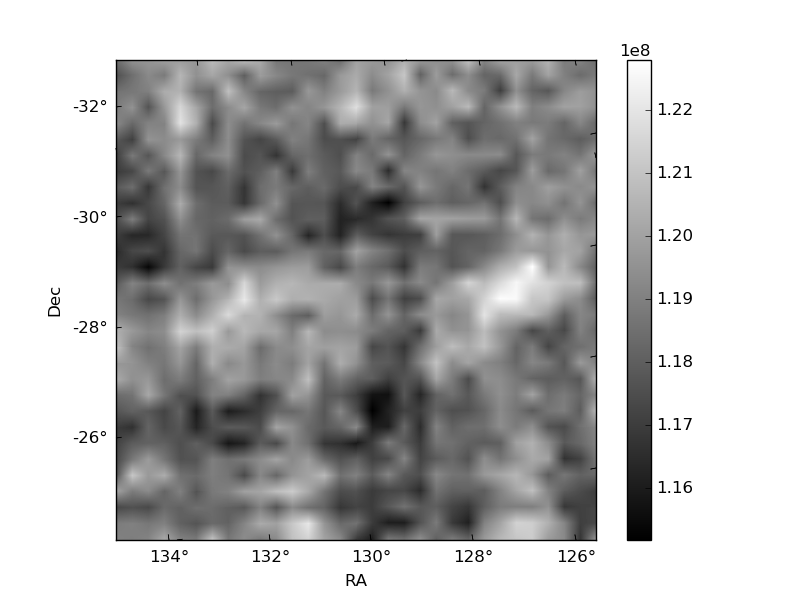
Quadrant B |
|---|---|---|---|
| Quadrant D | 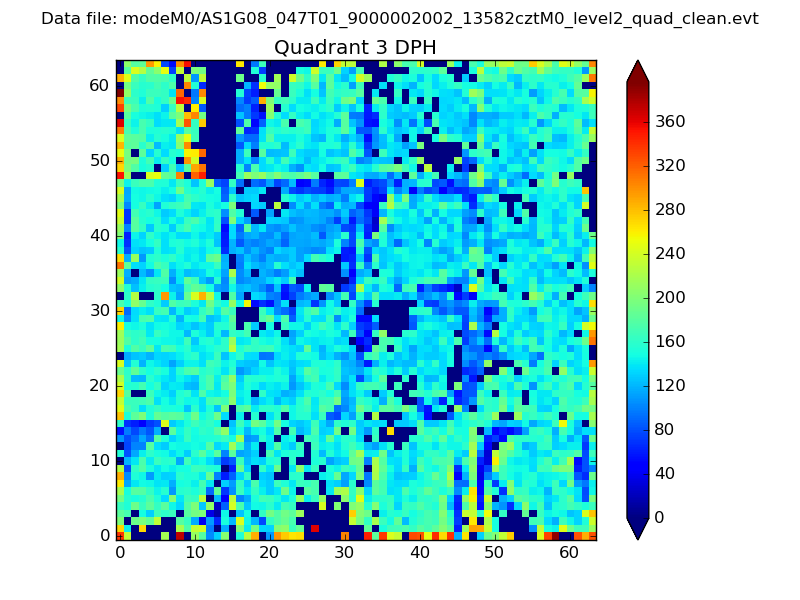 |
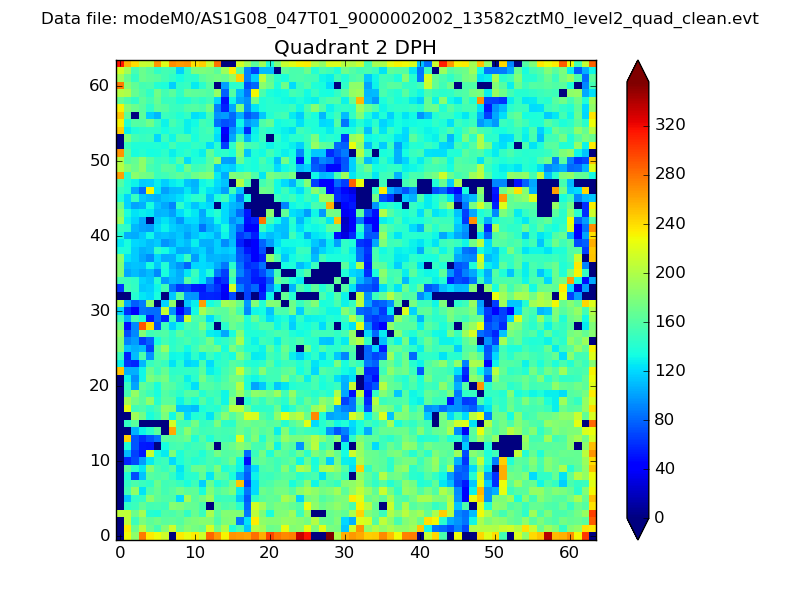 |
Quadrant C |
| Plot type | Count rate plots | Images |
|---|---|---|
| Comparison with Poisson distribution Blue bars denote a histogram of data divided into 1 sec bins. Red curve is a Poisson curve with rate = median count rate of data. |
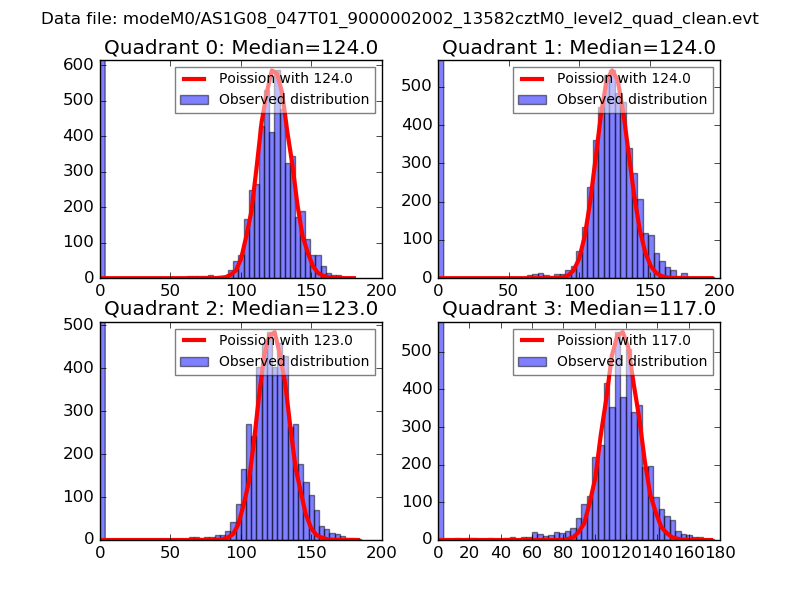 |
 |
| Quadrant-wise count rates Data is divided into 100 sec bins |
 |
|
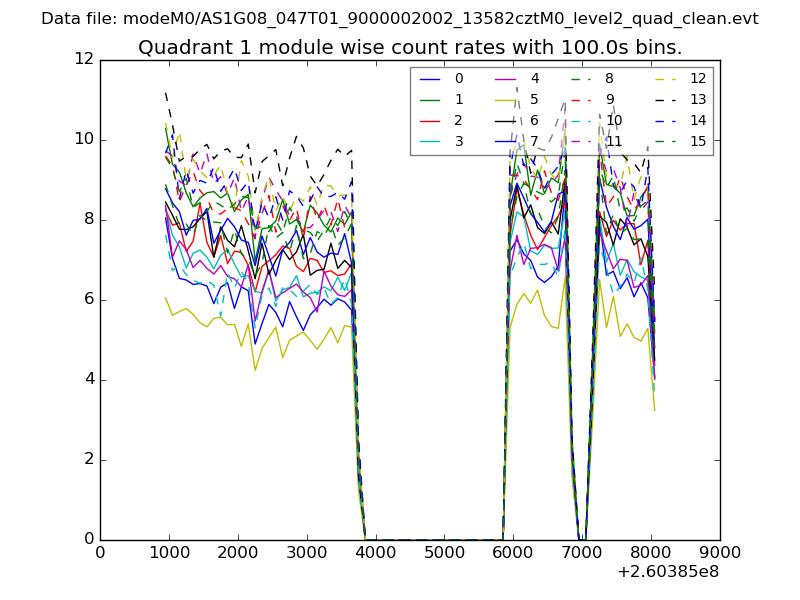
| Module-wise count rates for Quadrant A Data is divided into 100 sec bins |
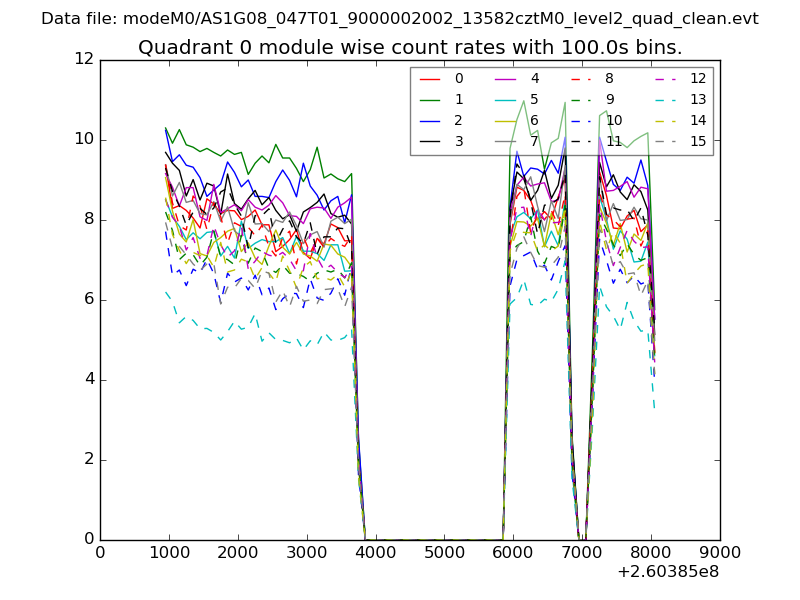 |
 |
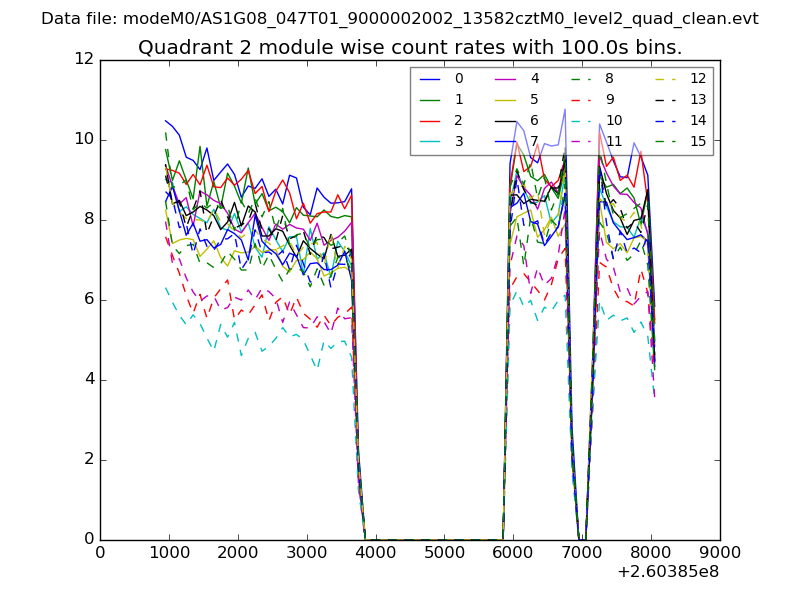
| Module-wise count rates for Quadrant B Data is divided into 100 sec bins |
 |
 |
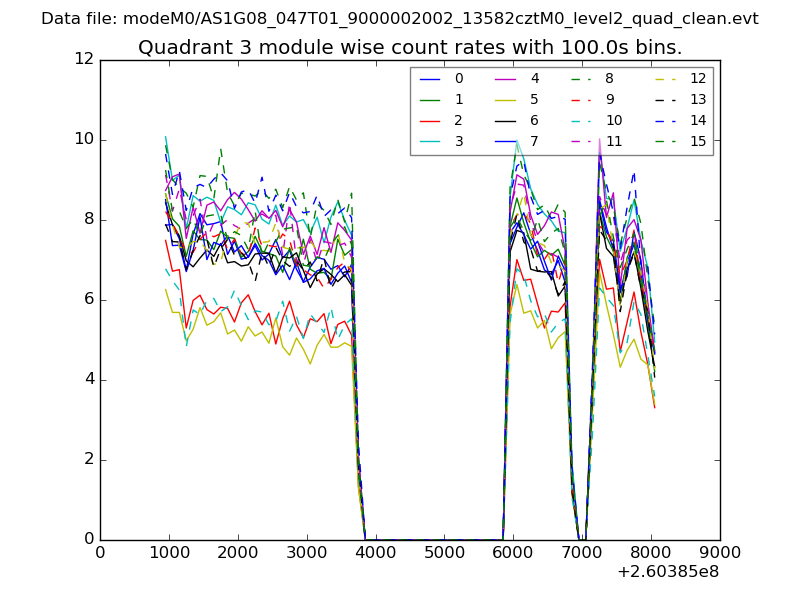
| Module-wise count rates for Quadrant C Data is divided into 100 sec bins |
 |
 |
| Module-wise count rates for Quadrant D Data is divided into 100 sec bins |
 |
 |
| Parameter | Plot |
|---|---|
| CZT HV Monitor | 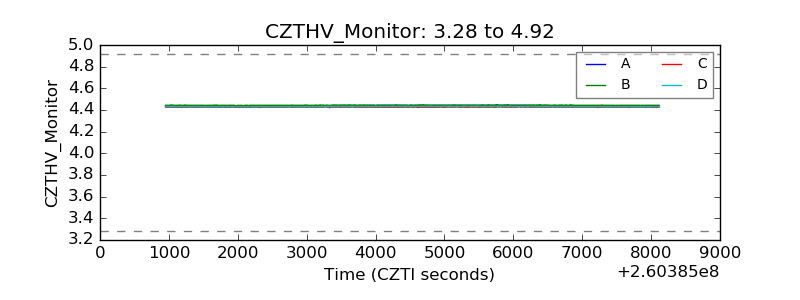 |
| D_VDD | 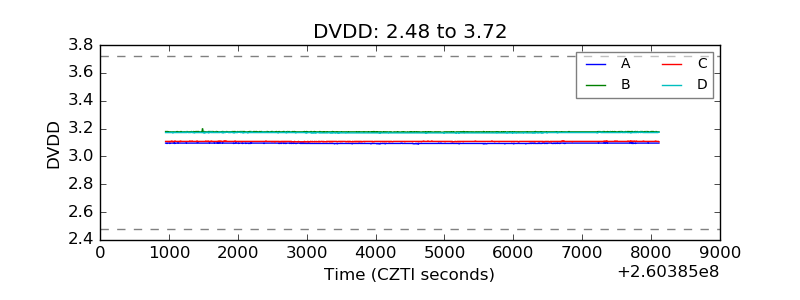 |
| Temperature 1 | 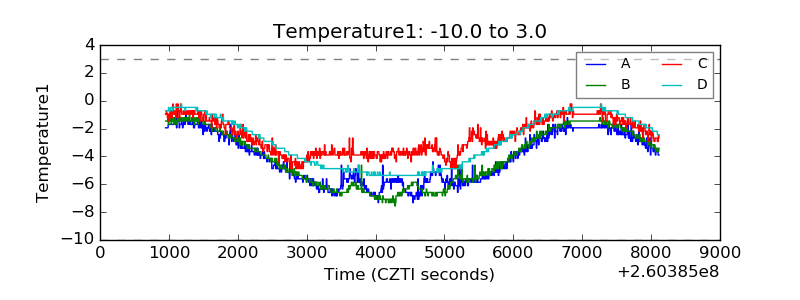 |
| Veto HV Monitor | 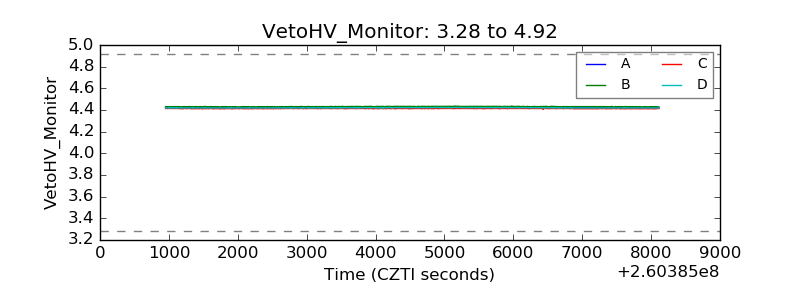 |
| Veto LLD | 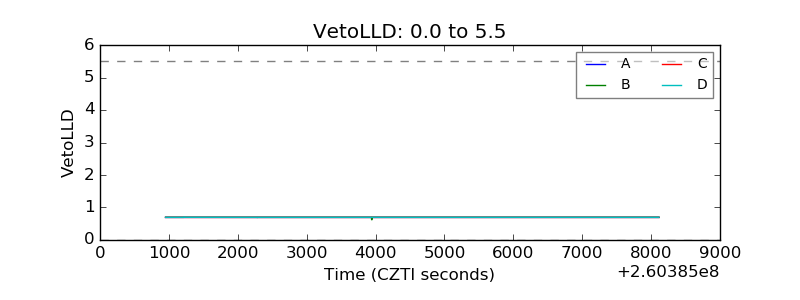 |
| Alpha Counter | 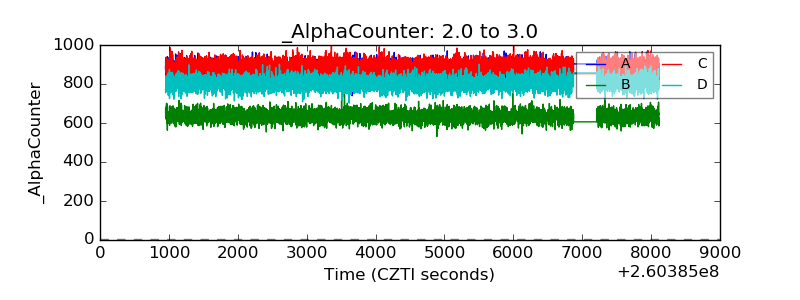 |
| _CPM_Rate | 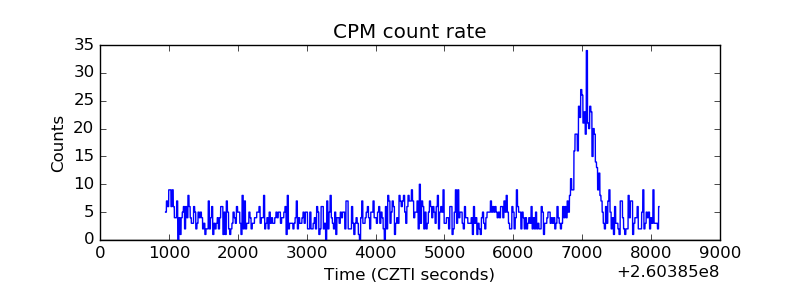 |
| CZT Counter | 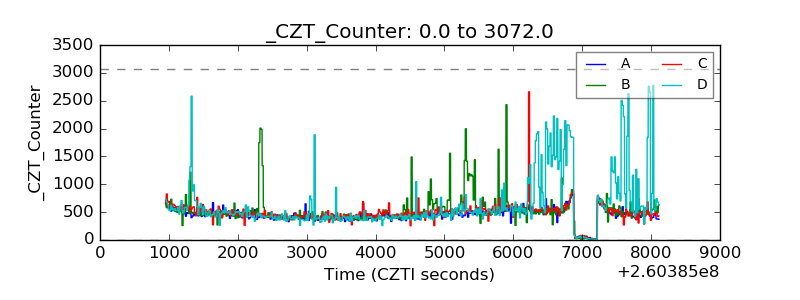 |
| +2.5 Volts monitor |  |
| +5 Volts monitor |  |
| _ROLL_ROT | 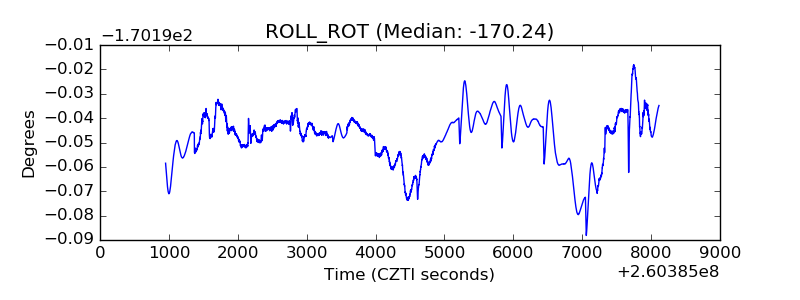 |
| _Roll_DEC | 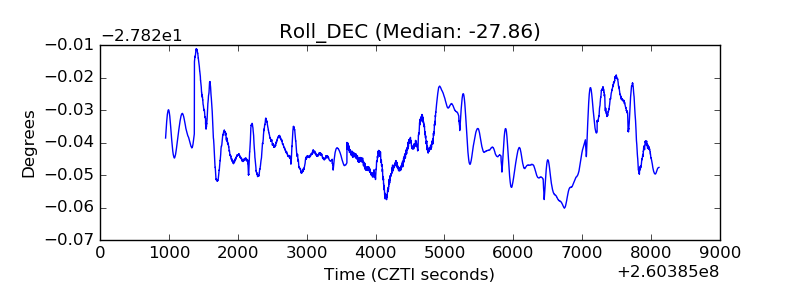 |
| _Roll_RA | 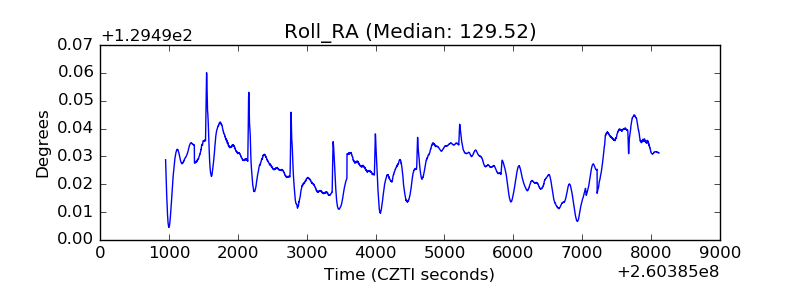 |
| Veto Counter | 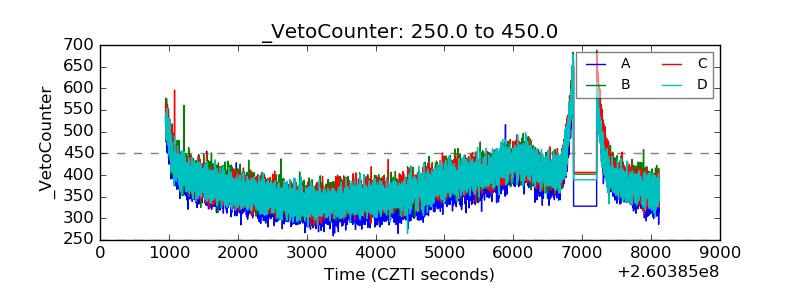 |